An observer, in a laboratory, starts with N0 nuclei of a radioactive sample and keeps on observing the number (N) of left over nuclei at regular intervals of 10 minutes each. She prepares the following table on the basis of her observations :

Use this data to plot a graph of loge(N0N) vs time (t) and calculate the (i) decay constant and
(ii) half-life of the given sample.

The graph plotted between loge(N0N) and time t is as shown in Fig. 13.09. The graph is a straight line graph.
(i) As per relation N=N0eλt, we have loge(N0N)=λt
∴ decay constant λ=loge(N0N)t= slope of plotted curve ⇒λ=3.46510min=3.465(10×60)s=5.775×10⁻³s−1
(ii) Half-life of given sample T12=0.693λ=0.6935.775×10−3=120s=2min.
Topper's Solved these Questions
- NUCLEIBOOK - U-LIKE SERIESCHAPTER - NUCLEIEXERCISE - Long Answer Question-II
2 Videos
- NUCLEIBOOK - U-LIKE SERIESCHAPTER - NUCLEIEXERCISE - Self Assessment Test
10 Videos
- NUCLEIBOOK - U-LIKE SERIESCHAPTER - NUCLEIEXERCISE - Short Answer Questions
28 Videos
- MOVING CHARGES AND MAGNETISM BOOK - U-LIKE SERIESCHAPTER - MOVING CHARGES AND MAGNETISM EXERCISE - SELF ASSESSMENT TEST (SECTION D)
1 Videos
- RAY OPTICS AND OPTICAL INSTRUMENTSBOOK - U-LIKE SERIESCHAPTER - RAY OPTICS AND OPTICAL INSTRUMENTSEXERCISE - SELF ASSESSMENT TEST (SECTION B)
3 Videos
Similar Questions
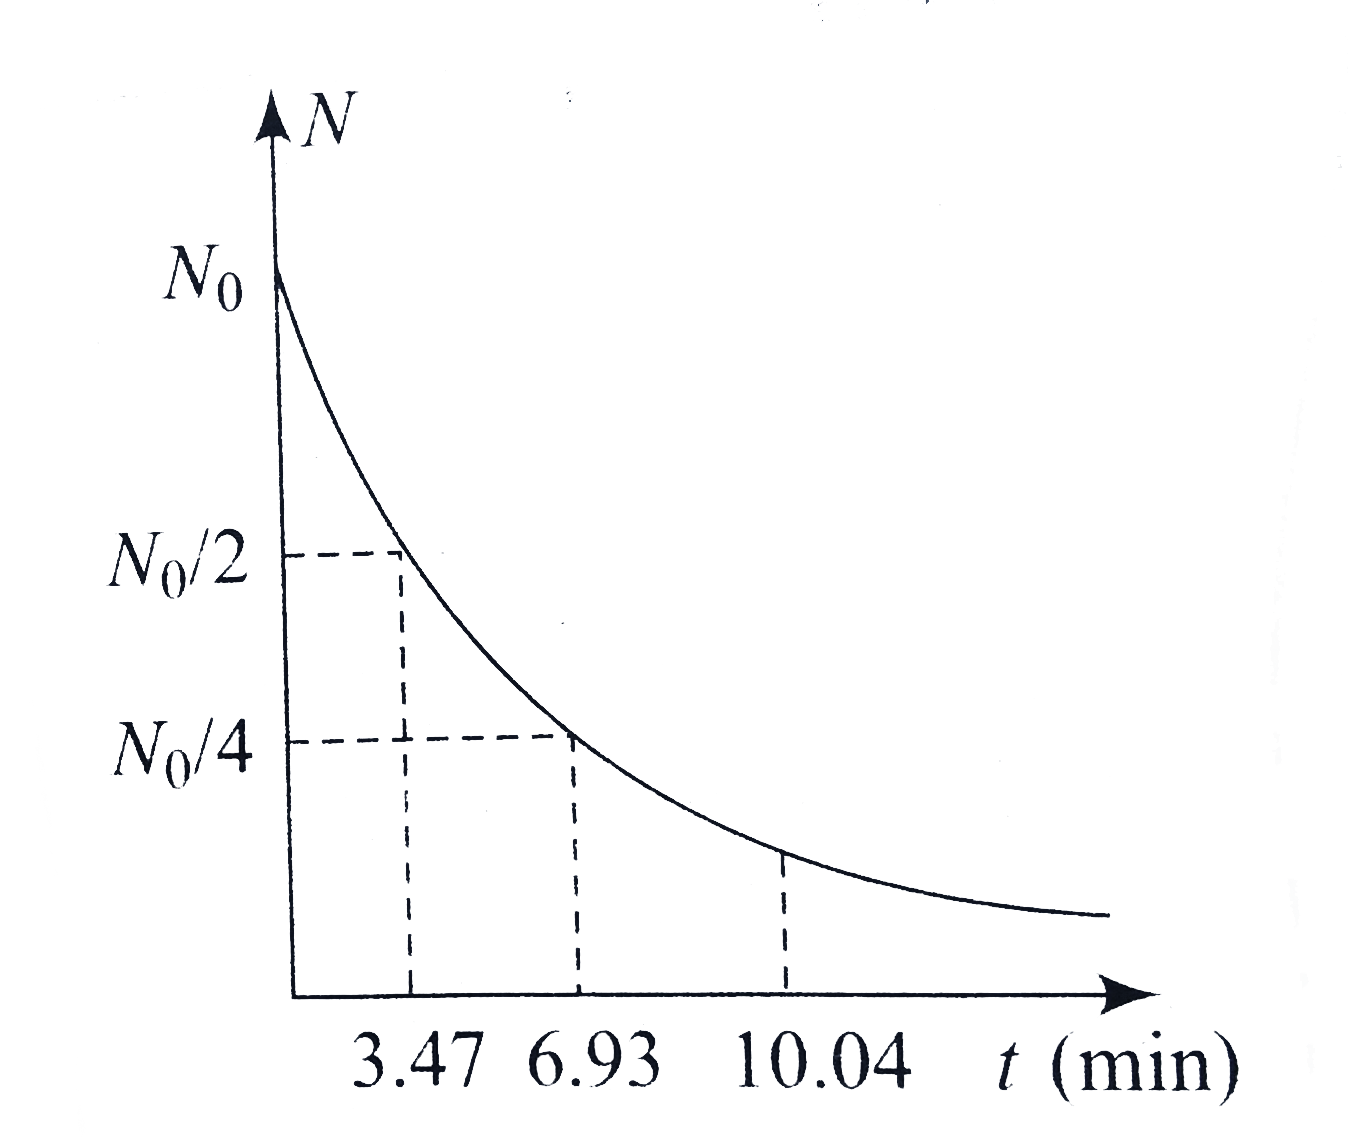
An observer in a laboratory starts with N0 nuclei of a radioactive sample and keeps on observing the number (N) of leftover nuclei at regular intervals of 10 minutes each. She prepares the following table on the basis of her observation.

Use this data to plot a graph of loge(N0/N) vs time (t) and calculate the
(a) decay constant
(b) half-life of the given sample.
View SolutionA radioactive sample undergoes decay as per the following gragp. At timet=0, the number of undecayed nuclei is N0. Calculate the number of nuclei left after 1h.
 .
.
View Solution
Knowledge Check
If N0 is the number of radioactive nuclei initially present , then the number of nuclei remaining undecayed at the end of nth half life is
A2−nN0B2−nN0C2−nN0D2−nN0A radioactive sample undergoes decay as per the following gragp. At timet=0, the number of undecayed nuclei is N0. Calculate the number of nuclei left after 1h.
 .AN0/e8BN0/e10CN0/e12DN0/e14
The half life of a radioactive substance is T0. At t=0,the number of active nuclei are N0. Select the correct alternative.
AThe number of nuclei decayed in time internal 0−t is N0e−λtBThe number of nuclei decays in time interval 0−t is N0(1−e−λt)CThe probability that a radioactive nuclei does not decay in interval 0−t is e−λtDThe probability that a radioactive nuclei does not decay in interval 1−e−λt
A radioactive sample undergoes decay as per the following gragp. At timet=0, the number of undecayed nuclei is N0. Calculate the number of nuclei left after 1h.
 .
.
View SolutionThalassemia and sickle cell anemia are caued due to problem in globin molecule synthesis . Select the correct statement.
View SolutionFour thousand active nuclei of a radioactive material are present at t=0. After 60 minutes 500 active nuclei are left in the sample. The decay constant of the sample is
View SolutionFour thousand active nuclei of a radioactive material are present at t=0. After 60 minutes 500 active nuclei are left in the sample. The decay constant of the sample is
View SolutionThere are n number of radioactive nuclei in a sample that undergoes beta decay. If from the sample, n' number of β-particels are emitted every 2s, then half-life of nuclei is .
View Solution
