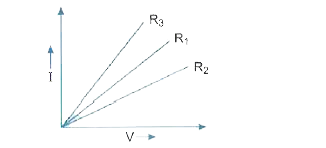
A student plots V-I graphs for three samples of nichrome wire with resistances , and .
Choose from the following the statement that holds true for this graph.
The correct Answer is:D
[Hint : Slope of I-V graph gives the value of .]
Topper's Solved these Questions
- BOOK - U-LIKE SERIESCHAPTER - CBSE EXAMINATION PAPER 2020 (SOLVED)EXERCISE - SECTION B26videos
CBSE EXAMINATION PAPER 2020 (SOLVED)
- BOOK - U-LIKE SERIESCHAPTER - CBSE EXAMINATION PAPER 2020 (SOLVED)EXERCISE - SECTION C18videos
CBSE EXAMINATION PAPER 2020 (SOLVED)
- BOOK - U-LIKE SERIESCHAPTER - CBSE EXAMINATION PAPER 2020EXERCISE - SECTION C25videos
CBSE EXAMINATION PAPER 2020
- BOOK - U-LIKE SERIESCHAPTER - CBSE SAMPLE QUESTION PAPER 2019 - 20 (SOLVED)EXERCISE - SECTION A10videos
CBSE SAMPLE QUESTION PAPER 2019 - 20 (SOLVED)
Similar Questions
Knowledge Check
- Question 1 - Select One
A student carries out an experiment and plots the V−I graphs of three samples of nichrome wire with resistances R1,R2andR3 respectively, (Fig. 3.41). Which of the following is true ?
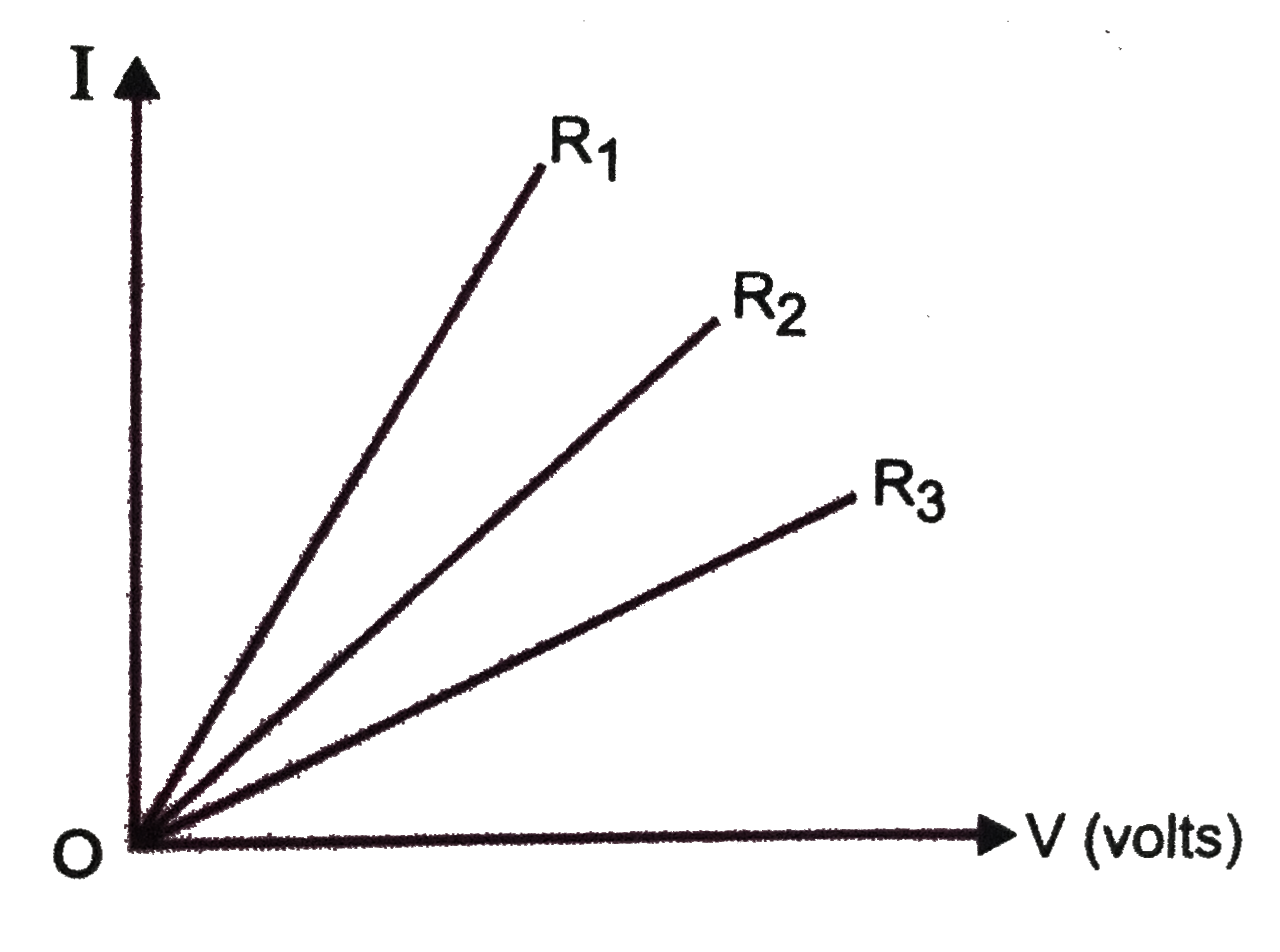 AR1=R2=R3BR1>R2>R3CR3>R2>R1DR2>R3>R1
 - Question 2 - Select One
V−i graphs of anichrome wire at three different temeperatures t1, t2 and t3 are shown. From the graph.
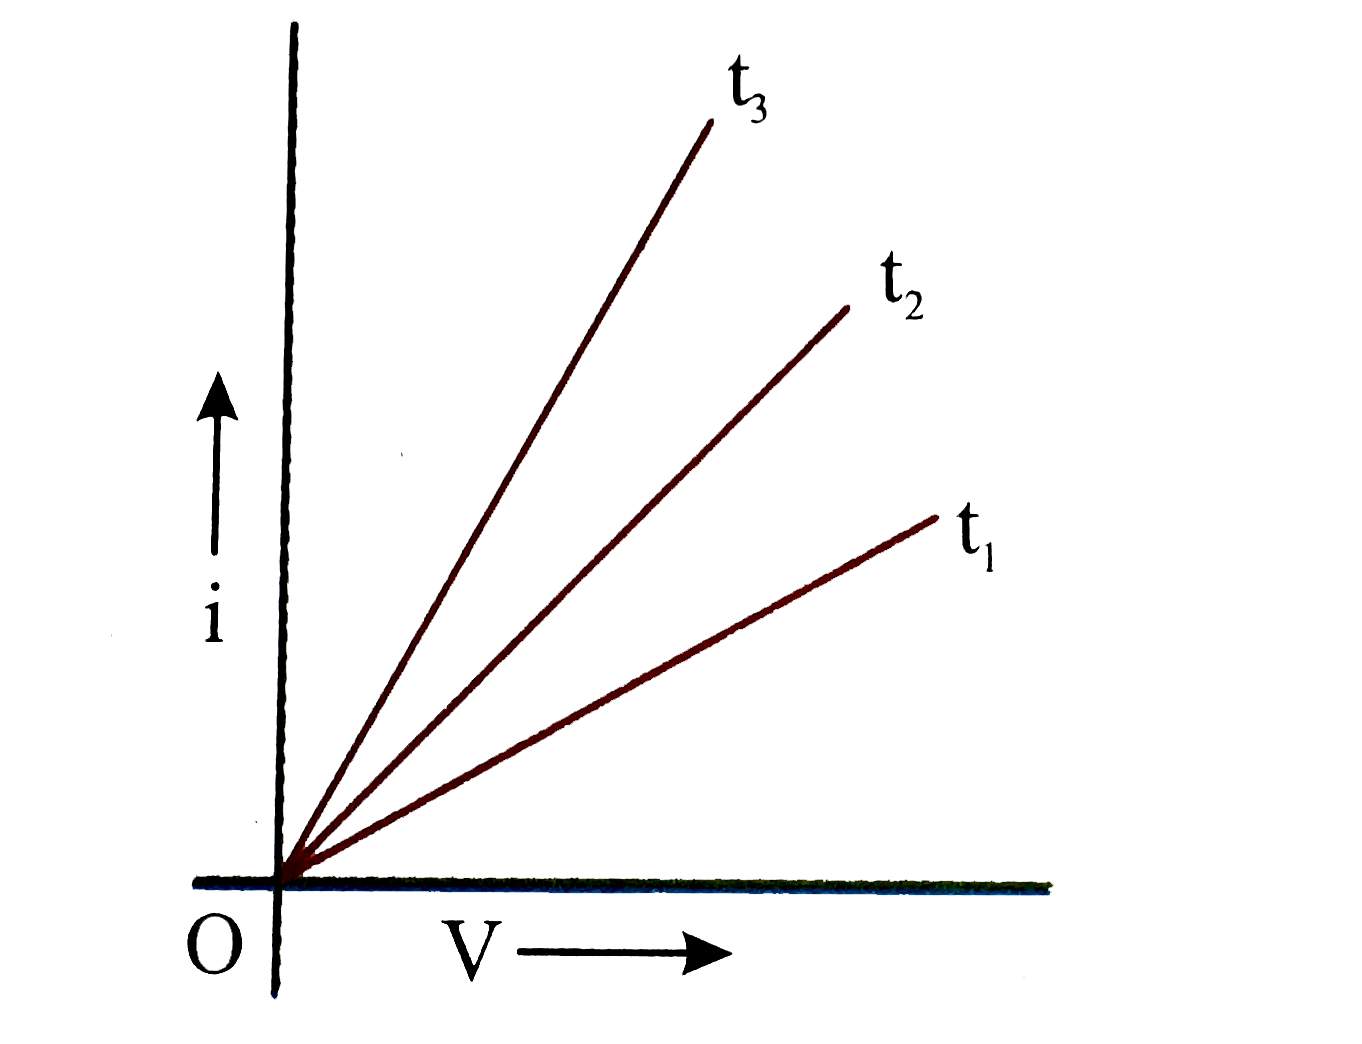 At1<t2<t3Bt1>t2>t3Ct1<t2>t3Dt1>t2<t3
 - Question 3 - Select One
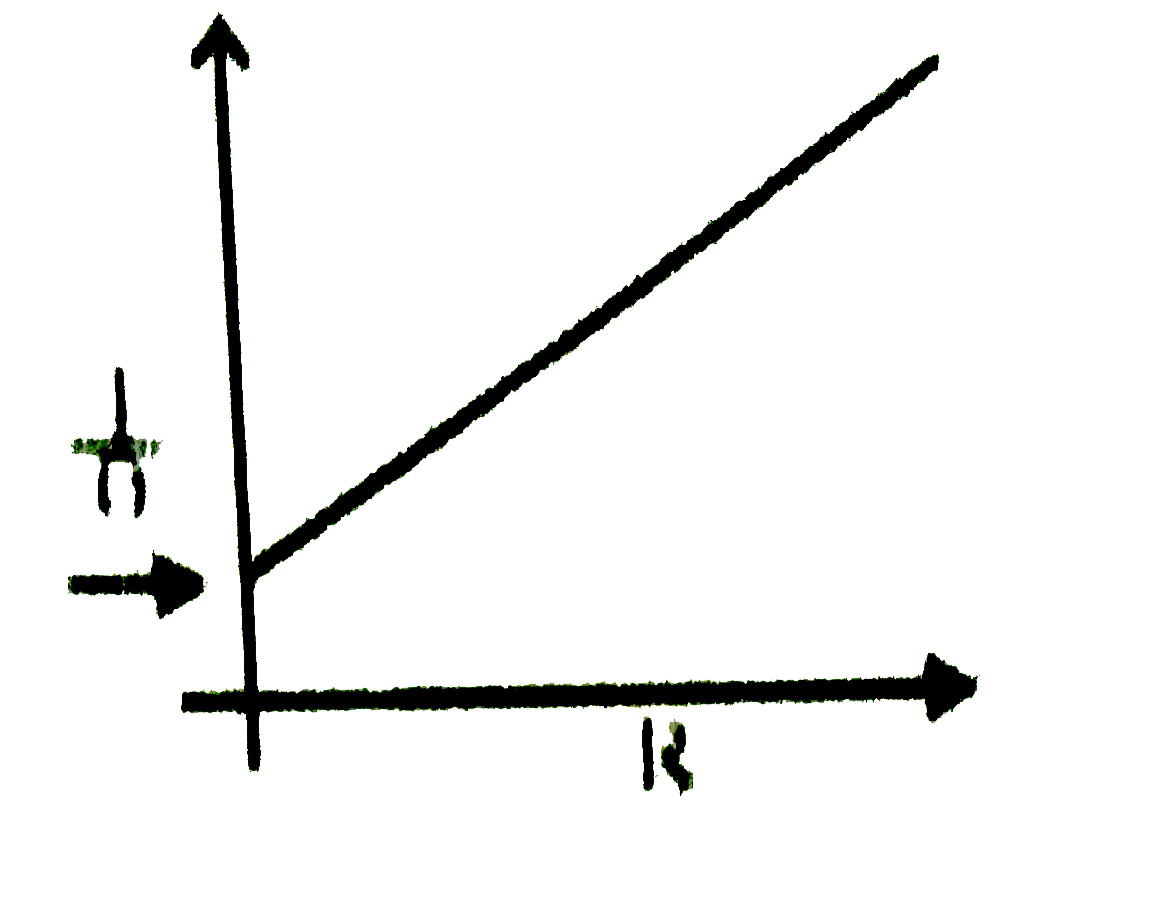
A student plots a graph between the resistance R and the reciprocal of deflection θ for the give galvanometer. The graph obtained is as shown in figure. From the graph he can calculate the resitance of galvanometer asAratio of slope to interceptBratio of intercept to slopeCproduct of slope and interceptDgalvanometer resistance can not be calculated from it.
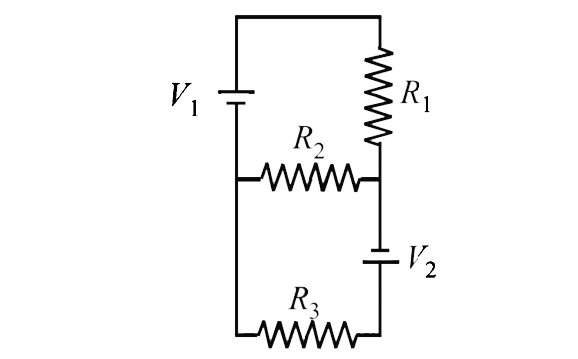
Two ideal batteries of emf V1andV2 and three resistances R1,R2andR3 are connected as shown in the figure. The current in resistance R2 would be zero if
 View Solution
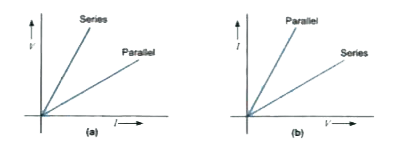
Two students perform the experiment on series and parallel combinations of two given resistors R1 and R2 and plot the following V-I graphs (a) and (b).
Which of the graphs is (are) correctly labelled in terms of the words 'series' and 'parallel'? Justify your answer.
 View Solution
A V-I graph for a nichrome wire is given below. What do you infer from this graph? Draw a labelled circuit diagram to obtain such a graph.
 View Solution
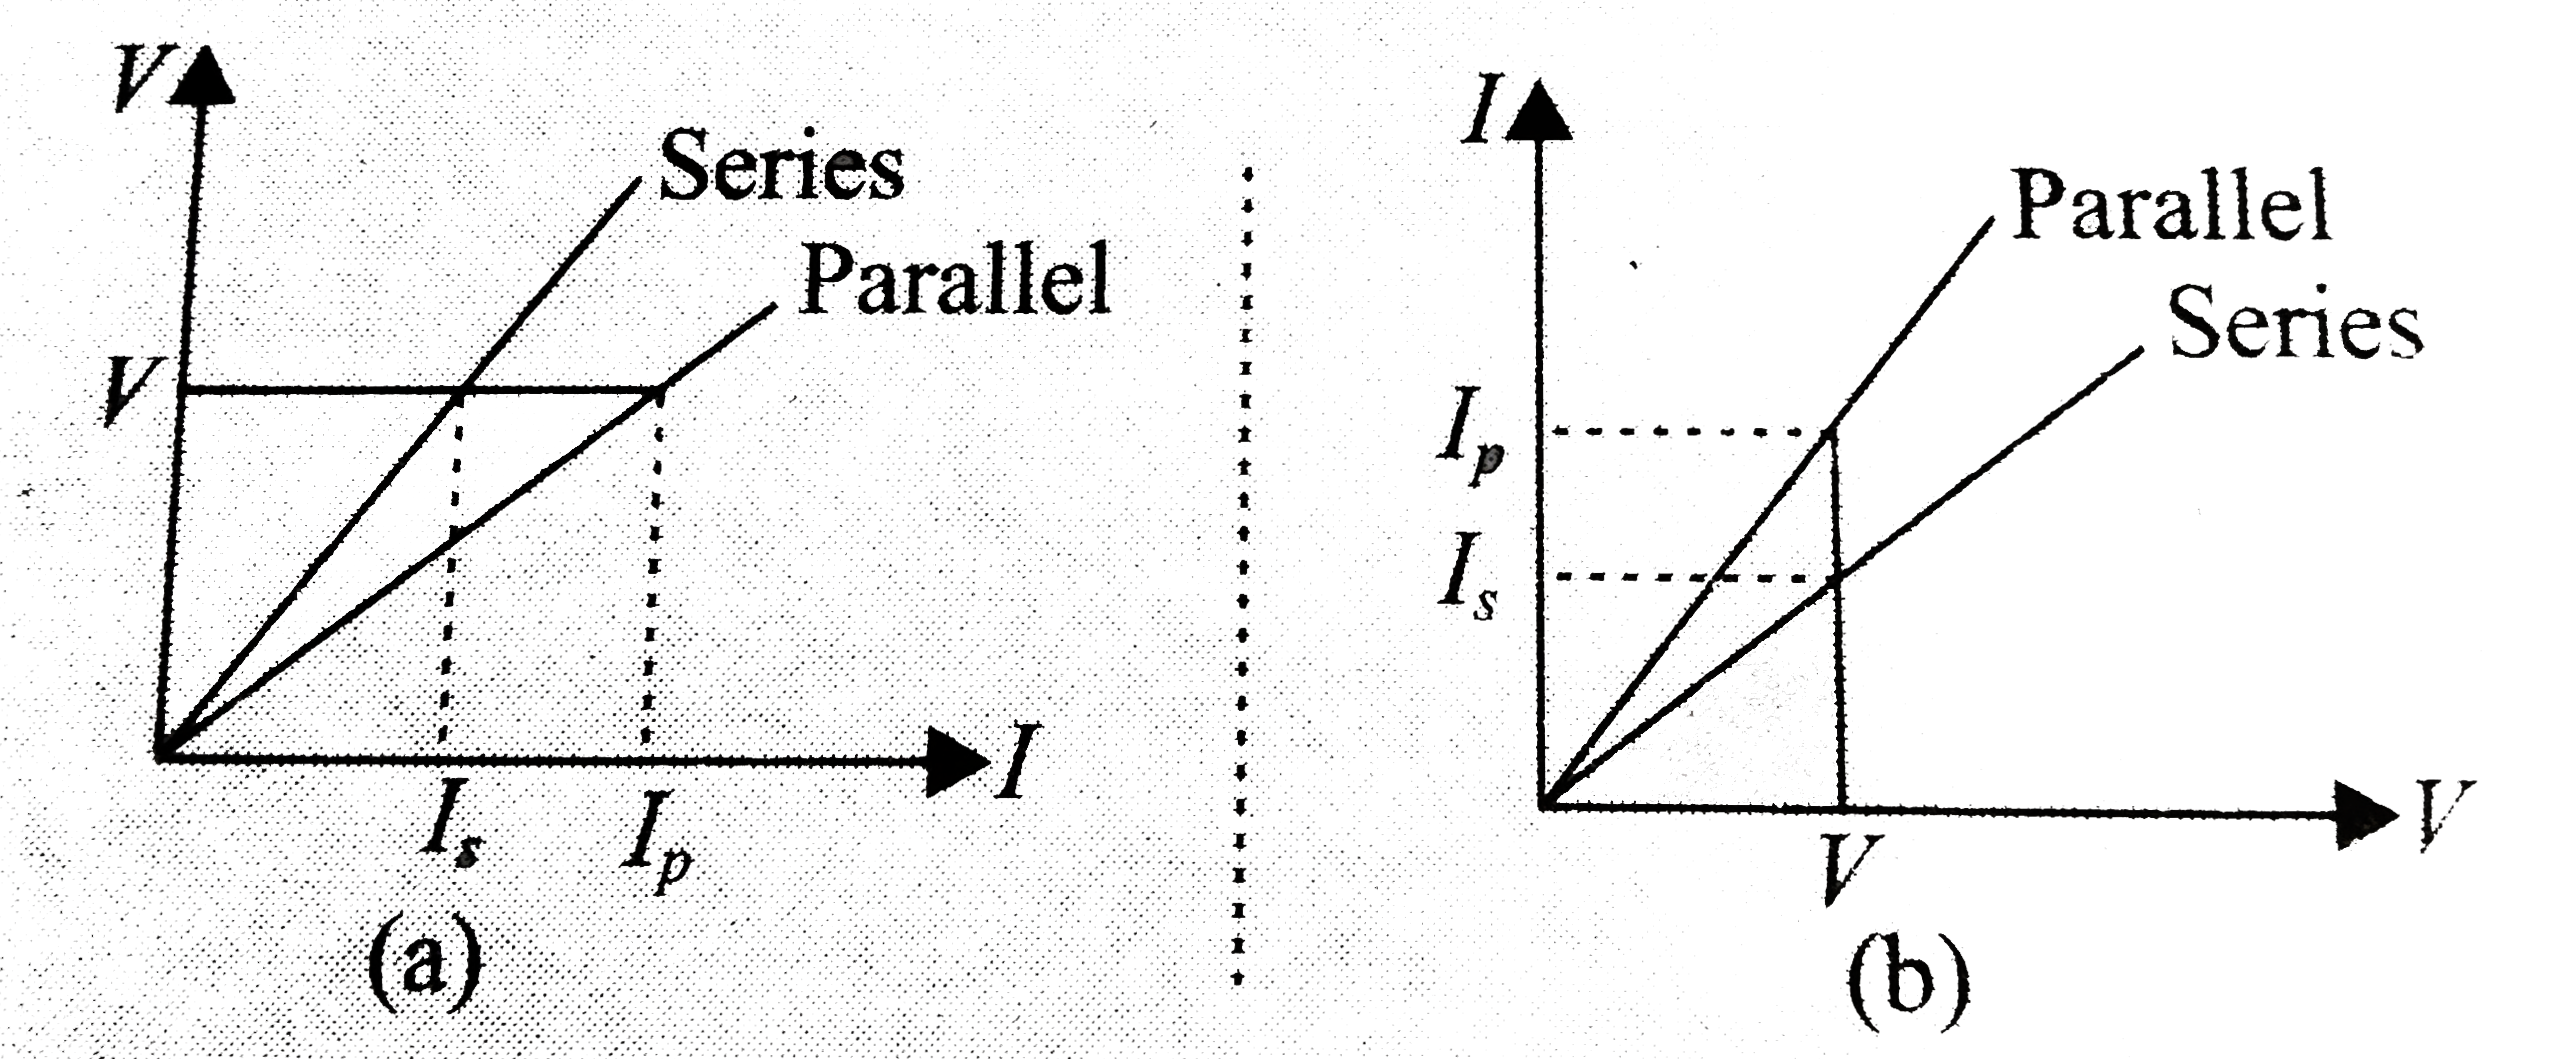
Two students perform experiments on series and parallel combinations of two given resistors R1andR2 and plot the following V -1 graphs [Fig. 5.24.]. Which of the graphs is/are correctly labeled in terms of the words 'series' and 'parallel'? Justify your answer.
 View Solution
Two ideal batteries of emf V1andV2 and three resistances R1,R2andR3 are connected as shown in the figure. The current in resistance R2 would be zero if
 View Solution

