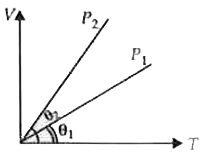
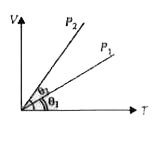
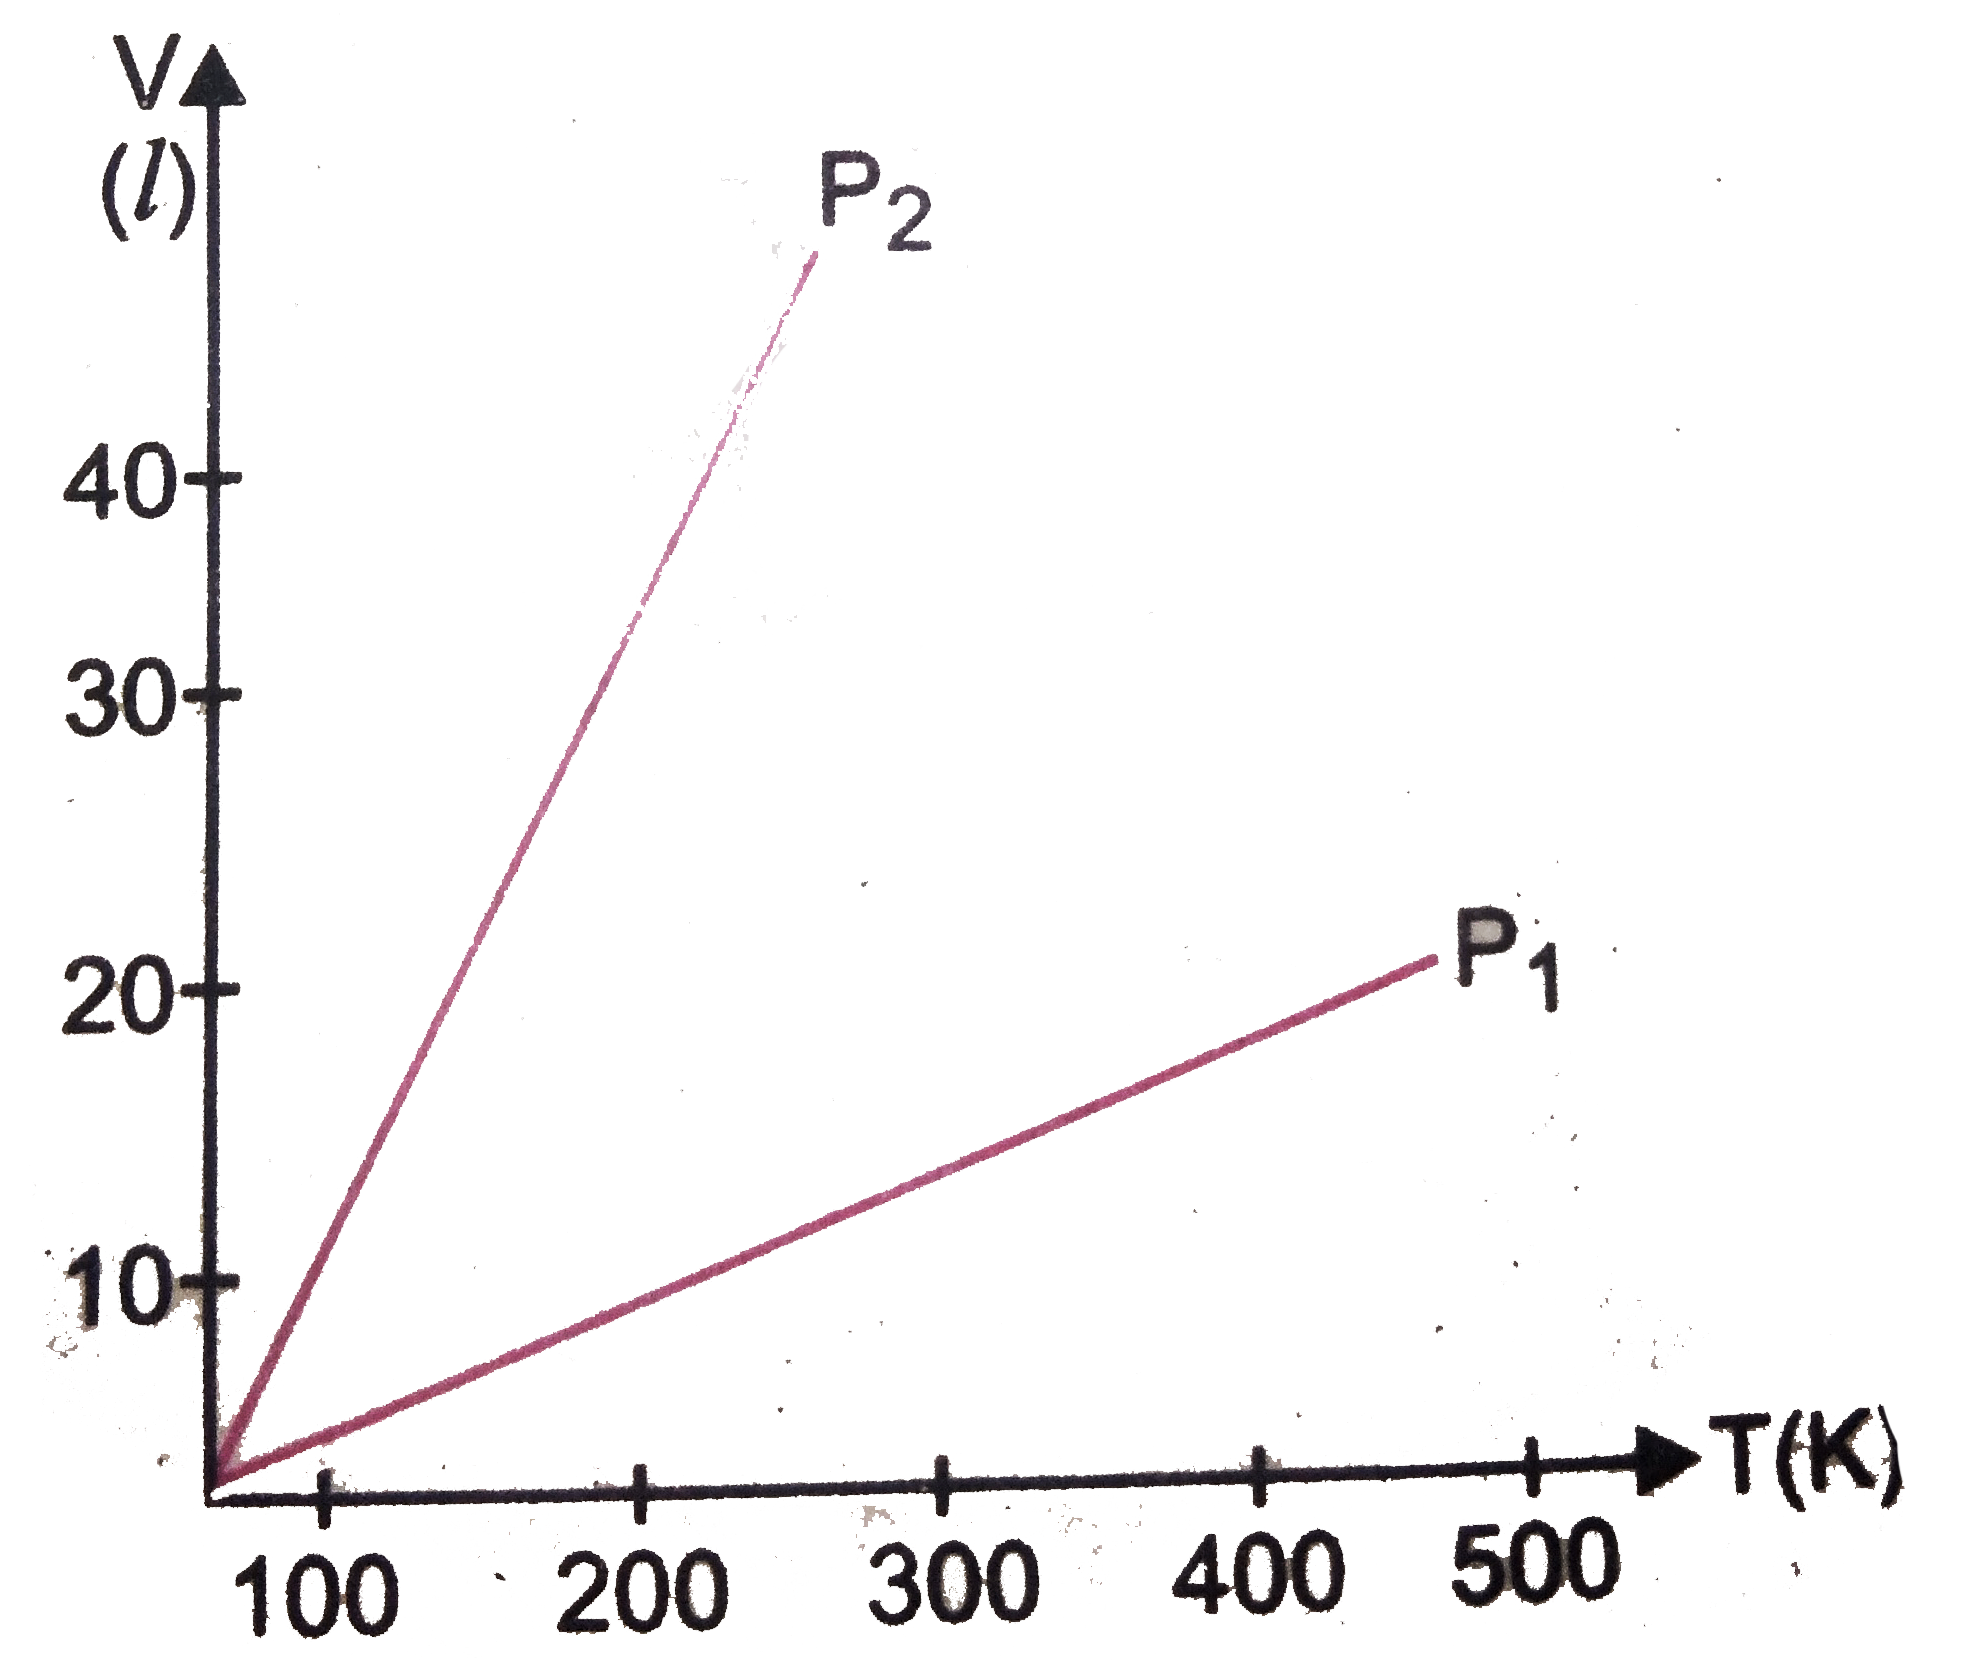
In the given (V-T) diagram, what is the relation between pressures and ?
A
B
Cannot be predicted
C
D
Text Solution
The correct Answer is:A
According to ideal gas equation
PV = nRT or
For an isobaric process, P = constant and
Therefore, V - T graph is a straight line passing through origin. Slope of this line is inversely proportional to P. In the given figure,
|
Topper's Solved these Questions
- THERMODYNAMICSBOOK - MTG GUIDECHAPTER - THERMODYNAMICSEXERCISE - NEET (ITALS)
25 Videos
- PROPERTIES OF BULK MATTERBOOK - MTG GUIDECHAPTER - PROPERTIES OF BULK MATTEREXERCISE - AIPMT/NEET (MCQs)
40 Videos
- WORK, ENERGY AND POWERBOOK - MTG GUIDECHAPTER - WORK, ENERGY AND POWEREXERCISE - AIPMT/NEET (MCQs)
34 Videos
Similar Questions
Knowledge Check
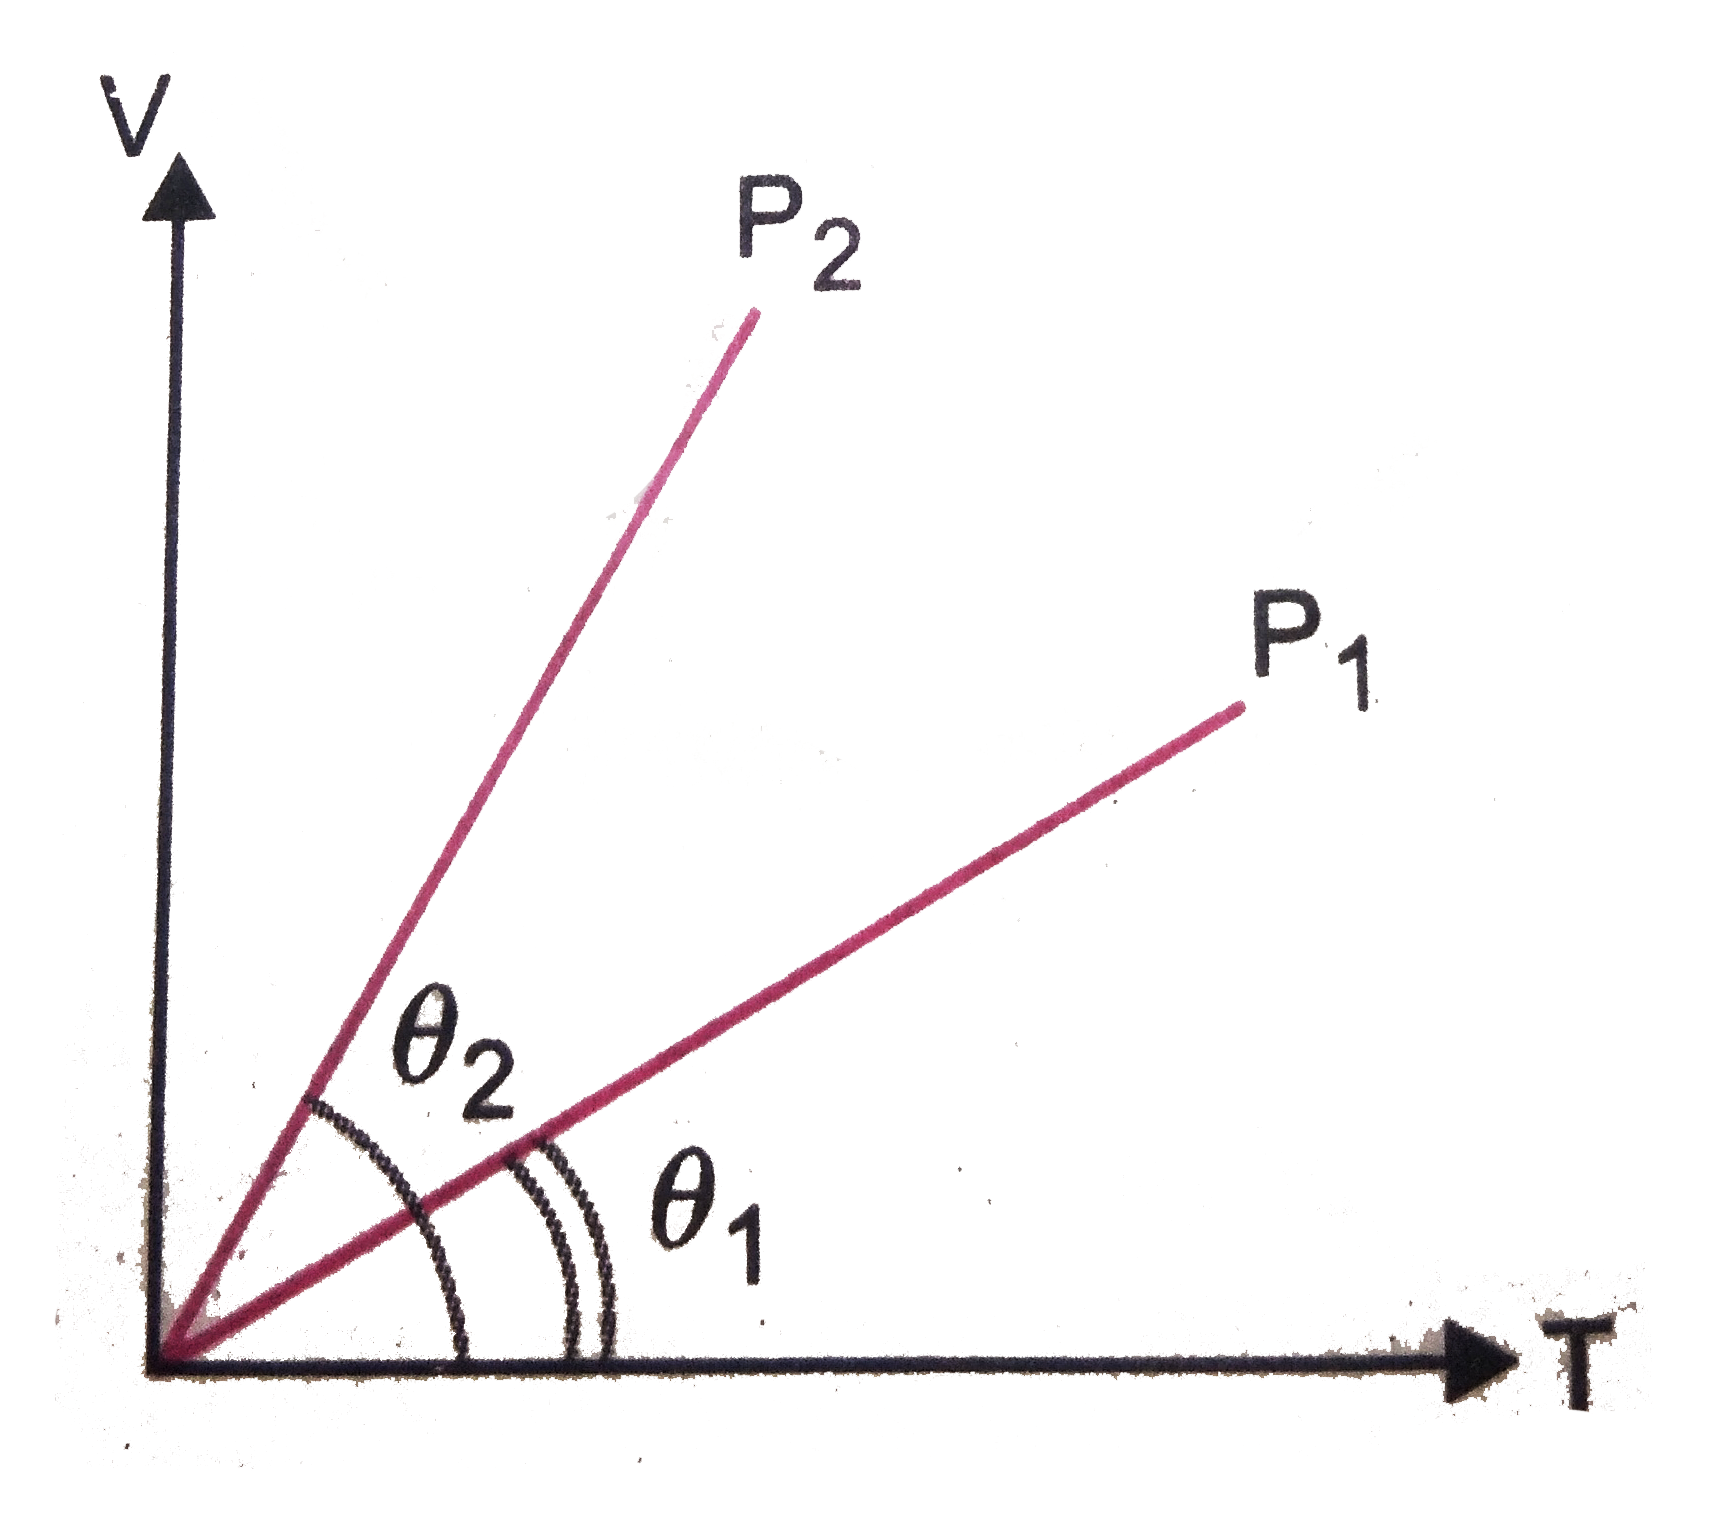
In the given (V-T) diagram, what is the relation between pressure P1andP2 ?
 ACannot be predictedBP2=P1CP2>P1DP2<P1
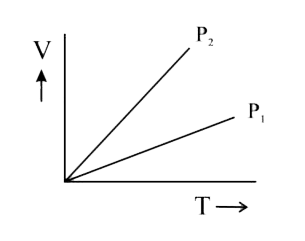
In V-T diagram shown in fig., what is the relation between P1andP2 ?
 AP2andP1BP2>P1CP1>P2DCannot say
In the following V - T diagram what is the relations between P1andP2 :
 AP2=P1BP2>P1CP2<P1DCan not be predicted
In the given (V-T) diagram, what is the relation between pressure P1andP2 ?

View SolutionIn the given pressure-temperature (P−T) diagram, what is the relation between volumes V1 and V2 for a fixed mass of a gas?
View SolutionIn the P - V diagram, the point B and C correspond to temperatures T1andT2 respectively. State relationship between T1andT2.
View SolutionIn Adiabatic process, relation between volume (V) and pressure (P) is
View SolutionVolume versus temperature graphs for a given mass of an ideal gas are shown in Fig. at two different values of constant pressure. What can be inferred about relation between P1andP2?
View Solution
