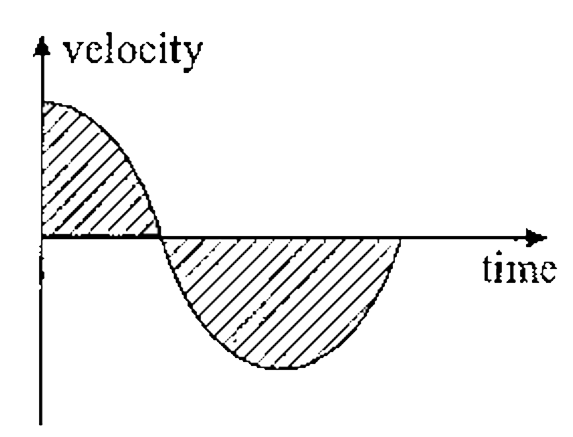
The area under velocity-time graph for a particle in a given interval of time represnets
A
velocity
B
acceleration
C
work done
D
displacement
Video Solution
Text Solution
The correct Answer is:D
Area under velocity-time graph respresents displacement of a particle in given interval of time.
|
Updated on:21/07/2023
Topper's Solved these Questions
- BOOK - MTG GUIDECHAPTER - KINEMATICS EXERCISE - Topicwise Practice Questions (ACCELERATION)12videos
KINEMATICS
- BOOK - MTG GUIDECHAPTER - KINEMATICS EXERCISE - Topicwise Practice Questions (GRAPHICAL STUDY OF MOTION)16videos
KINEMATICS
- BOOK - MTG GUIDECHAPTER - KINEMATICS EXERCISE - Topicwise Practice Questions (DISTANCE AND DISPLACEMENT)2videos
KINEMATICS
- BOOK - MTG GUIDECHAPTER - GRAVITATIONEXERCISE - AIPMT/NEET MCQS32videos
GRAVITATION
- BOOK - MTG GUIDECHAPTER - LAWS OF MOTIONEXERCISE - AIPMT /NEET (MCQ)24videos
LAWS OF MOTION
Similar Questions
Knowledge Check
- Question 1 - Select One
The area under a velocity-time graph gives :
ADisplacementBChange in velocityCAccelerationDSpeed - Question 2 - Select One
Area under a velocity-time graph gives
Athe time taken by a moving objectBthe distance travelled by a moving objectCthe acceleration of moving objectDthe retardation of a moving object - Question 3 - Select One
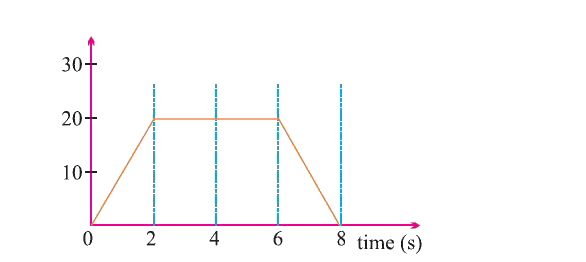
The velocity − time graph of a particle is as shown in figure
 AIt moves with a constant acceleration throughoutBIt moves with an acceleration of constant magnitude but changing direction at the end of every two secondCThe displacement of the particle is zeroDThe velocity becomes zero at t=4 second
2.The velocity-time (v-t) graph for a particle in straight line motion is given below the corresponding acceleration time graph will be?
View SolutionThe area under acceleration-time graph gives
View SolutionThe diagram shows the velocity-time graph for a particle moving in a straight line. The sum of the two shaded areas represents :
 View Solution
The velocity-time graph of a particle is not a straight line. Its acceleration is
View SolutionThe area under acceleration - time graph represents the
View Solution


