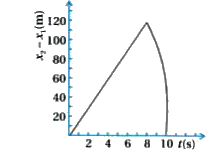
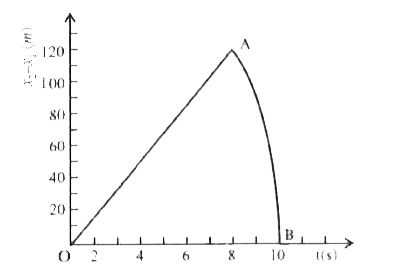
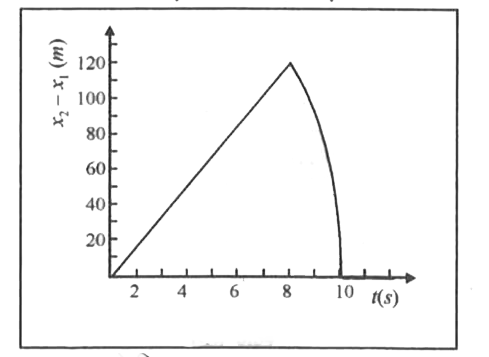
Two stones are thrown up simultaneously from the edge of a cliff 200 m high with initial speeds of 15 ms−and 30 ms−1. Verify that the graph shown in figure. Correctly represents the time variation of the relative position of the second stone with respect to the first. Neglect air resistance and assume that the stones do not rebound after hitting the ground. Take g = 10 ms−2. Give the equations for the linear and curved parts of the plot.
 Solution in Gujrati
x0=200m,u=15ms−1,a=−10ms−2andx=x1
∴ From equation of motion.
x=x0+ut+12at2
∴x1=200+15t+12×(−10)t2
∴x1=200+15t−5t2 ...(1)
When first stone strikes the ground, x1=0
∴0=40+3t−t2
∴t2−3t−4=0
∴(t−8)(t+5)=0
∴t=8sort=−5s
But t=−5 not possible.
∴t=8s
For second stone,
x0=200m,u=300ms−1,a=−10ms−2andx=x2
∴x2=200+30t+12×(−10)t2
∴x2=200+30t−5t2 ..(2)
When second stone strikes the ground, x2=0
∴0=200+30t−5t2
∴5t2−30t−200=0
∴t2−6t−40=0
∴(t−10)(t+4)=0
∴t=10sandt=−4s
But t=−4s not possible.
∴t=10s
By substracting equation (1) From (2),
x2−x1=200+30t−5t2−200−15t+5t2
∴x2−x1=15t (Linear part) ...(3)
Relative velocity of stone,
u21=u2−u1
=30−15
∴u21=15ms−1
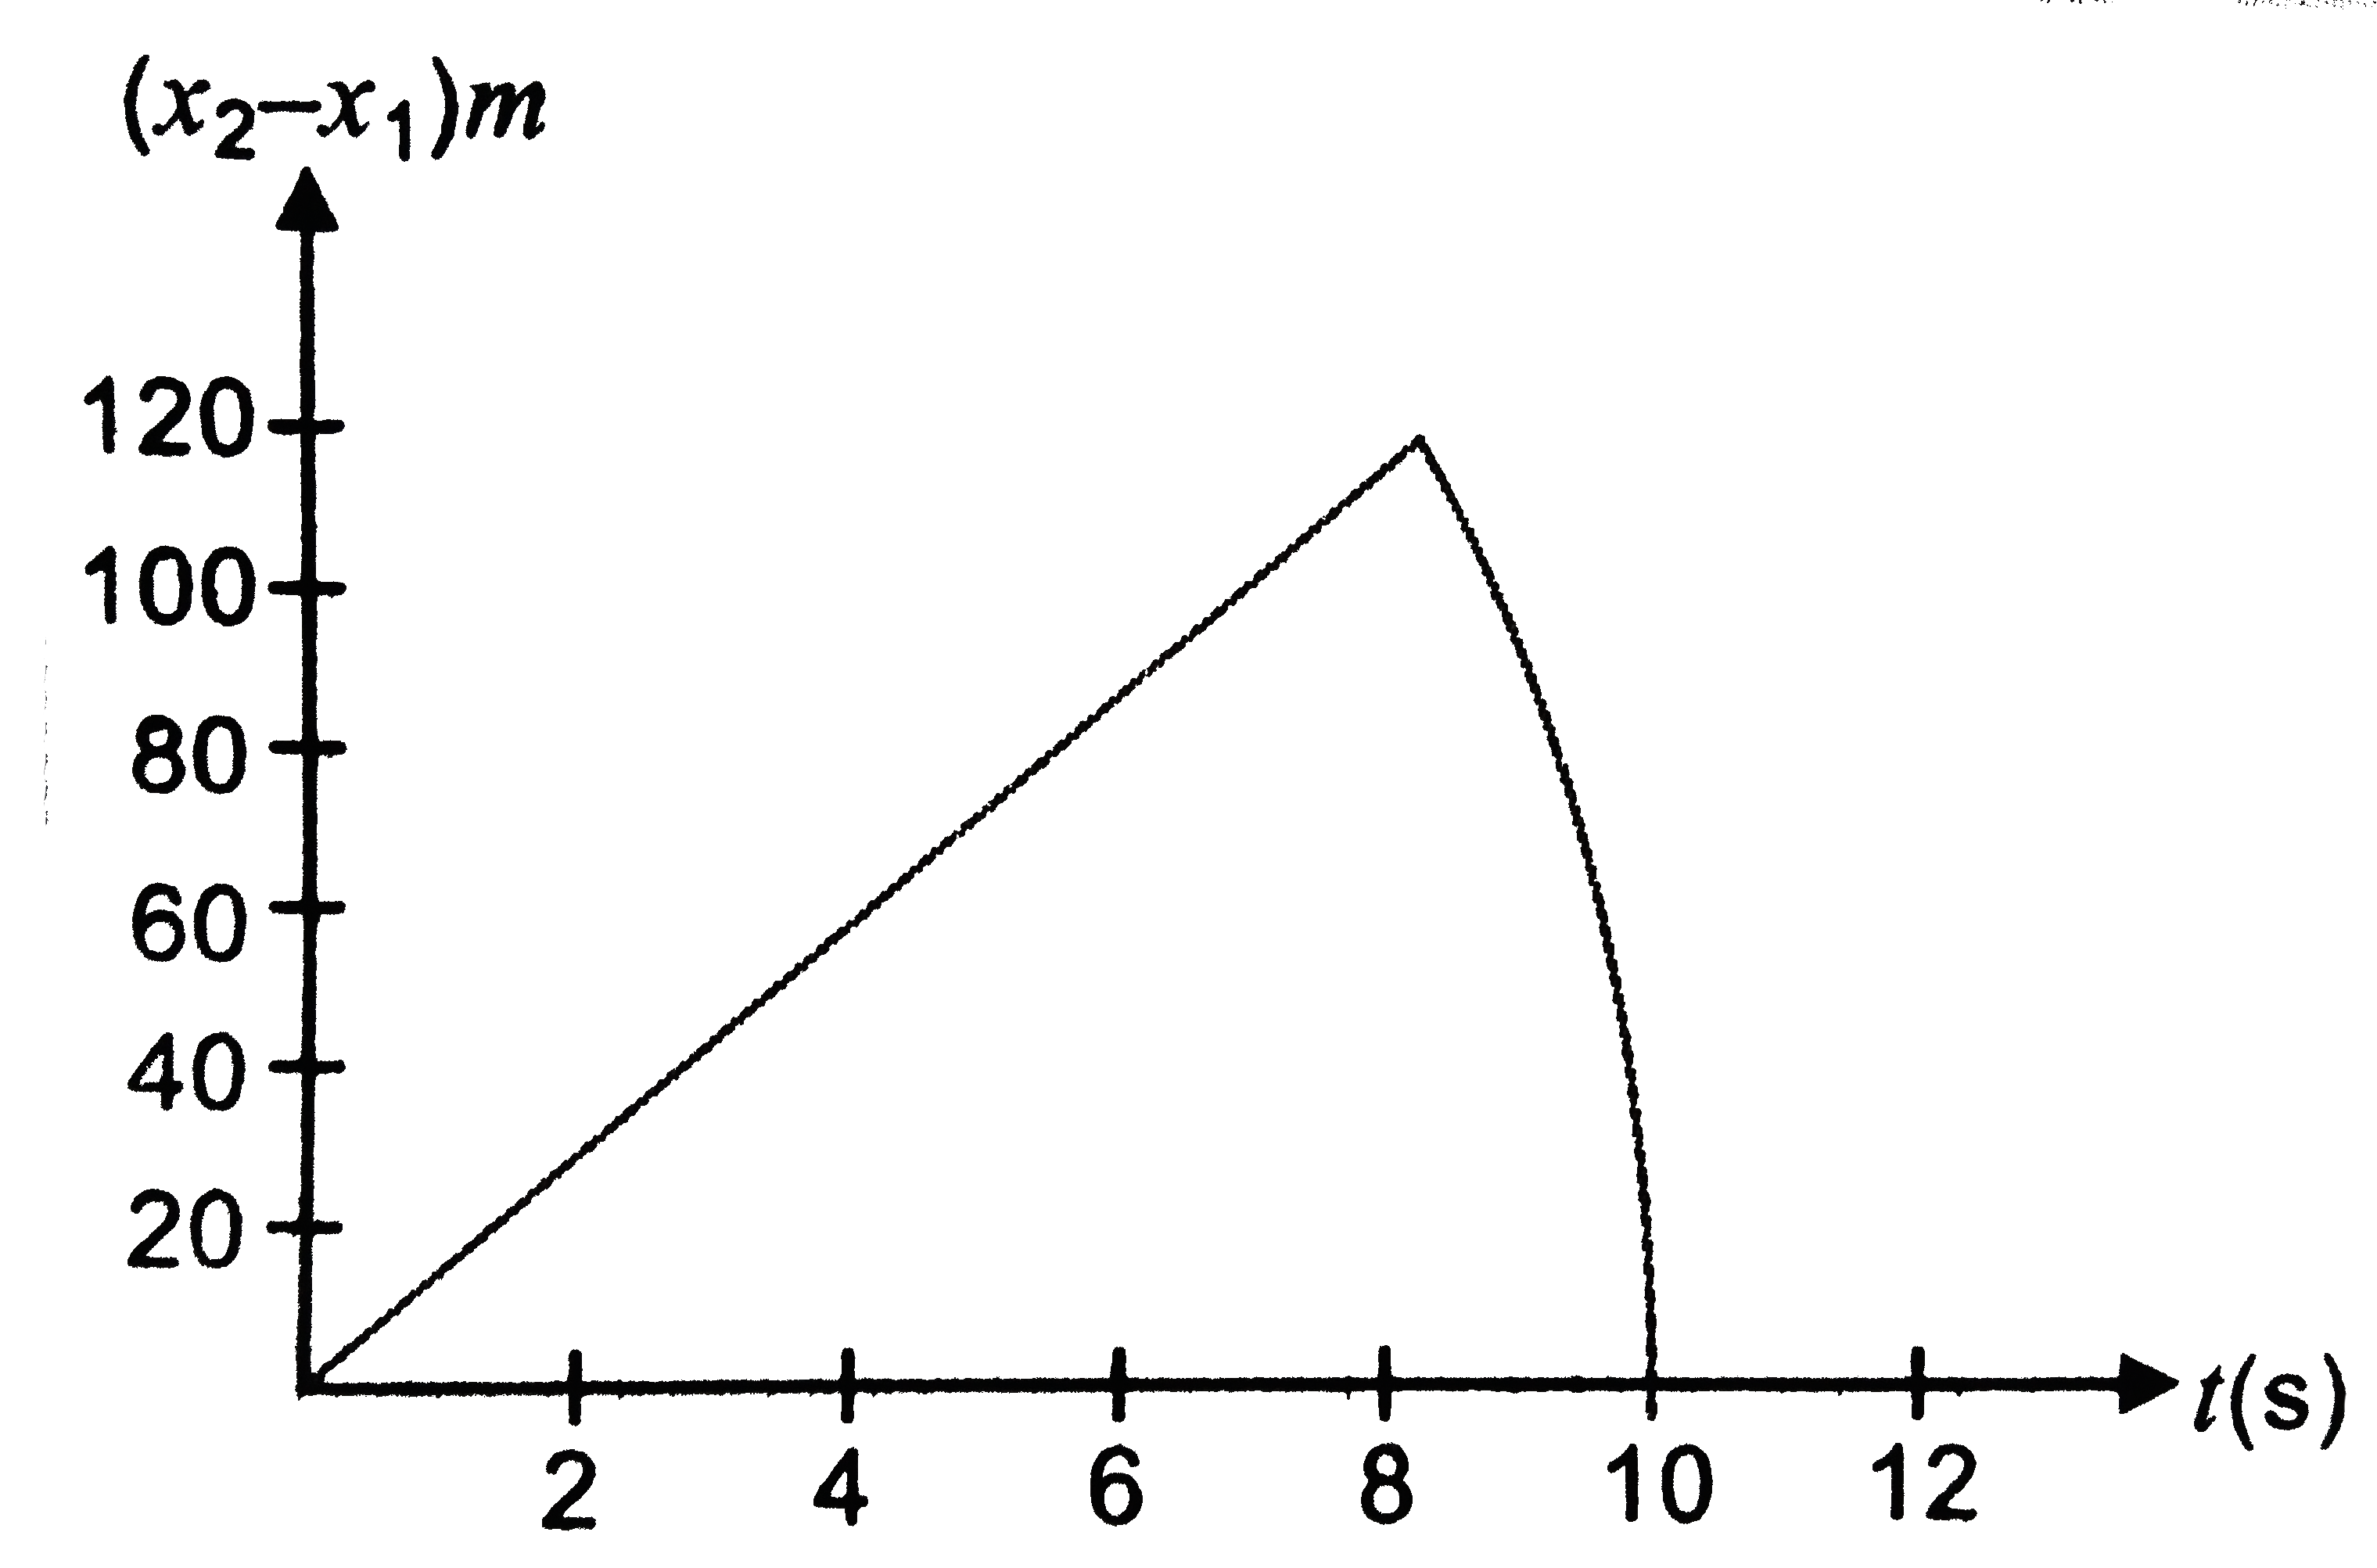
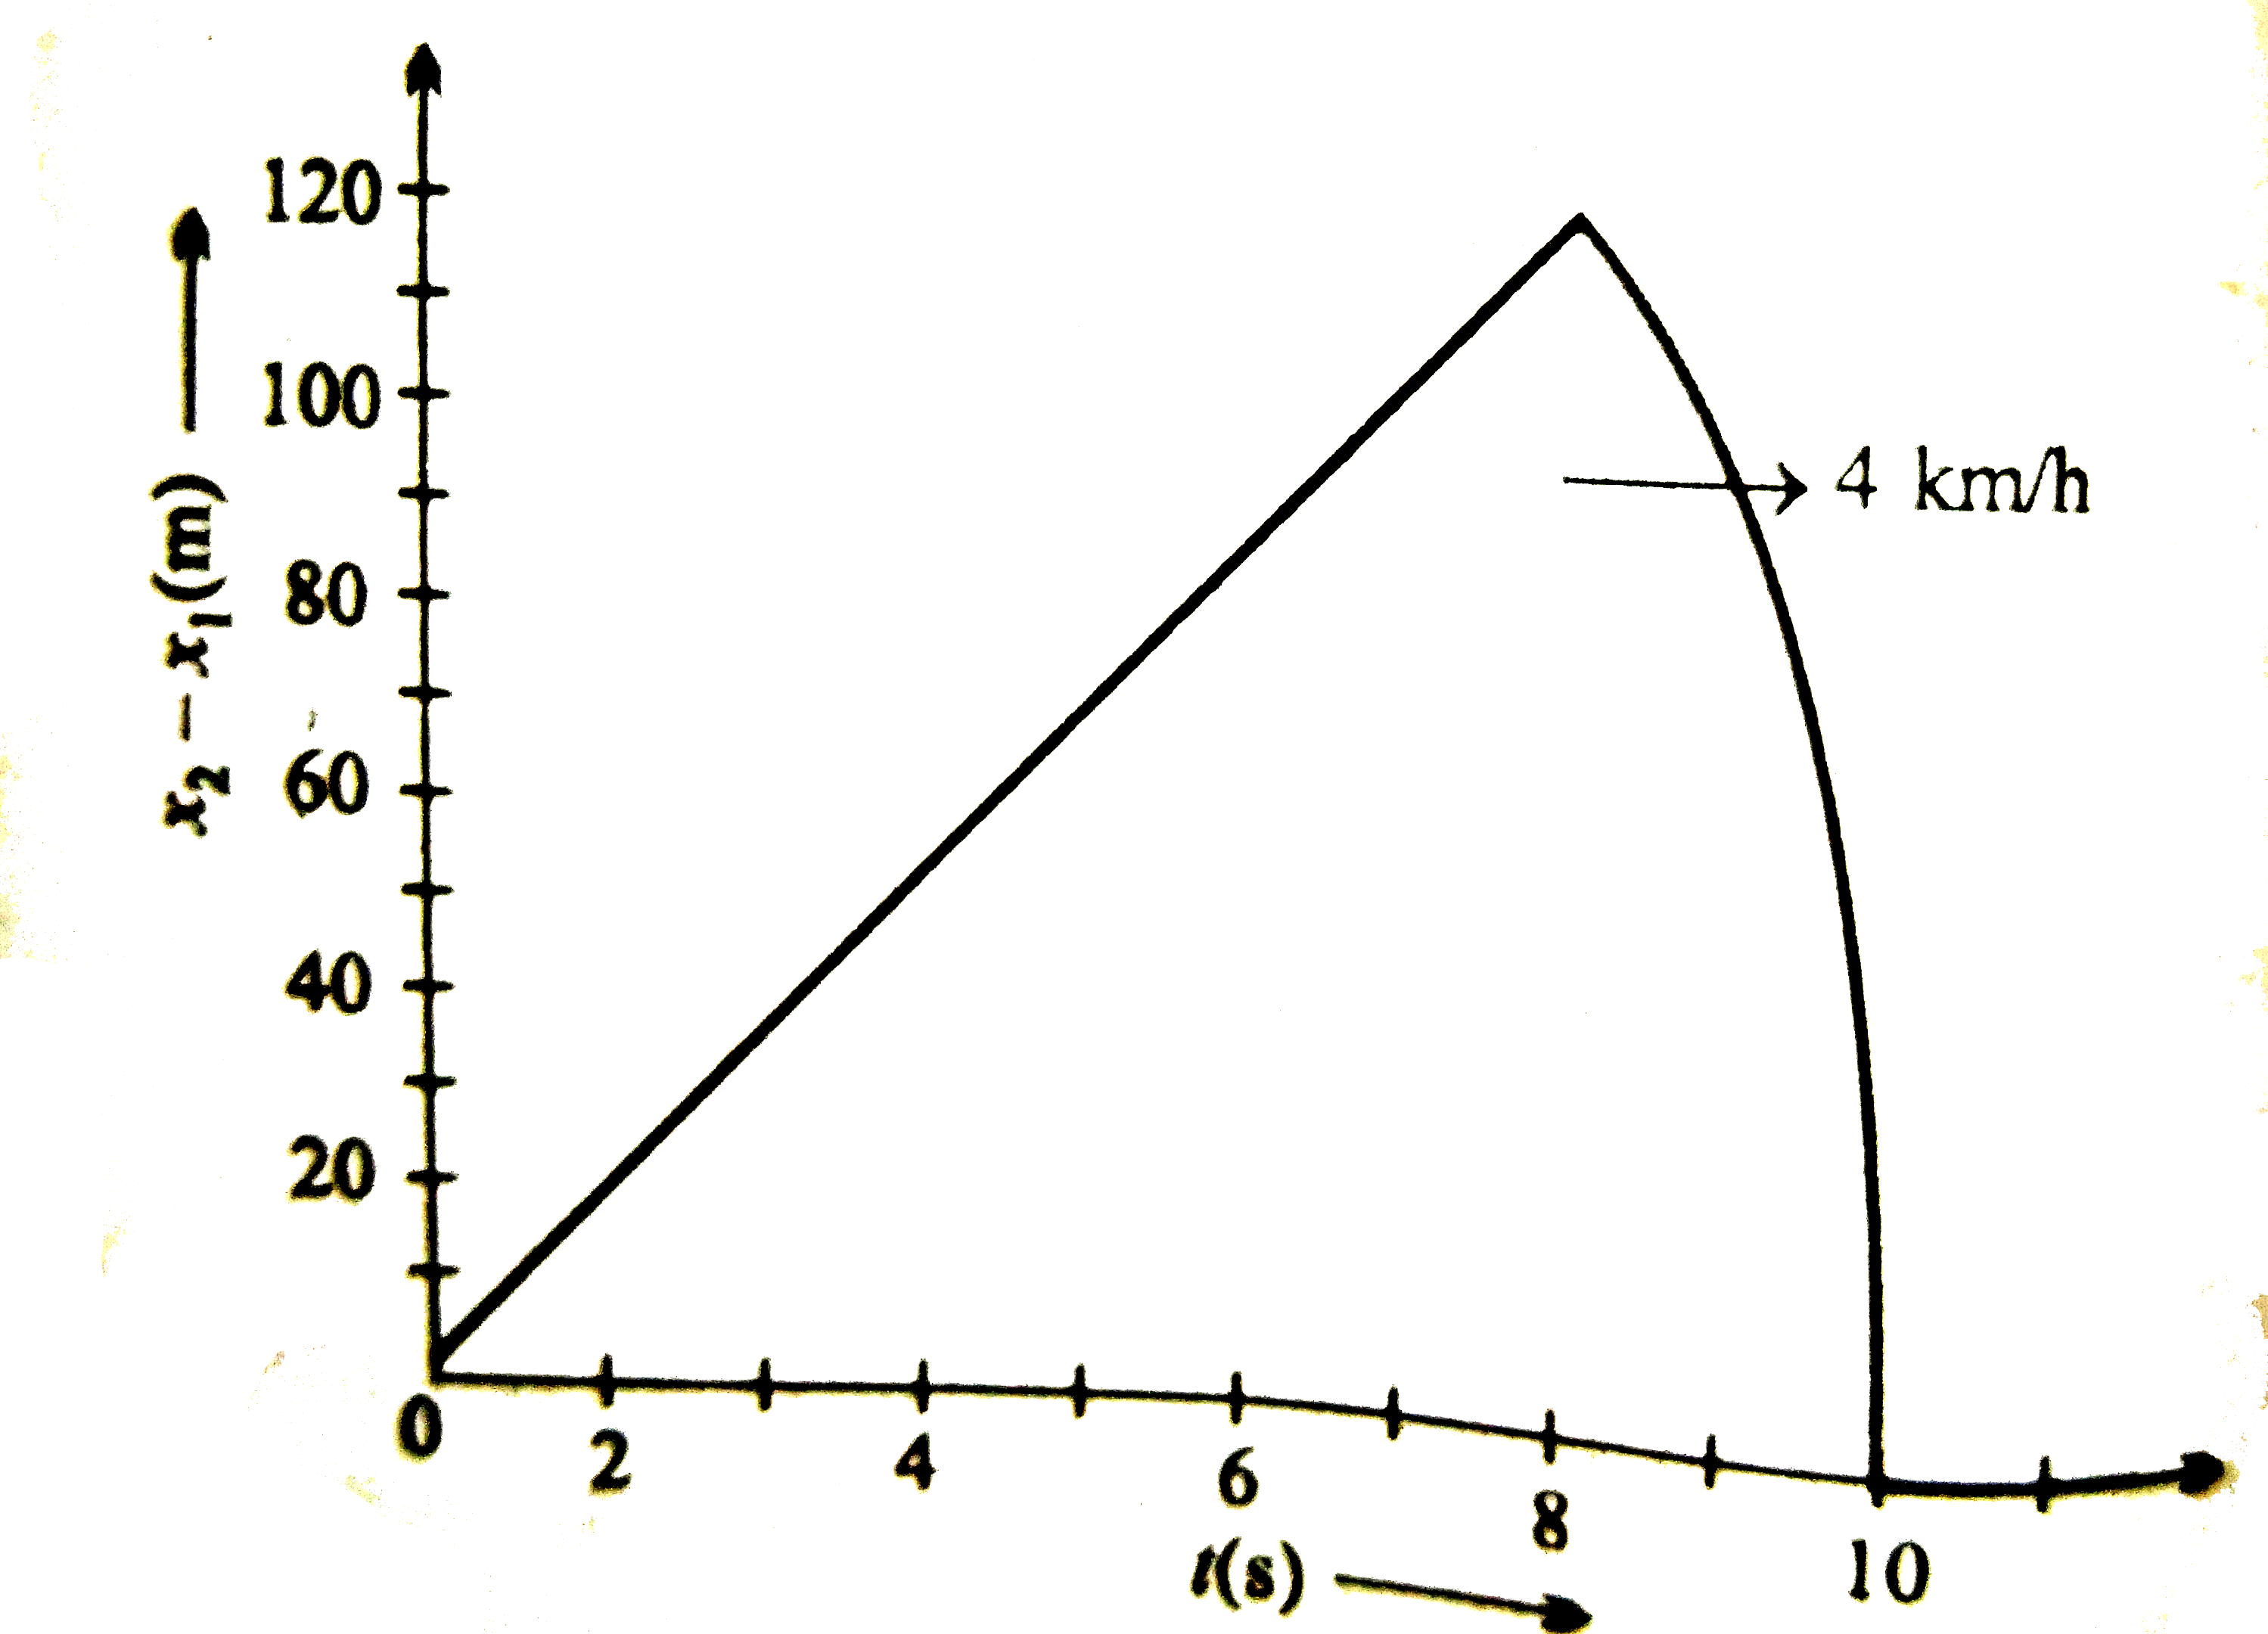
Equation (3) is equation of a line. Hence graph of (x2−x1) + t will be linear upto OA.
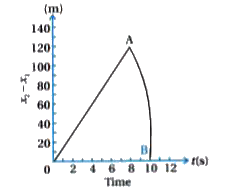
After 8s, first stone will be on ground and only second stone will be in motion.
∴ Maximum distance of both stones after 8 s,
(x2−x1)=15t
=15×8=120m
And after 8 s, second store will strike the ground by performing hyperbolic motion,
∴AB path will be hyperbolic,
x2−x1=x0+u21t+12at2
=200+15t+12×(−10)t2=200+15t−5t2
Hence, the above equation is for AB part of graph (curved part).
Topper's Solved these Questions
- BOOK - KUMAR PRAKASHANCHAPTER - MOTION IN A STRAIGHT LINE EXERCISE - SECTION-C43videos
MOTION IN A STRAIGHT LINE
- BOOK - KUMAR PRAKASHANCHAPTER - MOTION IN A STRAIGHT LINE EXERCISE - SECTION-D26videos
MOTION IN A STRAIGHT LINE
- BOOK - KUMAR PRAKASHANCHAPTER - MOTION IN A STRAIGHT LINE EXERCISE - SECTION-A TRY YOUR SELF (VSQs)52videos
MOTION IN A STRAIGHT LINE
- BOOK - KUMAR PRAKASHANCHAPTER - MECHANICAL PROPERTIES OF FLUIDS EXERCISE - QUESTION PAPER (SECTION -C)3videos
MECHANICAL PROPERTIES OF FLUIDS
- BOOK - KUMAR PRAKASHANCHAPTER - OBJECTIVE QUESTIONS AS PER NEW PAPER STYLE EXERCISE - CHAPTER - 8 (Match Type questions)5videos
OBJECTIVE QUESTIONS AS PER NEW PAPER STYLE
Similar Questions
What is acceleration ? What is the direction ? Also gives its unit.
09:42View SolutionAmong the four graph shown in the figure there is only one graph for which average velocity over the time interval (O,T) can vanish for a suitably chosen T. Which one is it ?
09:37View SolutionHow can we determine whether the object is in rest or not?
08:23View SolutionGlycerine flows steadily through a horizontal tube of length 1.5m and radius 1.0 cm . If the amount of glycerine collected per second at one is 4.0×10⁻³kgs−1 , what is the pressure difference between the two ends of the tube ? (Density of glycerine =1.3×10103kgm−3 and viscosity of glycerine =0.83 Pa s). [ you may also like to check if the assumption of laminar flow in the tube is correct]
08:23View SolutionType of satellites are given in Column-I and their uses are given in Column-II. Match them properly :
Column-IColumn-II(1) Polar satellite(a) Tele communication(2) Geo-stationary satellite(b) Investigation(c) For information about atmosphere11:02View SolutionTwo stones are thrown up simultaneously from the edge of a cliff 240 m high with initial speed of 10 m//s and 40 m//s respectively . Which of the following graph best represents the time variation of relative position of the speed stone with respect to the first ? ( Assume stones do not rebound after hitting the groumd and neglect air resistance , take g = 10 m//s^(2)) ( The figure are schematic and not drawn to scale )
View SolutionTwo stones are thrown up simultaneously from the edge of a cliff 200m high with initial speeds of 15ms?−1 and 30−1. Verify that the graph shown in Fig. 2 ( NCT). 13 , correctly represents the time variation of the relativ e position of the second stone with respect to the first. Neglect the air resistance and assume that the stones do not rebound after hitting the ground. Taje g=10ms−2.Give equations for the linear and curved parts of the plot.
 .View Solution
Two stones are through up simultaneously from the edge of a cliff 240 m high with initial speed of 10 m/s and 40 m/s respectively. Which of the following graphs best represents the time variation of relative position of the second stone with respect to the first? Assume stones do not rebound after hitting the ground and neglect air resistance, take . g=10m/s2 (The figures are schematic and not drawn to scale)
View SolutionTwo stones are through up simultaneously from the edge of a cliff 240 m high with initial speed of 10 m/s and 40 m/s respectively. Which of the following graphs best represents the time variation of relative position of the second stone with respect to the first? Assume stones do not rebound after hitting the ground and neglect air resistance, take . g= 10 m//s^(2) (The figures are schematic and not drawn to scale)
View Solutionकिसी 200 m ऊँची खड़ी चट्टान के किनारे से दो पत्थरों को एक साथ ऊपर की ओर 15ms−1 तथा 30ms−1 की प्रारंभिक चाल से फेंका जाता है । इसका सत्यापन कीजिए कि नीचे दिखाया गया ग्राफ ( चित्र ) पहले पत्थर के सापेक्ष दूसरे पत्थर की आपेक्षिक स्थिति का समय के साथ परिवर्तन को प्रदर्शित करता है । वायु के प्रतिरोध को नगण्य मानिए और यह मानिए कि जमीन से टकराने के बाद पत्थर ऊपर की ओर उछाले नहीं । मान लीजिए g=10ms−2| ग्राफ के रेखीय व वक्रीय भागों के लिए । समीकरण लिखिए ।
 06:14View Solution
किसी 200 m ऊँची खड़ी चट्टान के किनारे से दो पत्थरों को एक साथ ऊपर की ओर 15 ms−1 तथा 30 ms−1 की प्रारम्भिक चाल से फेंका जाता है | इसका सत्यापन कीजिए कि सामने दिखाया गया ग्राफ ( चित्र) पहले पत्थर के सापेक्ष दूसरे पत्थर की आपेक्षिक स्थिति का समय के साथ परिवर्तन को प्रदर्शित करता है | वायु के प्रतिरोध को नगण्य मानिए और यह मानिए कि जमीन से टकराने के बाद पत्थर ऊपर की ओर उछलते नहीं | मान लीजिए g=10ms−2 | ग्राफ के रेखीय व वक्रीय भागों के लिए समीकरण लिखिए |
 View Solution
Two stones are thrown up simultaneously from the edge of a cliff 240 m high with initial speeds of 10 m/s and 40 m/s respectively. Which of the following graphs best represents the time variation of relative position of the second stone with respect to the first?
(Assume stones do not rebound after hitting the ground and neglect air resistance take g = 10 m/s2 ) The figures are schematic and not drawn to scale)05:34View SolutionTwo stones are thrown up simultaneously from the edge of a cliff 240 m high with initial speed of 10 m/s and 40 m/s respectively. Which of the following graph best represents the time variation of relative position of the second stone with respect to the first ?
(Assume stones do not rebound after hitting the ground and neglect air resistance, take g = 10 m/s2 ). (The figures are schematic and not drawn to scale)View Solutionकिसी 200 m ऊँची खड़ी चट्टान के किनारे से दो पत्थरों को एक साथ ऊपर की ओर 15ms−1 तथा 30ms−1 की प्रारंभिक चाल से फेंका जाता है। इसका सत्यापन कीजिए कि नीचे दिखाया गया ग्राफ (चित्र) पहले पत्थर के सापेक्ष दूसरे पत्थर की आपेक्षिक स्थिति का समय के साथ परिवर्तन को प्रदर्शित करता है। वायु के प्रतिरोध को नगण्य मानिए और यह मानिए कि जमीन से टकराने के बाद पत्थर ऊपर की ओर उछलते नहीं है। मान लीजिए g=10ms−2 | ग्राफ के रेखीय व वक्रीय भागों के लिए समीकरण लिखिए।
 View Solution
Two stones are thrown up simultaneously from the edge of a cliff 200 m high with initial speeds of 15 ms^(-1) and 30 ms^(-1) . Verify that the graph shown in Fig. correctly represents the time variation of the relative position of the second stone with respect to the first. Neglect air resistance and assume that the stones do not rebound after hitting the ground. Take g = 10 ms^(-2) . Give the equations for the linear and curved parts of the plot.
View Solution

