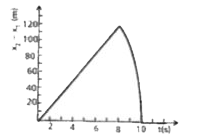
Two stones are thrown up simultaneously from the edge of a cliff 200 m high with initial speeds of 15 ms−1 and 30 ms−1. Verify that the graph shown in Fig. correctly represents the time variation of the relative position of the second stone with respect to the first. Neglect air resistance and assume that the stones do not rebound after hitting the ground. Take g = 10 ms−2. Give the equations for the linear and curved parts of the plot.
Time vertical upward motion of the first stone for time t, we have
x0=200m,u=15m/s,a=−10m/s2,t=t1,x=x1
As x=x0+ut+12at2
x1=200+15t+12(−10)t2
(Or)
x1=200+15t−5t2 ..... (i)
Taking vertical upward motion of the second stone for time t,
We have
x0=200m,u=30m/s−1,a=−10m/s−2,t=t1,x=x2
Then x2=200+30t−12×10t2
=200+30t−5t2
When the first stone hits the ground x1=0, So t2−3t−40=0
(Or) (t−8)(t+5)=0 ..... (ii)
∴ Either t = 8 S (Or) -5S
Since t = 0 corresponds to the instant, when the stone was projected. Hence negative time has no meaning in this case. 50 t = 8S. When the second stone hits the ground, x2=0.
0=200+30t−5t2 (Or) t2−6t−40=0 (Or)
(t−10)(t+4)=0
Therefore, either t = 10 s (Or) t = -4s
Since t = -4s
is meaningless, So t = 10s
Relative position of second stone w.r.to first is =x2−x1=15t ..... (ii)
From (i) and (ii)
Since (x2−x1)
and t are linearly related, therefore the graph is a straight line till t = 8s Fro maximum separation t = 8 S, so maximum separation =15×8=120m
After 8 seconds only second tone would be in motion for 2 seconds, so the graph is in accordance with the aquadratic equation x2=200+30t−5t2 for the interval of time 8 seconds to 10 seconds.
Similar Questions
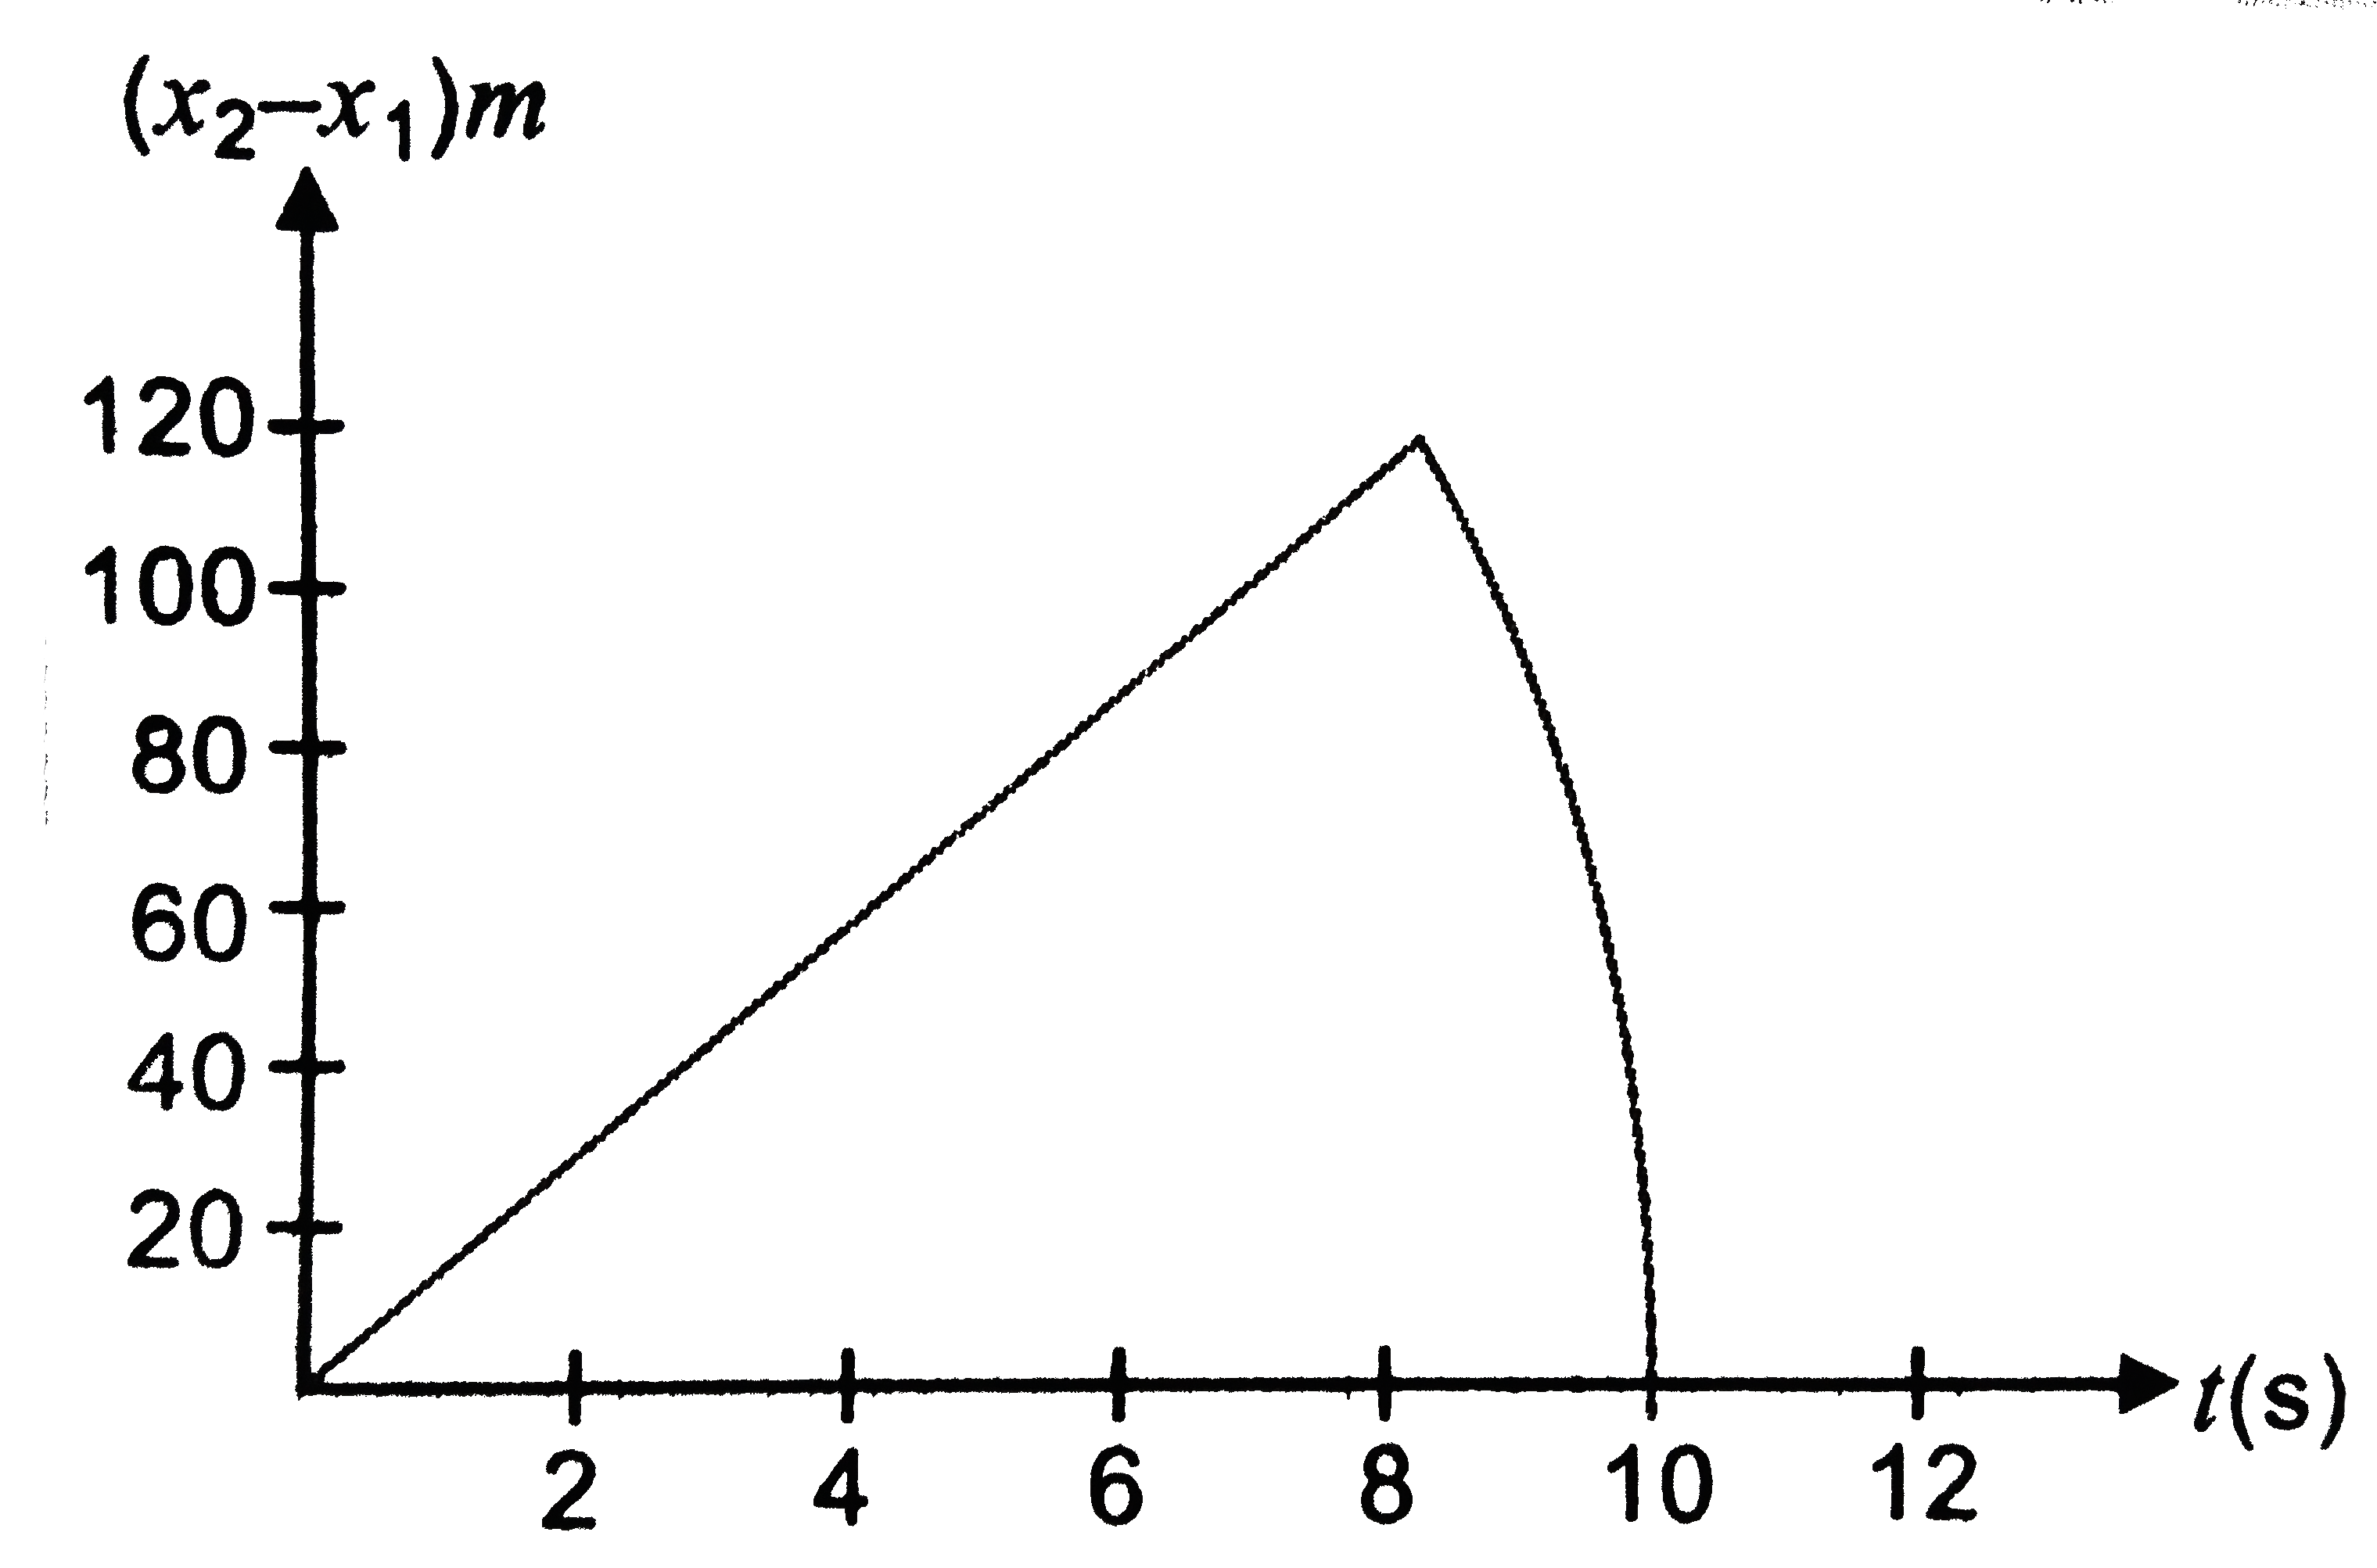
Two stones are thrown up simultaneously from the edge of a cliff 200m high with initial speeds of 15ms?−1 and 30−1. Verify that the graph shown in Fig. 2 ( NCT). 13 , correctly represents the time variation of the relativ e position of the second stone with respect to the first. Neglect the air resistance and assume that the stones do not rebound after hitting the ground. Taje g=10ms−2.Give equations for the linear and curved parts of the plot.
 .
.
View SolutionTwo stones are through up simultaneously from the edge of a cliff 240 m high with initial speed of 10 m/s and 40 m/s respectively. Which of the following graphs best represents the time variation of relative position of the second stone with respect to the first? Assume stones do not rebound after hitting the ground and neglect air resistance, take . g=10m/s2 (The figures are schematic and not drawn to scale)
View Solution
Knowledge Check
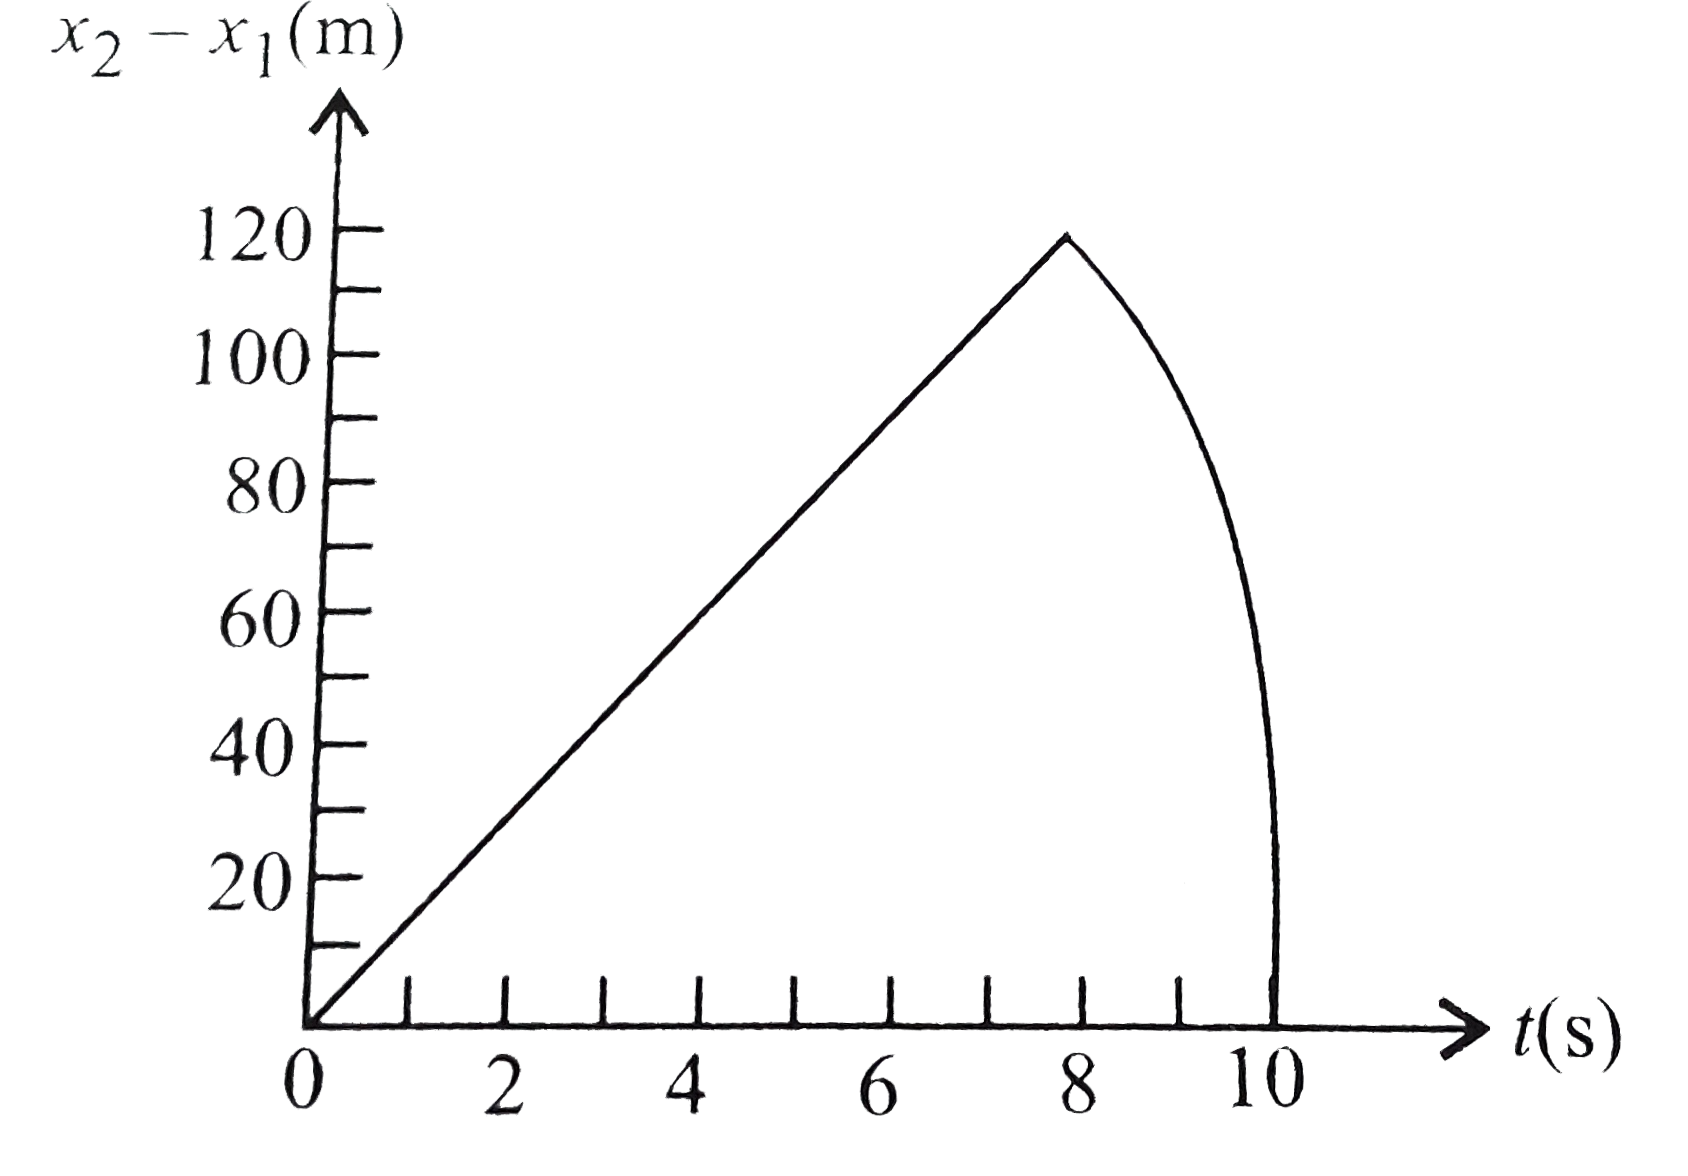
Two stones are thrown up simultaneously from the edge of a cliff 200 m high with initial speeds of 15ms−1 and 30ms−1 respectively. The time variation of the relative position of the second stone with respect to the first is shown in the figure. The equation of the linear part is
 Ax2−x1 = 50tBx2−x1 = 10tCx2−x1 = 15tDx2−x1 = 20t
Two stones are thrown up simultaneously from the edge of a cliff 200 m high with initial speeds of 15ms−1 and 30ms−1 respectively. The time variation of the relative position of the second stone will request to the first as shown in the figure. The equation of the linear part is
 Ax2−x1 = 50tBx2−x1 = 10tCx2−x1 = 15tDx2−x1 = 20t
Two stones are through up simultaneously from the edge of a cliff 240 m high with initial speed of 10 m/s and 40 m/s respectively. Which of the following graphs best represents the time variation of relative position of the second stone with respect to the first? Assume stones do not rebound after hitting the ground and neglect air resistance, take . g=10m/s2 (The figures are schematic and not drawn to scale)
A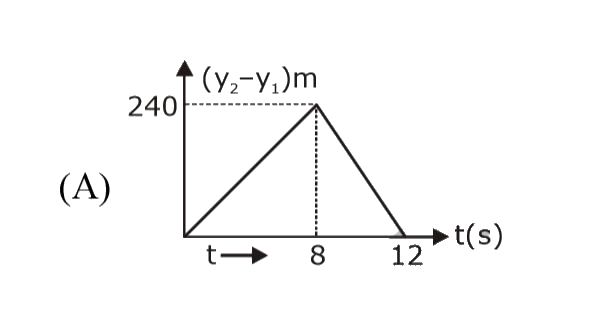 B
B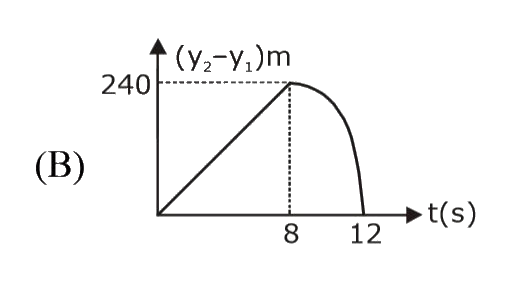 C
C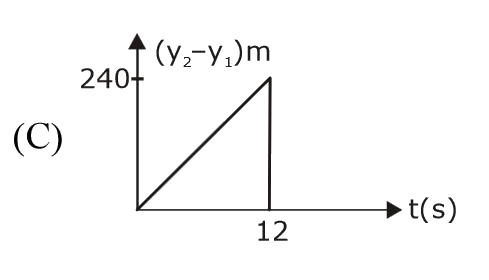 D
D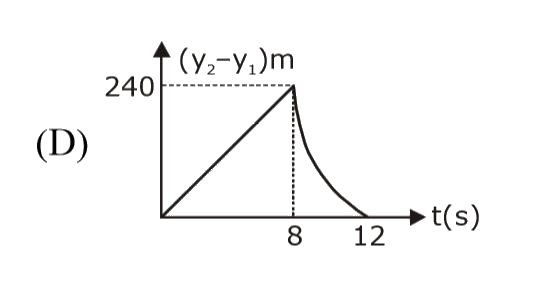
Two stones are thrown up simultaneously from the edge of a cliff with initial speed vand2v. The relative position of the second stone with respect to first varies with time till both the stones strike the ground as.
View SolutionTwo stones are through up simultaneously from the edge of a cliff 240 m high with initial speed of 10 m/s and 40 m/s respectively. Which of the following graphs best represents the time variation of relative position of the second stone with respect to the first? Assume stones do not rebound after hitting the ground and neglect air resistance, take . g=10m/s2 (The figures are schematic and not drawn to scale)
View SolutionTwo stones are thrown up simultaneously from the edge of a cliff 240m high with initial speed of 10m/sand40m/s respectively . Which of the following graph best represents the time variation of relative position of the speed stone with respect to the first ?
( Assume stones do not rebound after hitting the groumd and neglect air resistance , take g=10m/s2)
( The figure are schematic and not drawn to scale )
View SolutionTwo stones are thrown up simultaneously with initial speeds of u1 and u2(u2>1u1). They hit the ground after 6 s and 10 s respectively. Which graph in fig. correctly represents the time variation of Δx=(x2−x1) the relative position of the second stone with respect to the first upto t=10 s? Assume that the stones do not rebound after hitting the ground.
View SolutionTwo stones are thrown up simultaneously from the edge of a cliff with initial speed vand2v. The relative position of the second stone with respect to first varies with time till both the stones strike the ground as.
View Solution
