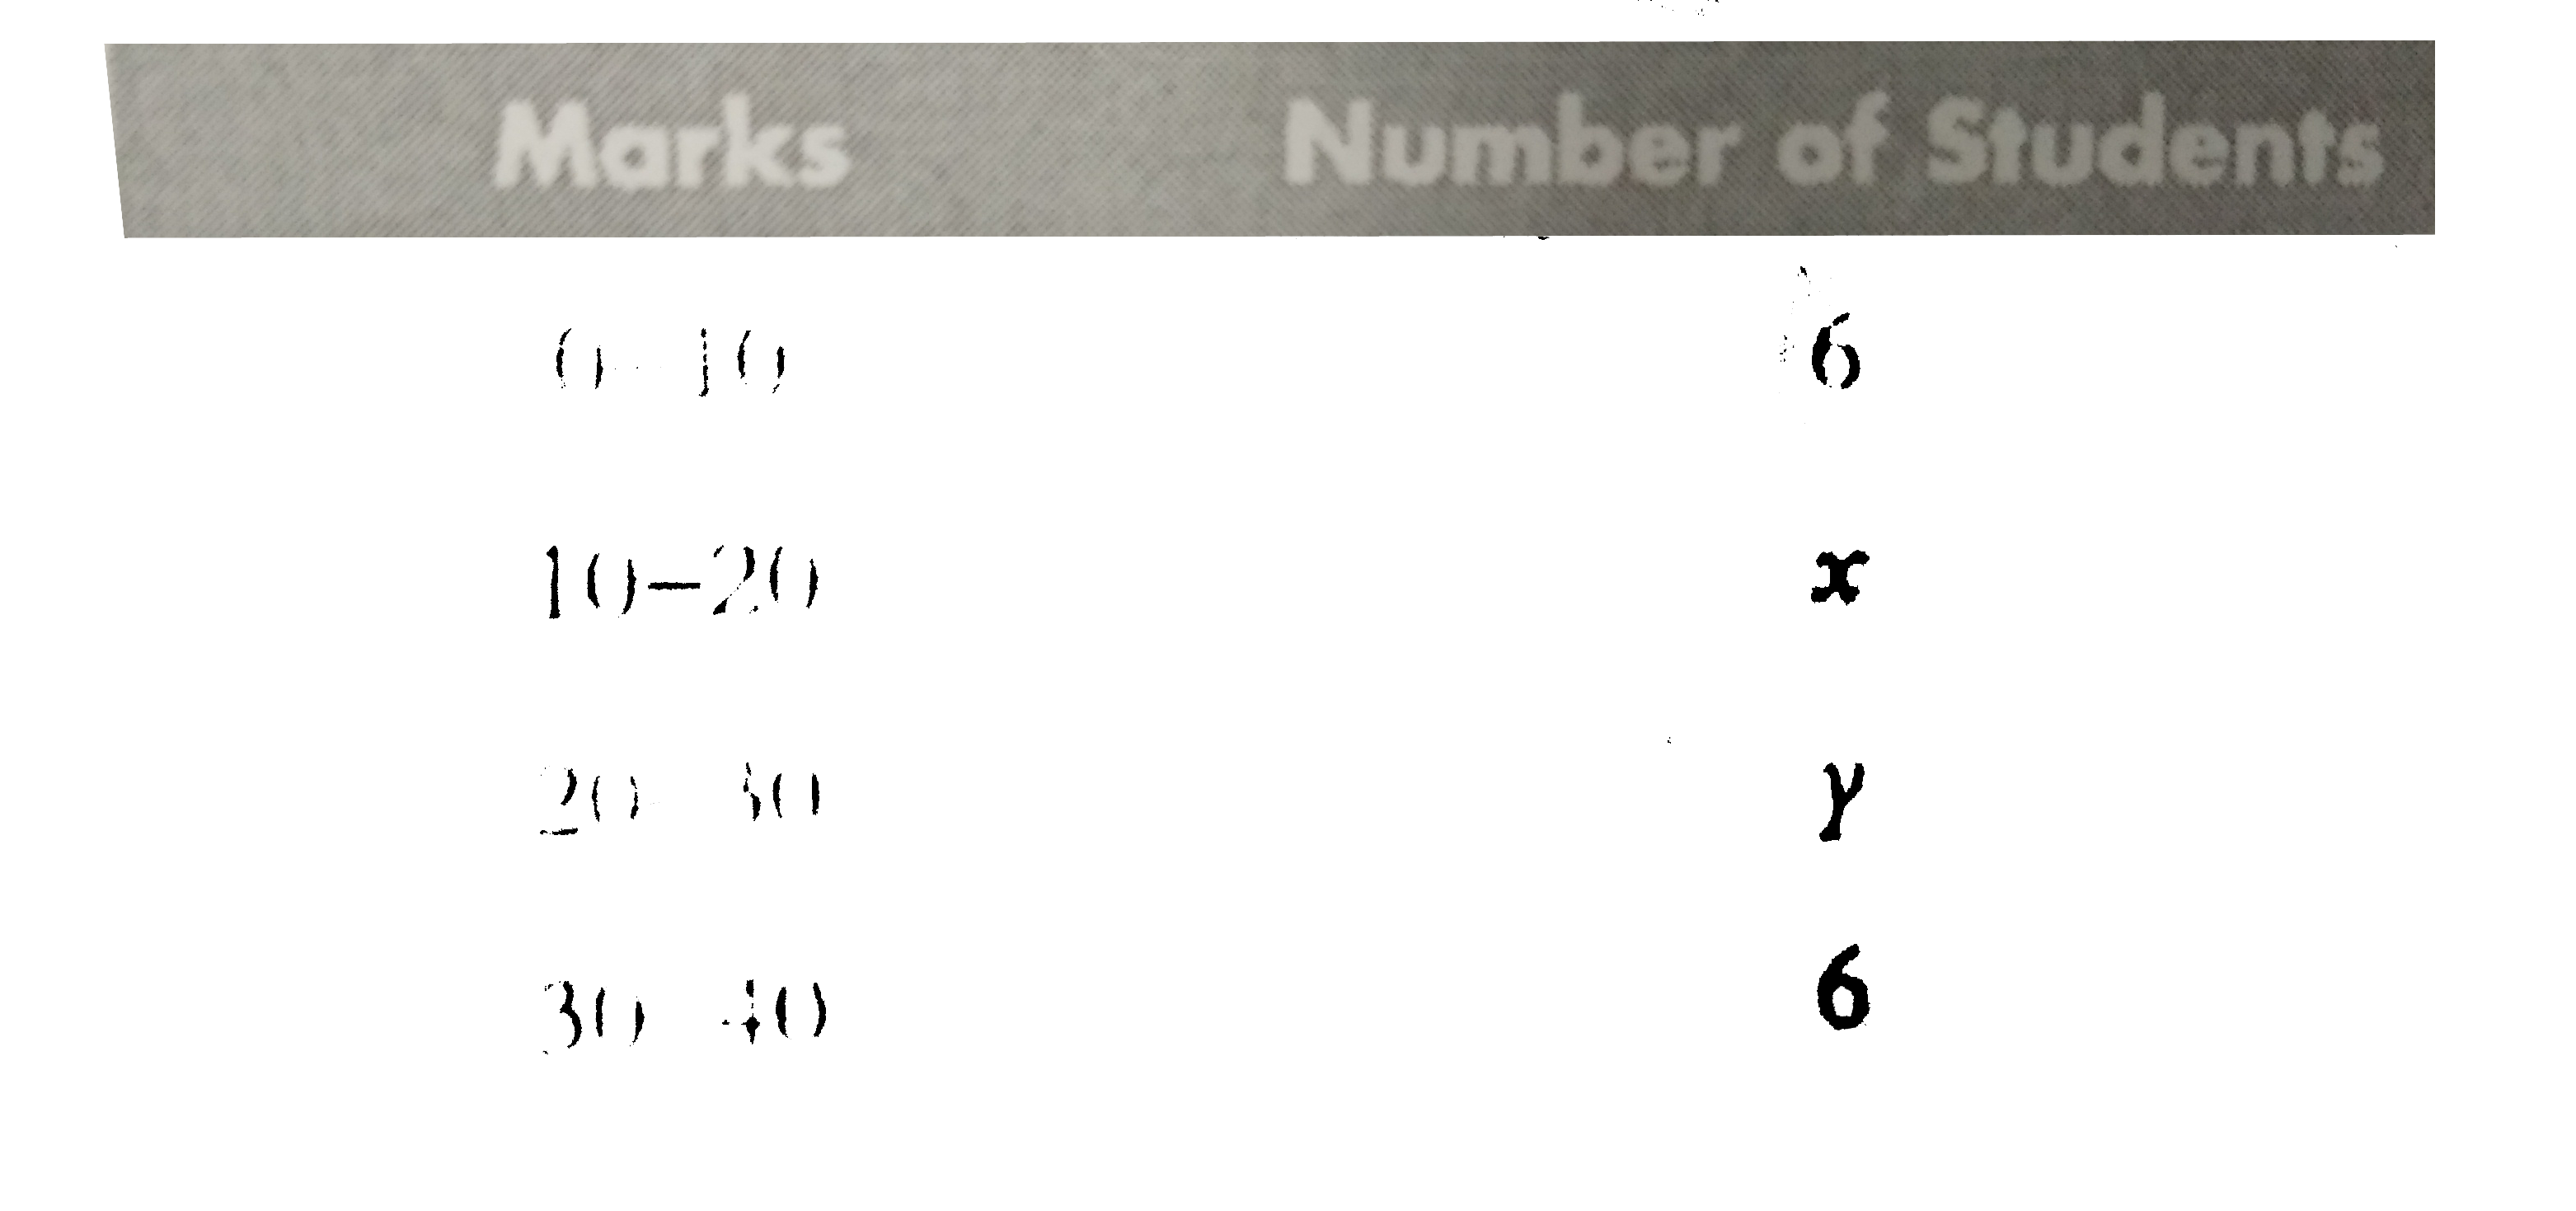
If for somes x∈R the frequency distribution of marks obtained by 20 students in a test is:

Then the mean of the marks is:
2.5
3.0
2.8
3.2
The correct Answer is:C
Topper's Solved these Questions
- STATISTICS BOOK - MCGROW HILL PUBLICATIONCHAPTER - STATISTICS EXERCISE - QUESTION FROM PREVIOUS YEARS. B-ARCHITECTURE ENTRANCE EXAMINATION PAPERS
13 Videos
- STATISTICS BOOK - MCGROW HILL PUBLICATIONCHAPTER - STATISTICS EXERCISE - EXERCISE (NUMERICAL ANSWER TYPE QUESTIONS)
9 Videos
- SETS, RELATIONS AND FUNCTIONSBOOK - MCGROW HILL PUBLICATIONCHAPTER - SETS, RELATIONS AND FUNCTIONSEXERCISE - QUESTIONS FROM PREVIOUS YEAR.S B-ARCHITECTURE ENTRANCE EXAMINATION PAPERS
19 Videos
- THE DIMENSIONAL GEOMETRY BOOK - MCGROW HILL PUBLICATIONCHAPTER - THE DIMENSIONAL GEOMETRY EXERCISE - QUESTIONS FROM PREVIOUS YEARS. B-ARCHITECTURE ENTRANCE EXAMINATION PAPERS
25 Videos
Similar Questions
Knowledge Check
The table shows the marks obtained by 25 students in a class test. Find the mean of the marks obtained
 A7.72B7.65C7.4D7
If for some x∈R the frequency distribution of the marks obtained by 20 statement in a test is :
Marks2357Frequency(x+12)(2x−5)(x2−3x)x then the mean of the marks is :A3.2B3C2.5D2.8
There are 60 students in a class. The followng is the frequency distribution of marks obtained by the students in a test.

where x is positive integer. Determine the mean of the marks.
View SolutionThe table shows the marks obtained by 25 students in a class test. Find the mean of the marks obtained

View SolutionThe frequency distribution of the marks obtained by 28 students in a test carrying 40 marks is given below :

If the mean of the above data is 20 , then find the difference between x and y .
View SolutionThe frequency distribution of marks obtained by students in a class test is given below .
Draw frequency polygon and ogive.

View SolutionThe frequency distribution of the marks obtained by 100 students in a test carrying 50 marks is given below. Then the mean is
Marks 0−910−1920−2930−3940−49No. of students 8 15 20 45 12
View SolutionThere are 60 students in a class. The following is the frequency distribution of marks obtained by the students in a test: Marks: 0 1 2 3 4 5 Frequency x−2 , x , x2 , (x+1)2 , 2x , x+1 Determine the mean and standard deviation.
View Solution

