Which of the following graphs represents zero order if A→P At t=0⇒[A]0 at t=t⇒[A]t


The correct Answer is:A, B, C, D
a. (CO−Ct)=x=K×t,Ct=C0−K×t (d) t12=C02K
Topper's Solved these Questions
- CHEMICAL KINETICSBOOK - AAKASH SERIESCHAPTER - CHEMICAL KINETICSEXERCISE - PRACTICE SHEET-5 (LINKED COMPREHENSION TYPE UESTIONS)
6 Videos
- CHEMICAL KINETICSBOOK - AAKASH SERIESCHAPTER - CHEMICAL KINETICSEXERCISE - PRACTICE SHEET-5 (MATCH THE FOLLOWING QUESTIONS)
2 Videos
- CHEMICAL KINETICSBOOK - AAKASH SERIESCHAPTER - CHEMICAL KINETICSEXERCISE - PRACTICE SHEET-4 (INTEGER ANSWER TYPE QUESTIONS)
6 Videos
- CHEMICAL KINETCSBOOK - AAKASH SERIESCHAPTER - CHEMICAL KINETCSEXERCISE - EXERCISE - 3.2
45 Videos
- CHEMICAL THERMODYNAMICSBOOK - AAKASH SERIESCHAPTER - CHEMICAL THERMODYNAMICSEXERCISE - Additional Practice Exercise
54 Videos
Similar Questions
Knowledge Check
Which of the following graphs represents zero order if
A→P
At t=0⇒[A]0
At t=t⇒[A]tA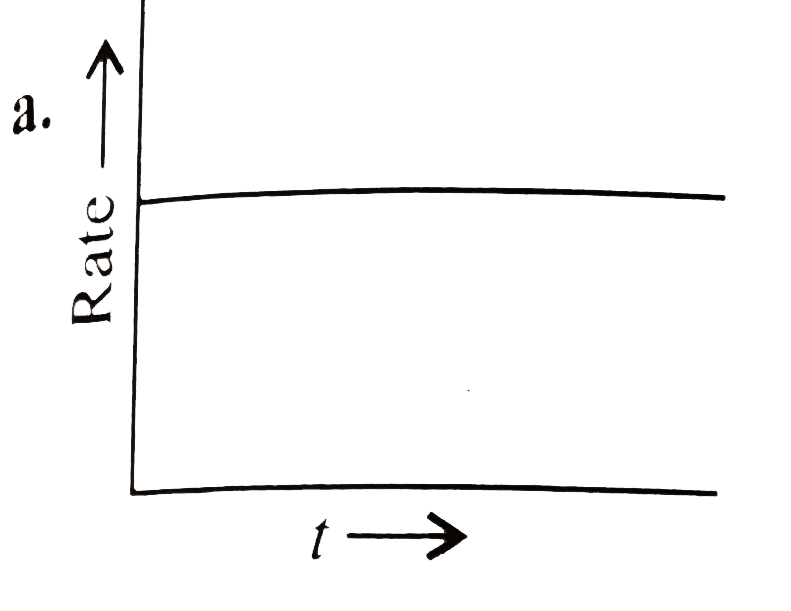 B
B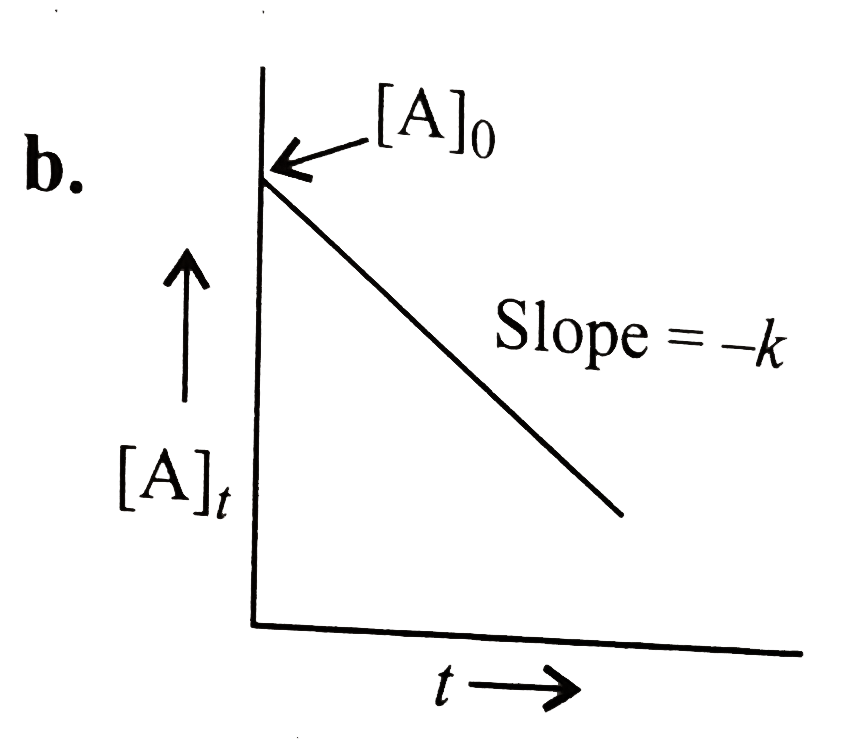 C
C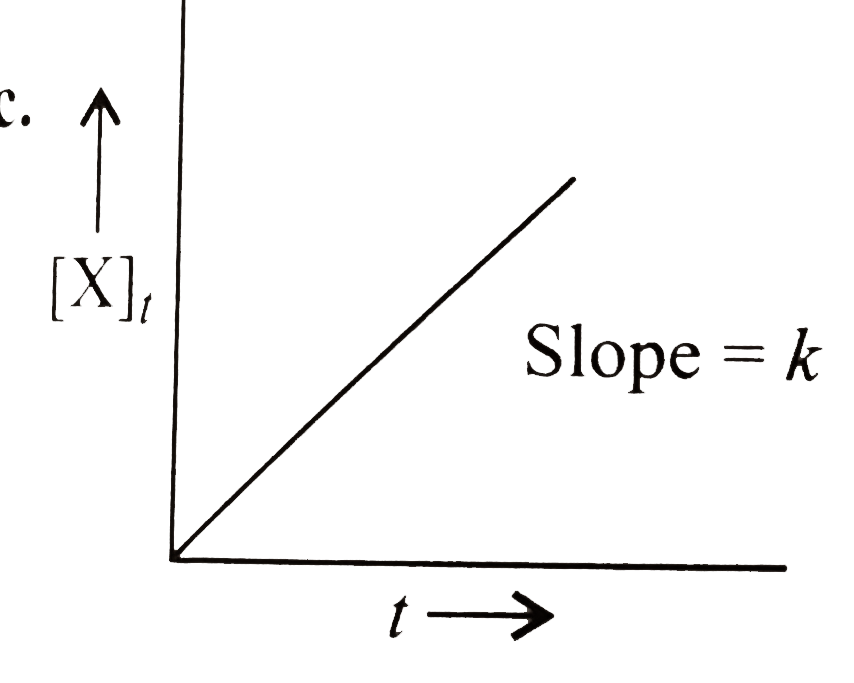 D
D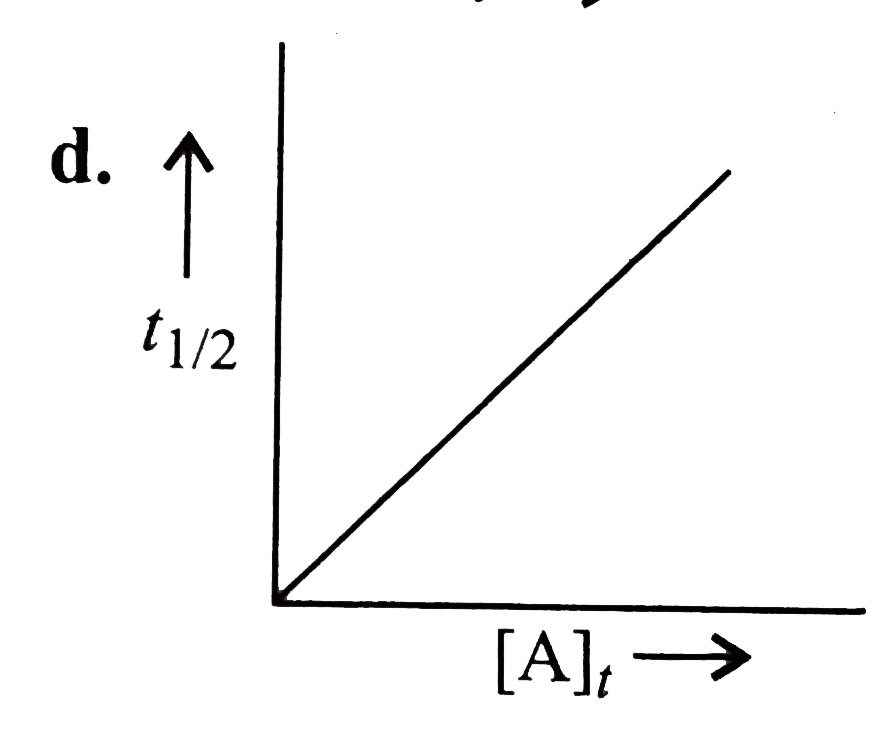
Which of the following x-t graphs does not represent periodic motion?
A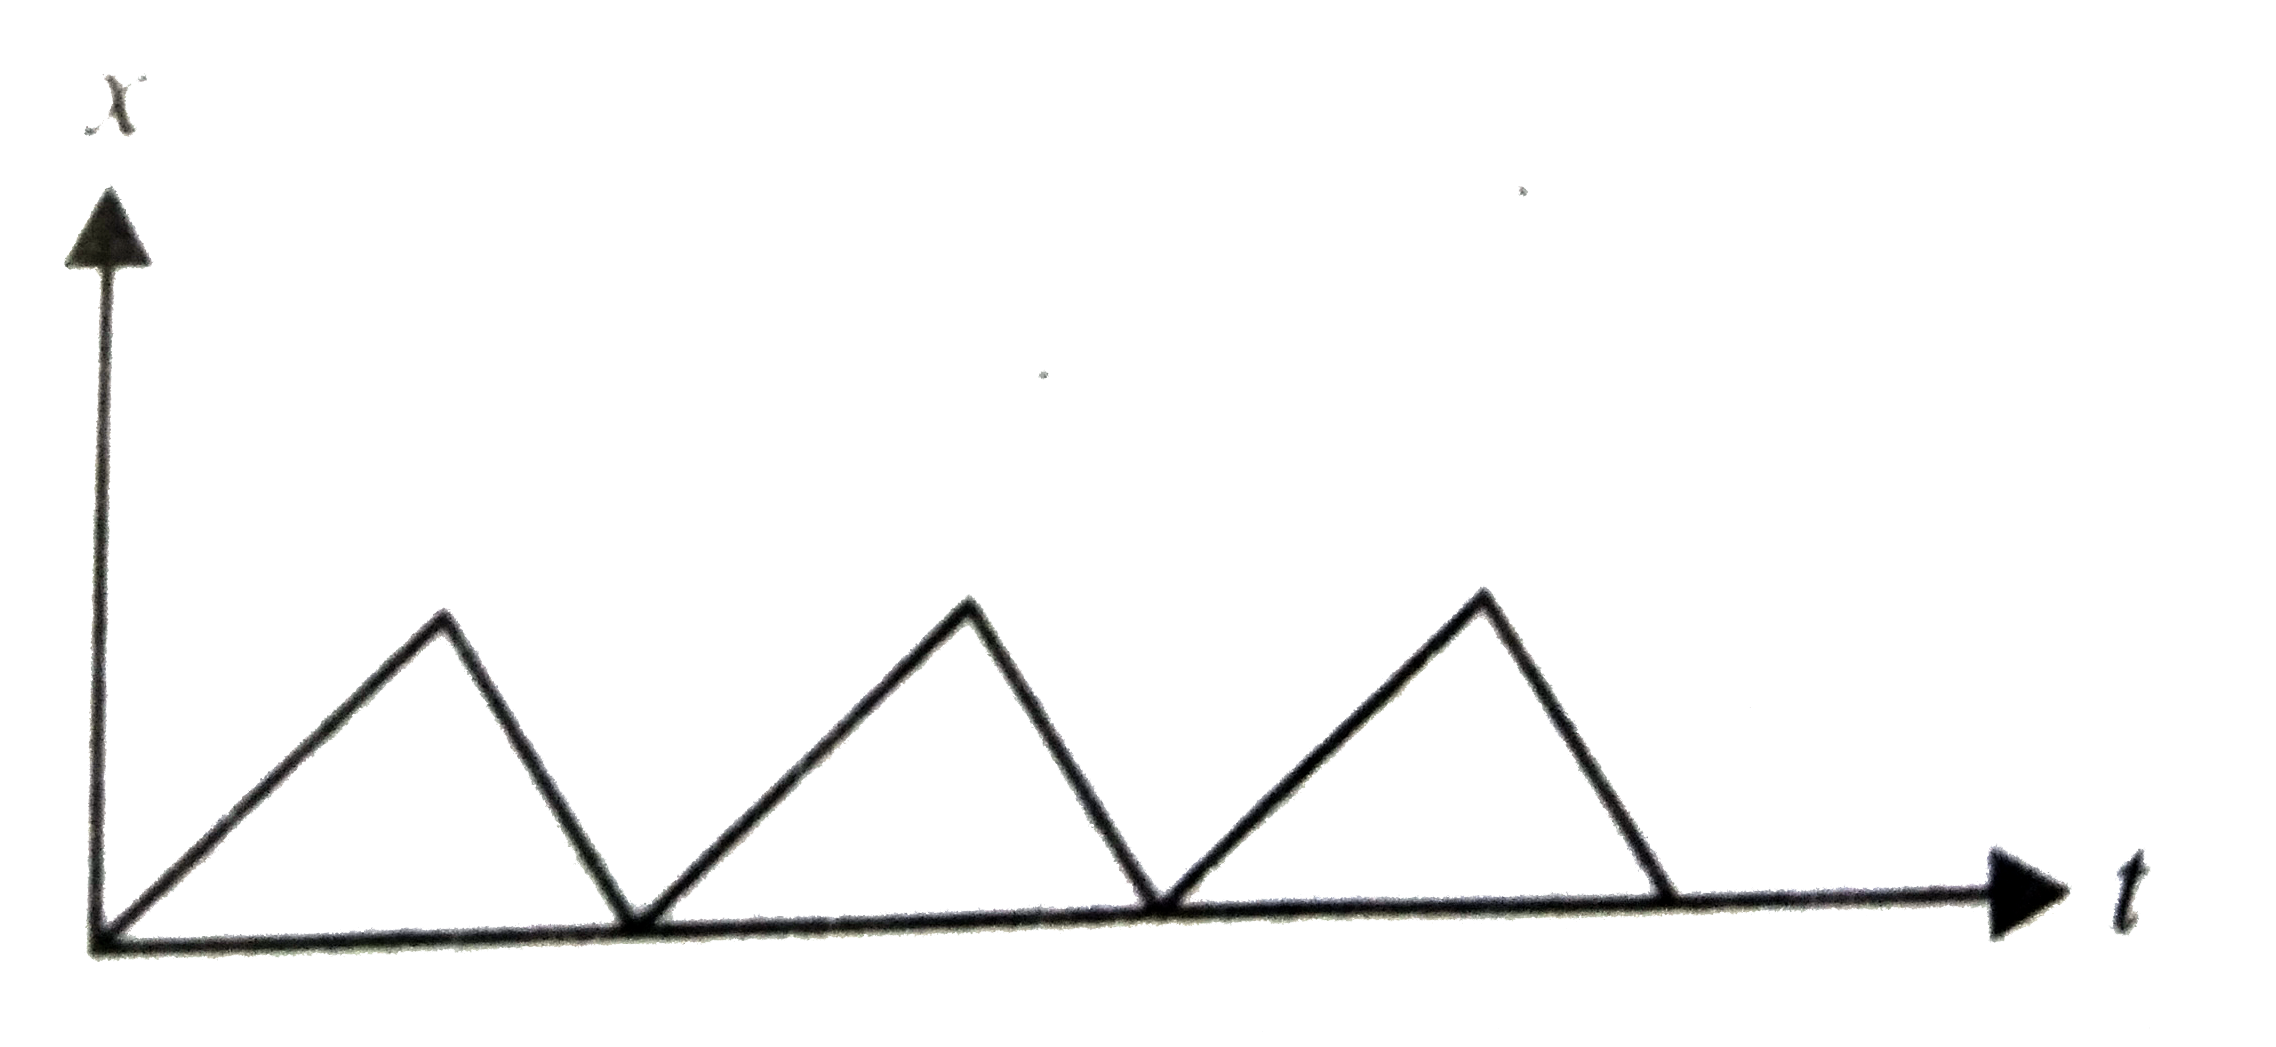 B
B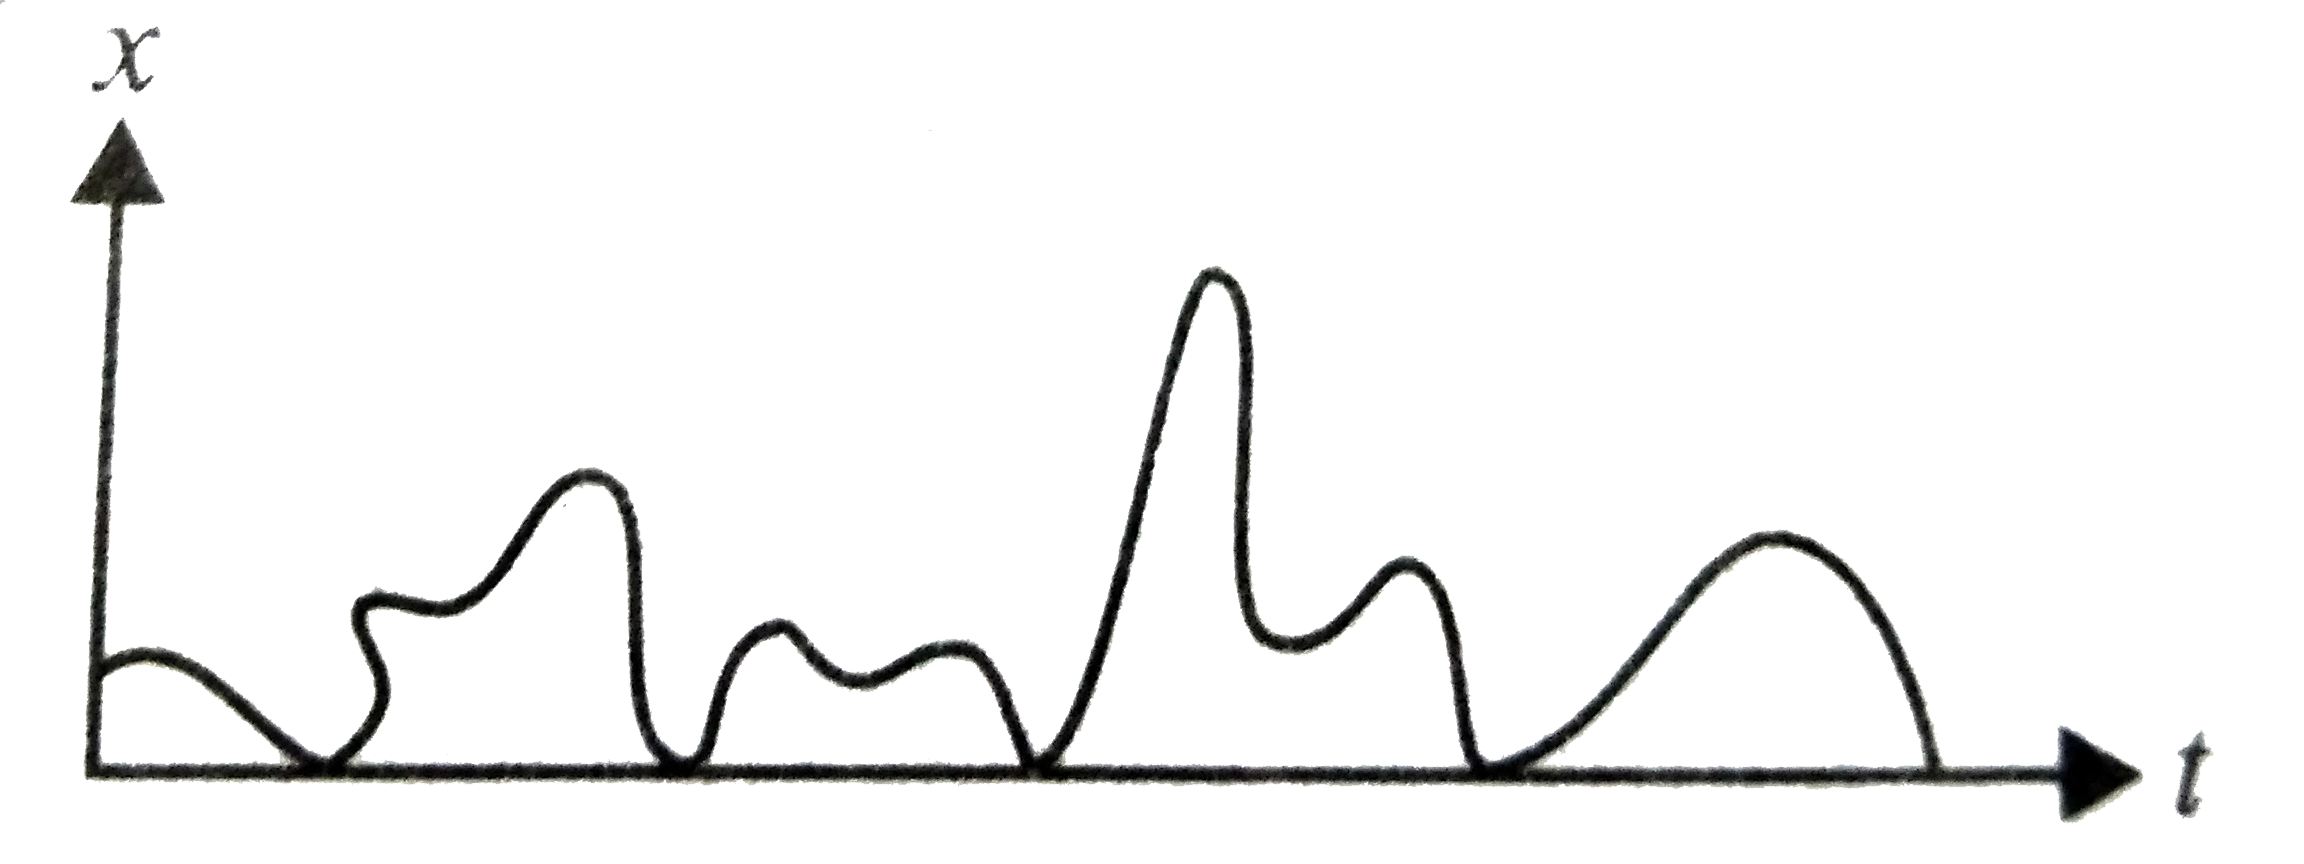 C
C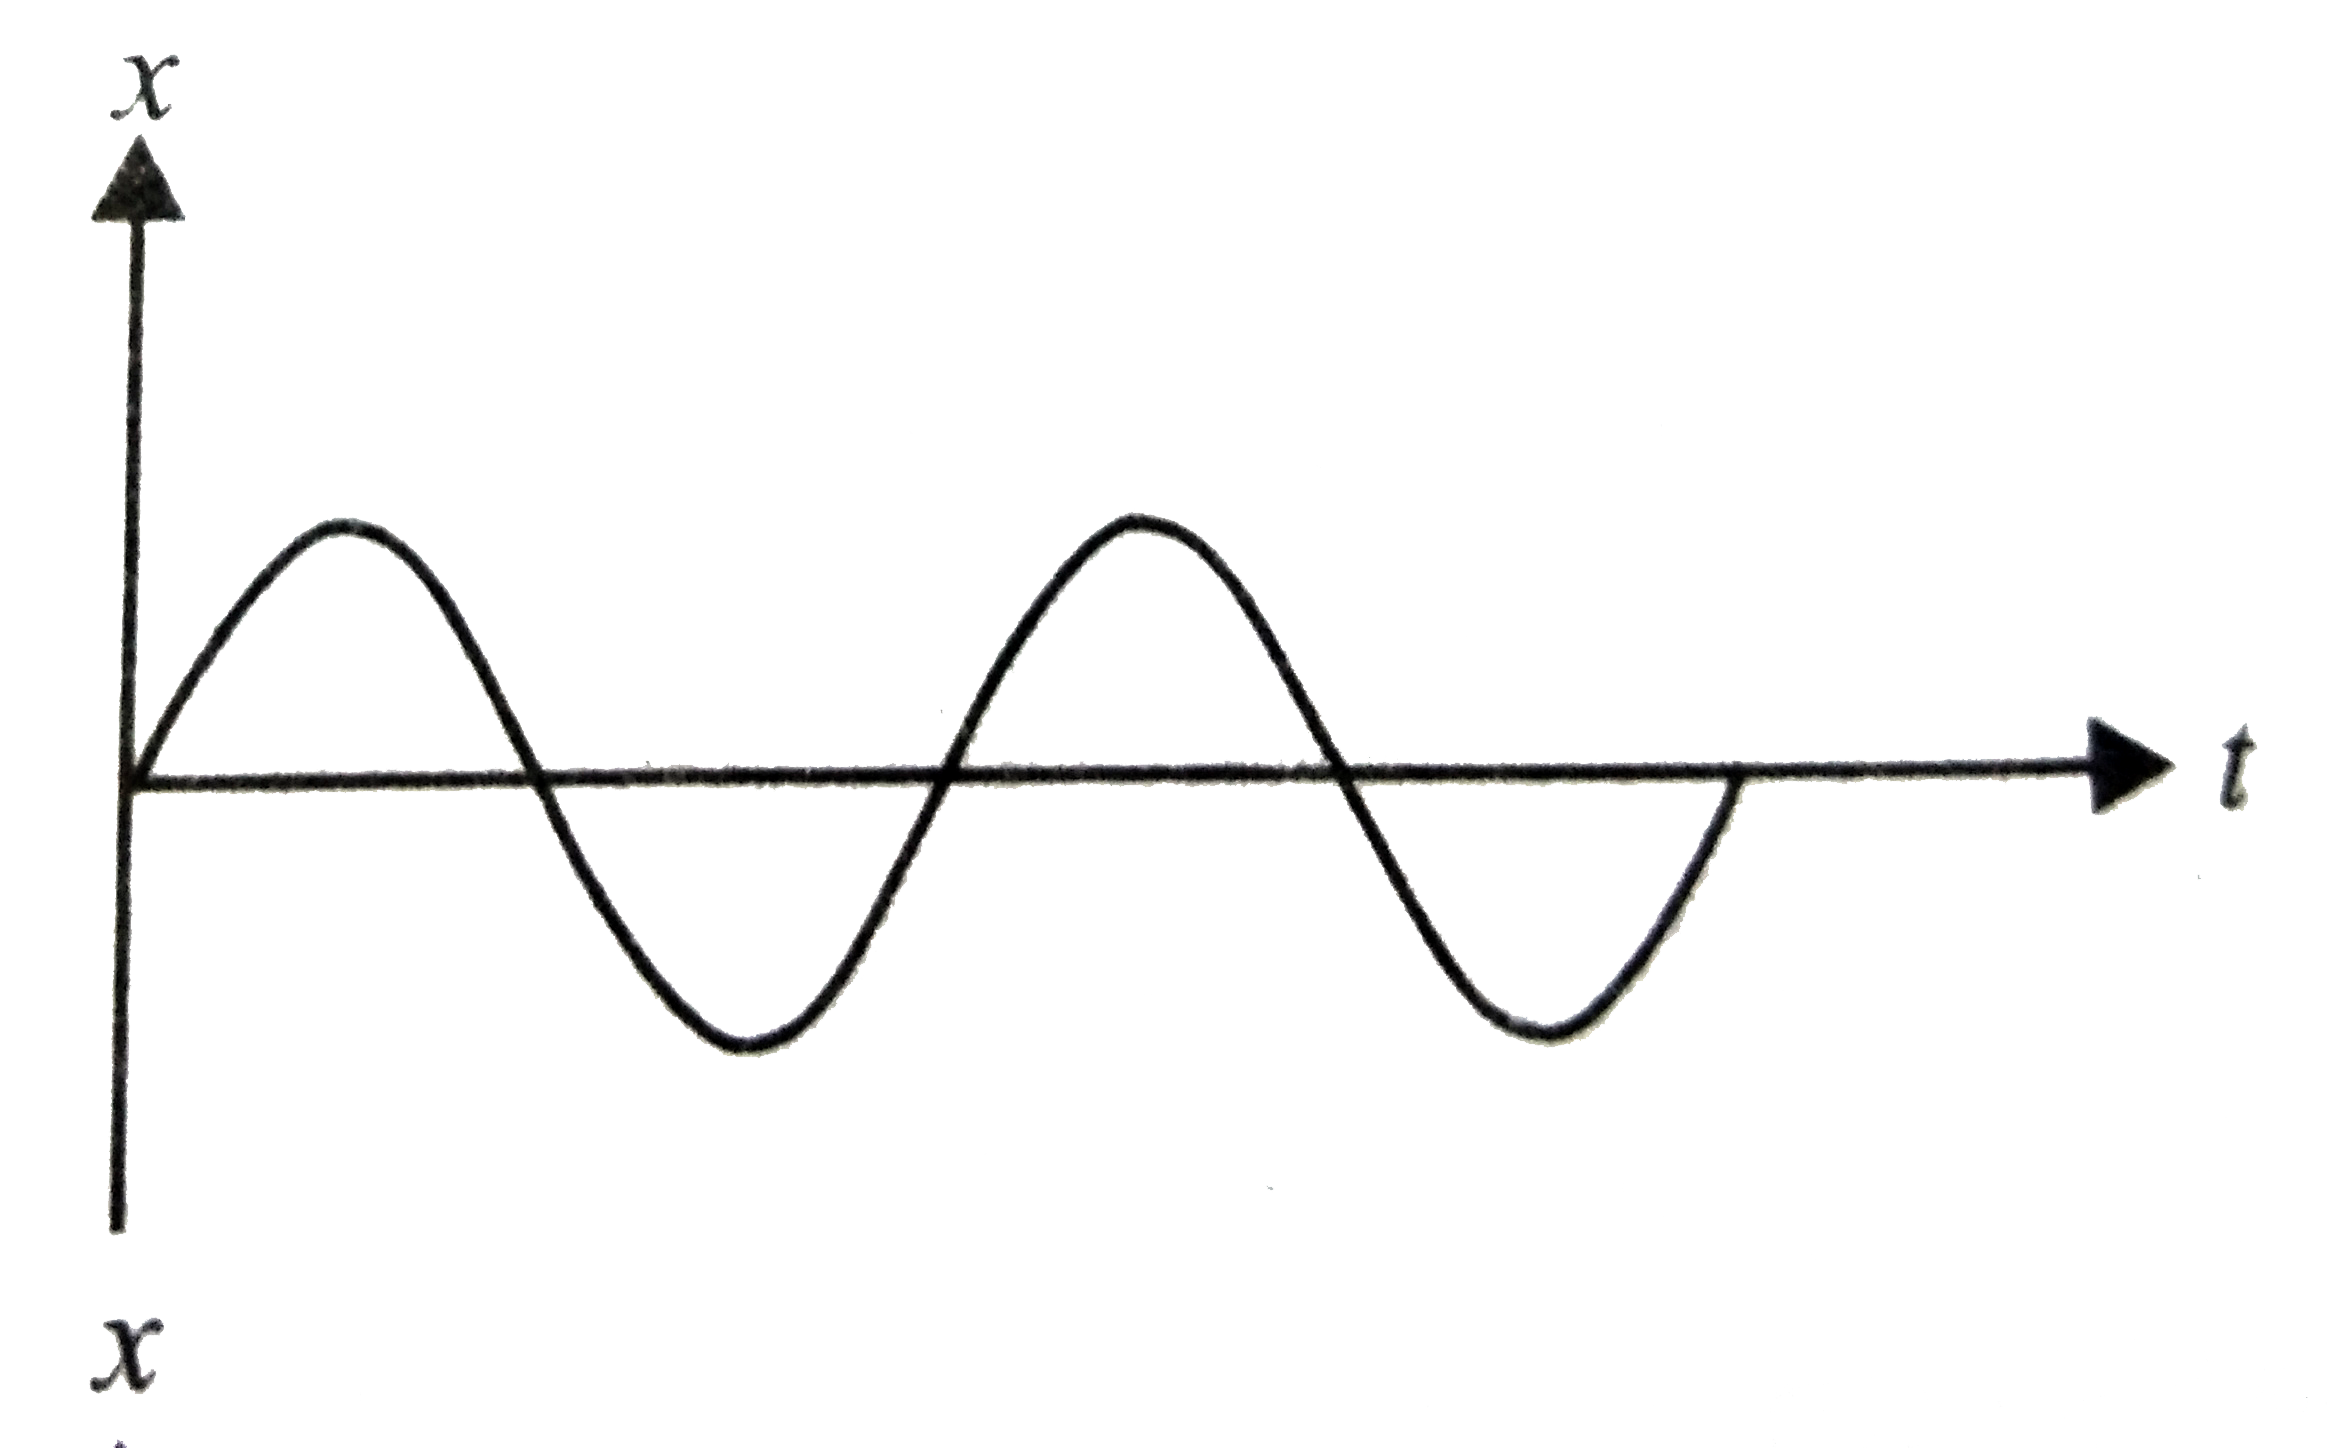 D
D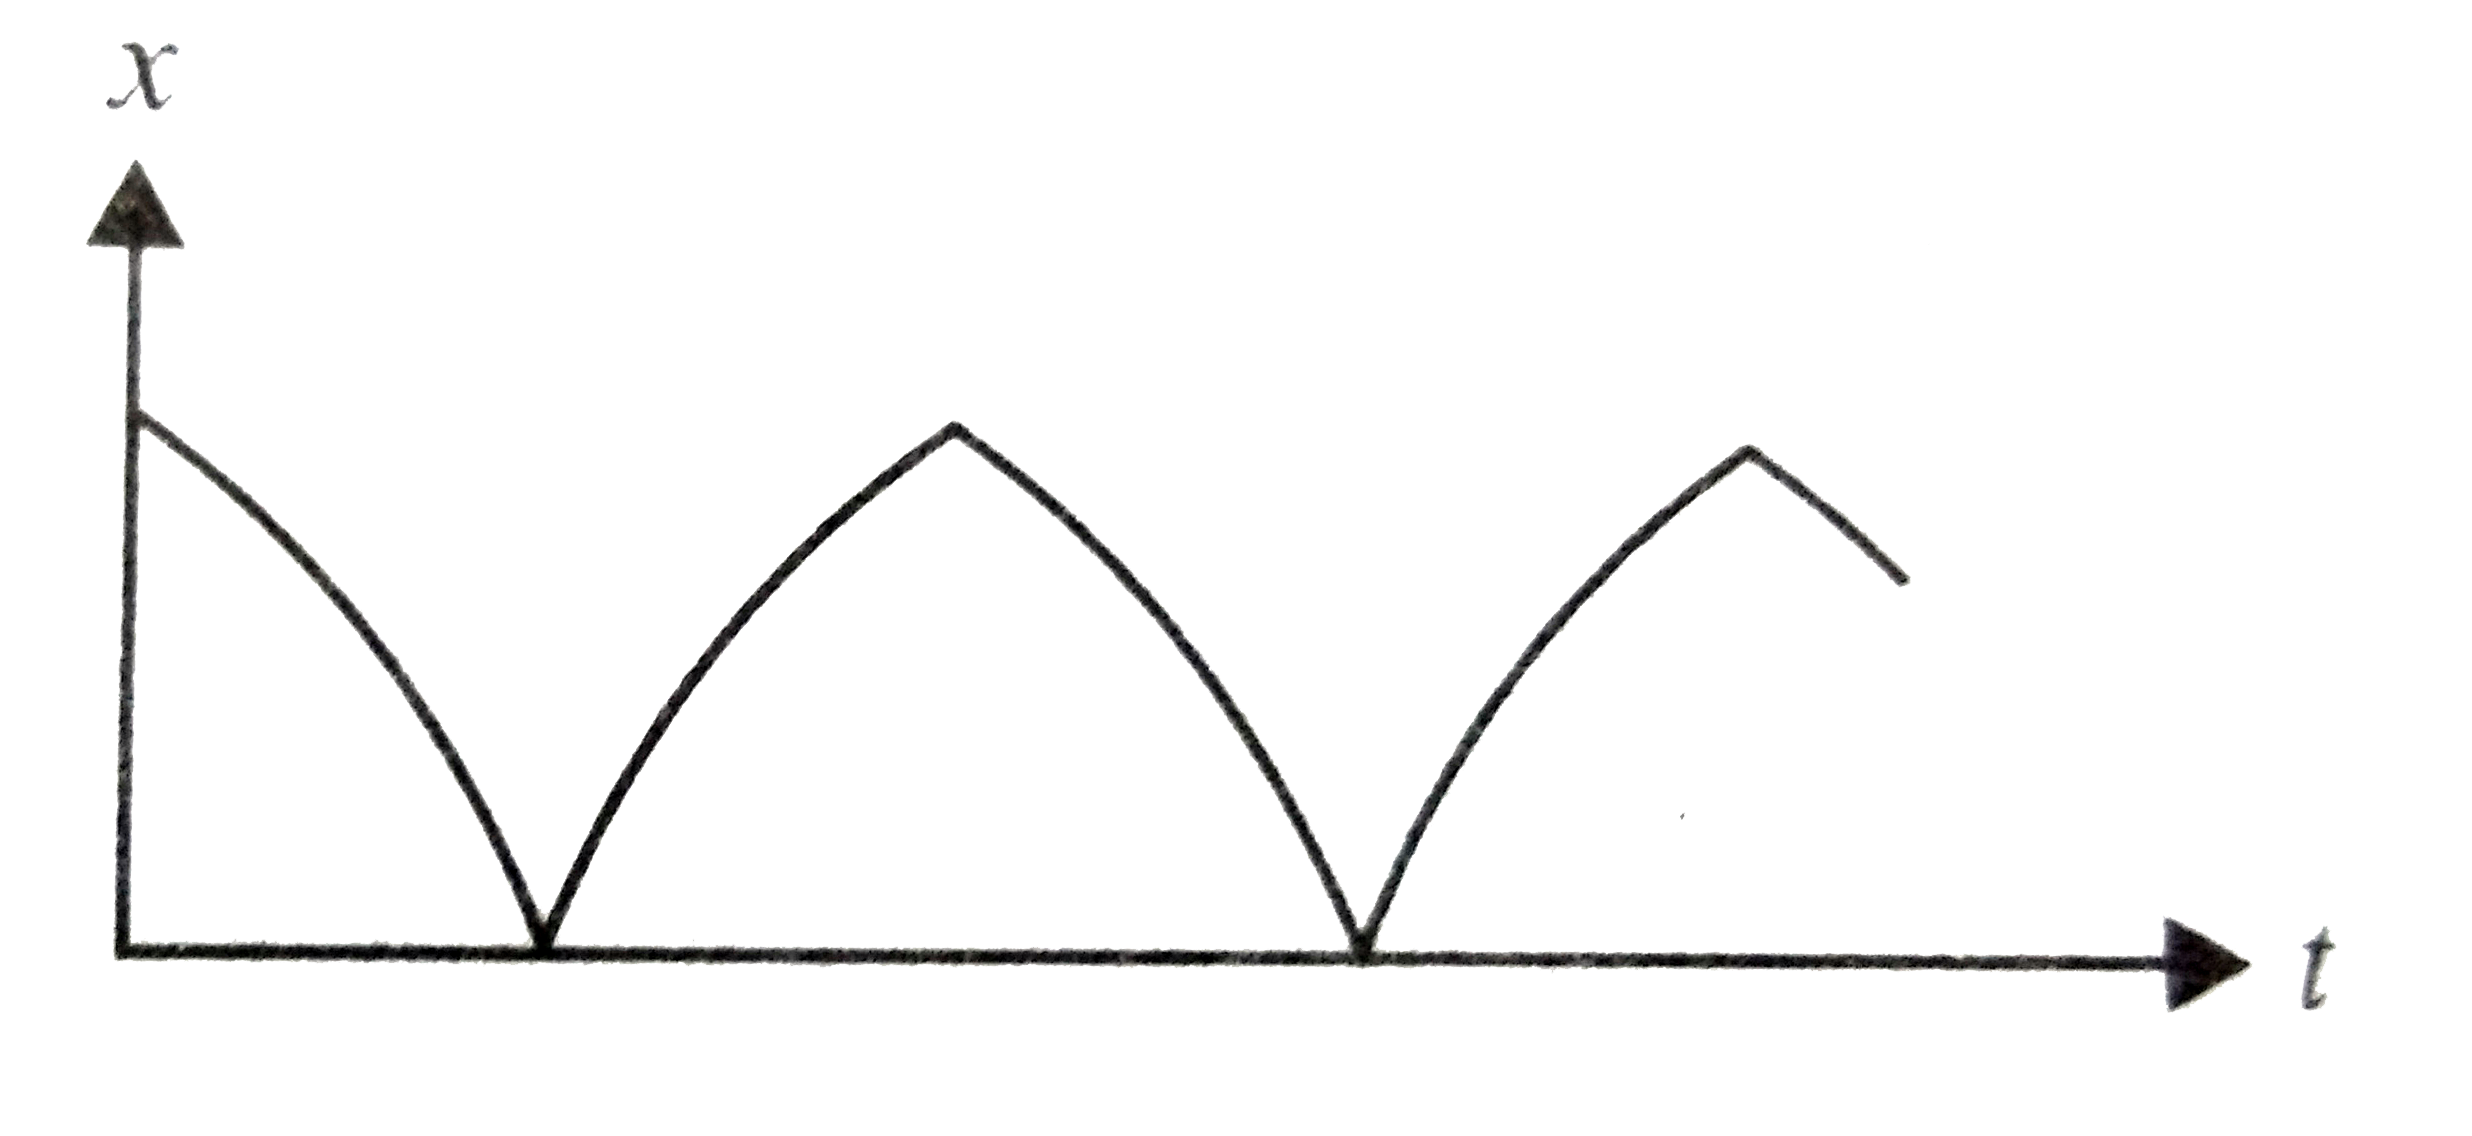
Which of the following x-t graphs does not represent periodic motion?
A B
B C
C D
D
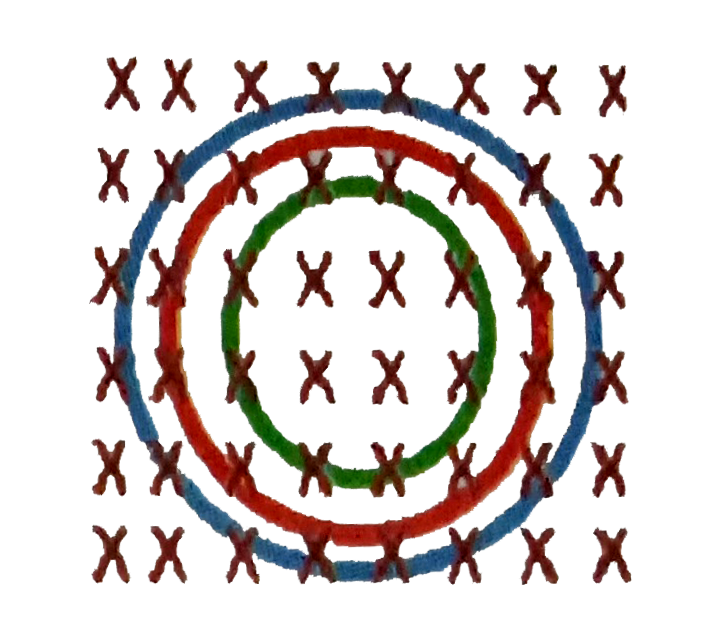
A flexible conducting wire in the form of a circle is kept in a uniform magnetic field with its plane normal to the field. Radius of that circle changes with time as shown. Then which of the following graphs represents the variation of induction emf with time R=R0,t<t0,R=R0+t,t0<t<2t0:
View SolutionAt time t=0, some radioactive gas is injected into a sealed vessel. At time T, some more of the same gas is injected into the same vessel. Which one of the following graphs best represents the variation of the logarithm of the activity A of the gas with time t?
View SolutionWhich of the following graphs represents the variation of activity (A) of a radioactive substance with time (t).
View Solutionwhich of the following graph represents the variation of resistivity (ρ) with temperature (T) for copper?
View SolutionThe graph shown the variation with times t of the velocity v of an object . Which one of the following graphs best represents the variation of acceleration a of the object with time t?

View Solution
