The oscillation of a body on a smooth horizontal surface is represented by the equation,
X=Acos(ωt)
where, X = displacement at time t
ω= frequency of oscillation
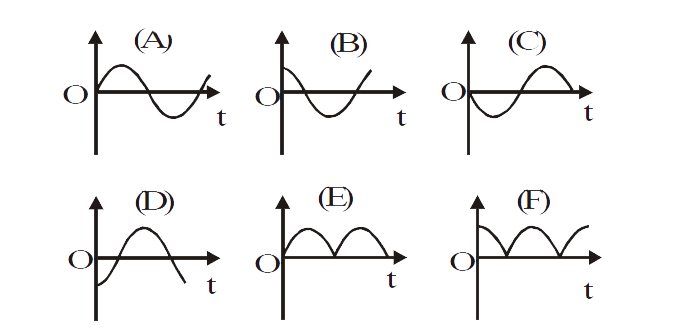
Which one of the following graphs shows correctly the variation a with t?
Here, a = acceleration at time t
T = time period
A

B

C

D

Video Solution
Text Solution
The correct Answer is:C
Here. X=Acosωt
∴ Velocity, v=dXdt=ddt(Acosωt)=−Aωsinωt
Acceleration, a=dvdt=ddt(−Aωsinωt)=−Aω2cosωt
Hence the variation of a with t is correctly shown by graph (c ).
|
Topper's Solved these Questions
- OSCILLATIONS AND WAVES BOOK - MTG GUIDECHAPTER - OSCILLATIONS AND WAVES EXERCISE - CHECK YOUR NEET VITALS
25 Videos
- MOTION OF SYSTEM OF PARTICLES AND RIGID BODY BOOK - MTG GUIDECHAPTER - MOTION OF SYSTEM OF PARTICLES AND RIGID BODY EXERCISE - AIPMT / NEET (MCQs)
37 Videos
- PHYSICAL WORLD AND MEASUREMENTBOOK - MTG GUIDECHAPTER - PHYSICAL WORLD AND MEASUREMENTEXERCISE - AIPMT / NEET MCQ
14 Videos
Similar Questions
Knowledge Check
The oscillationof a body on a smooth horizontal surface is represented by the equation
x=Acosωt
where x= displacement at time t, ω= frequency of oscillation. Which one of the following graphs shows correctly the variation of acceleration a with time t ?A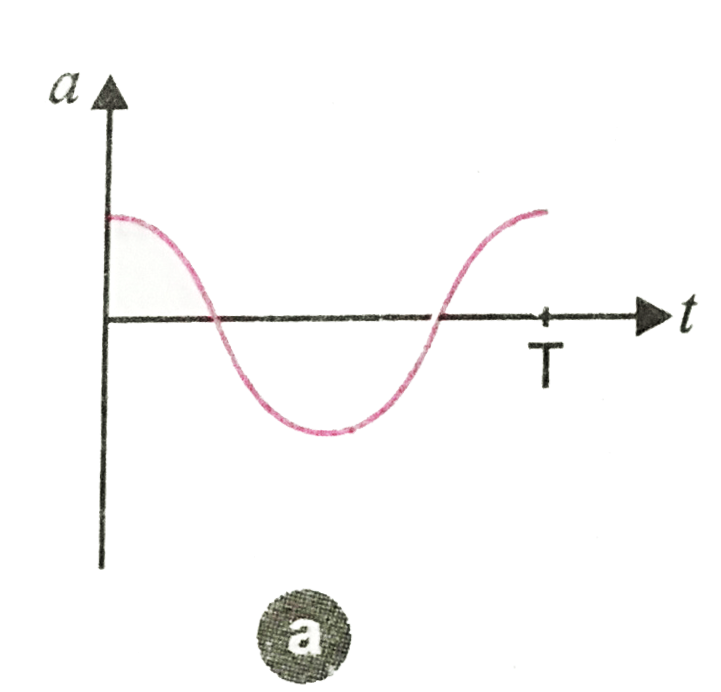 B
B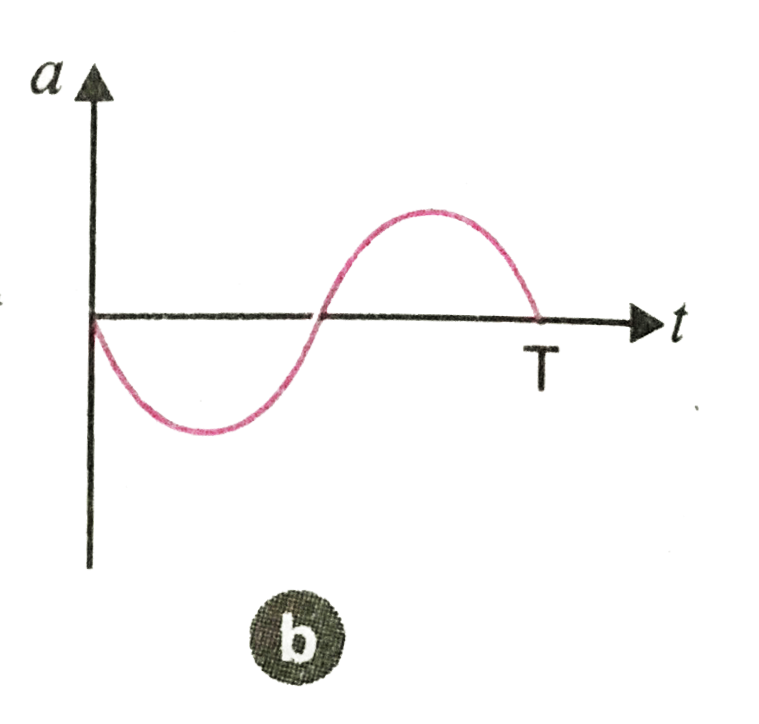 C
C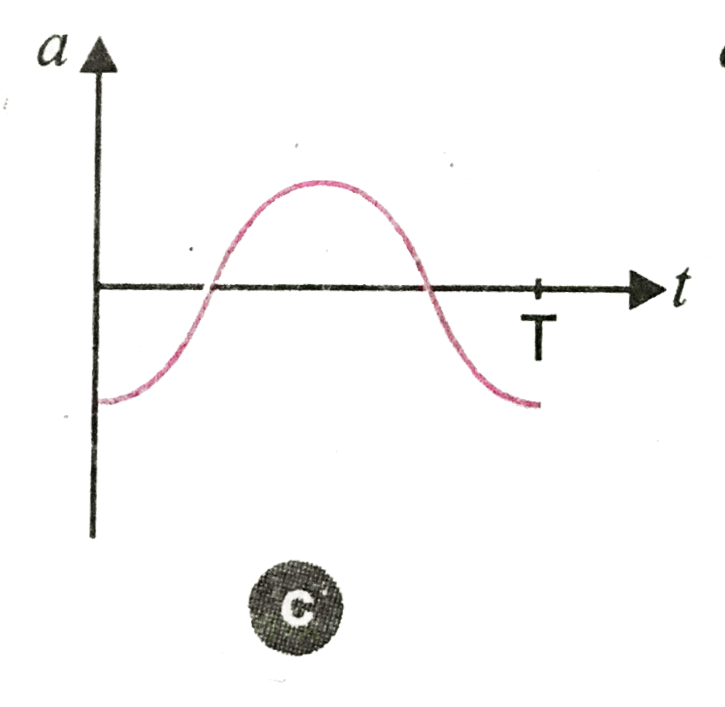 D
D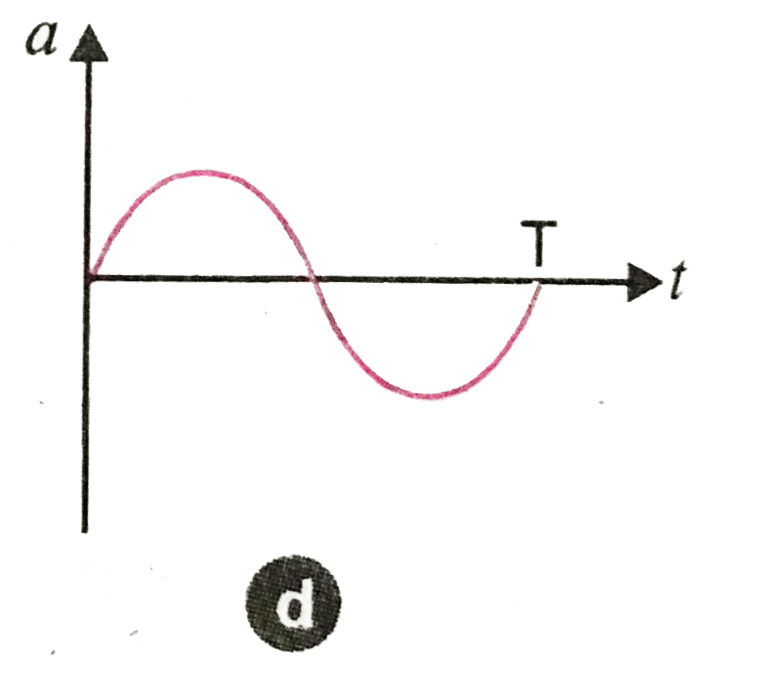
The oscillation of a body on a smooth horizontal surface is represented by the equation
X=Acos(ωt)
which one of the following graph shown correctly the variation a with t?A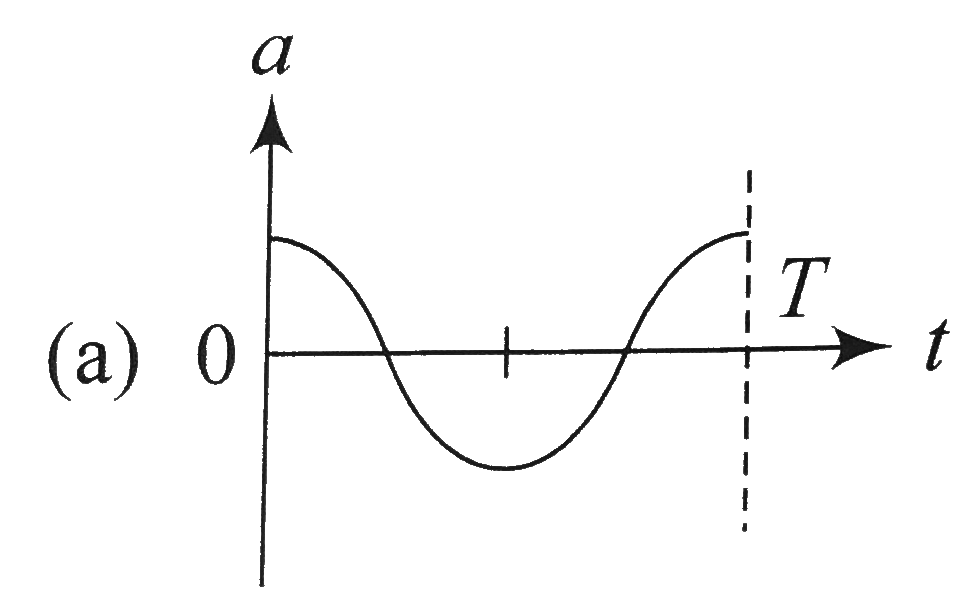 B
B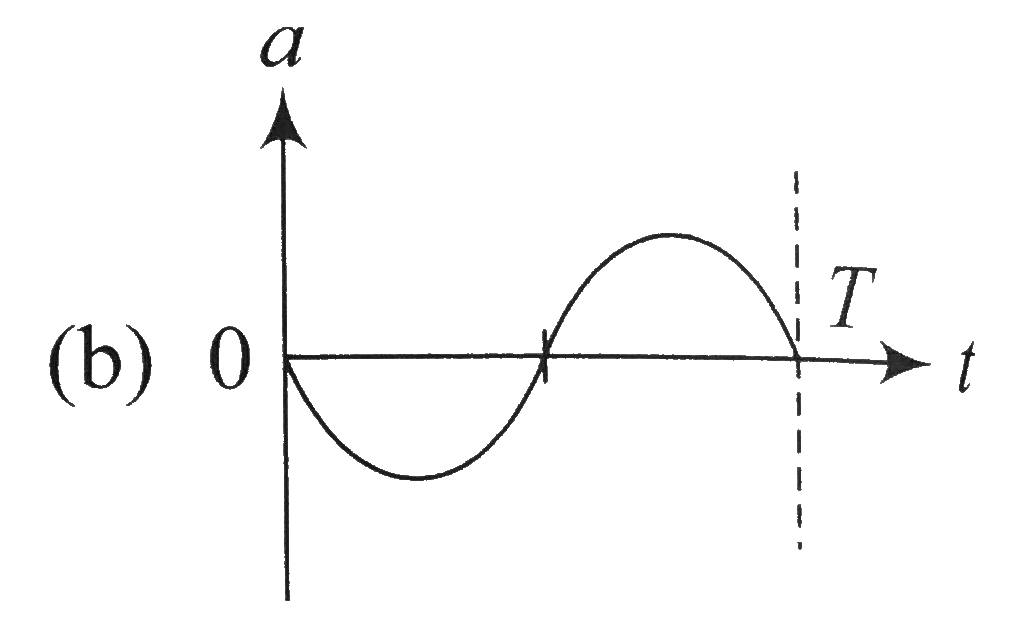 C
C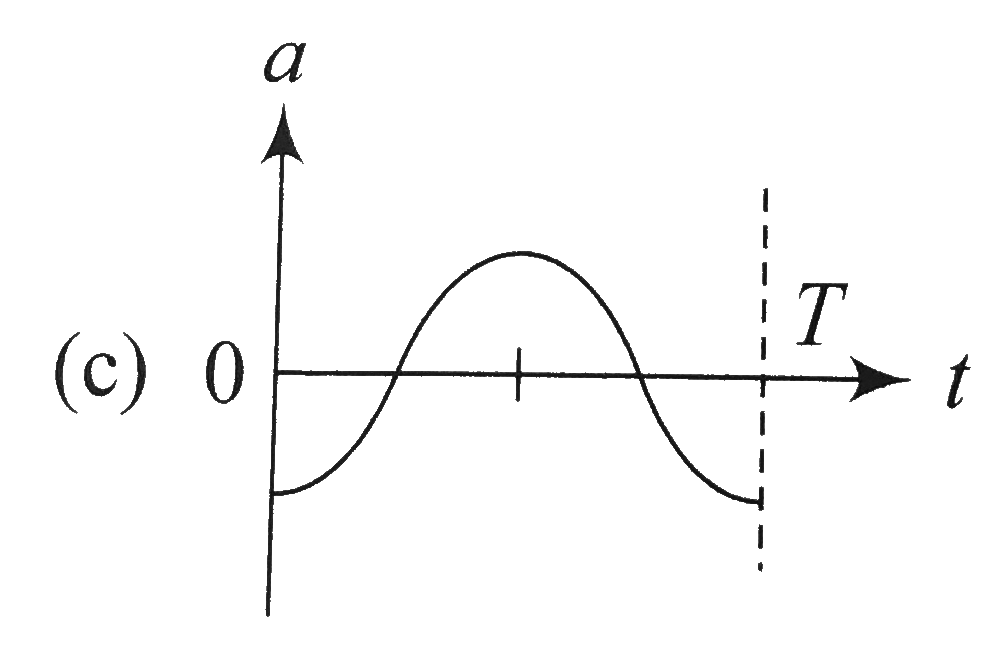 D
D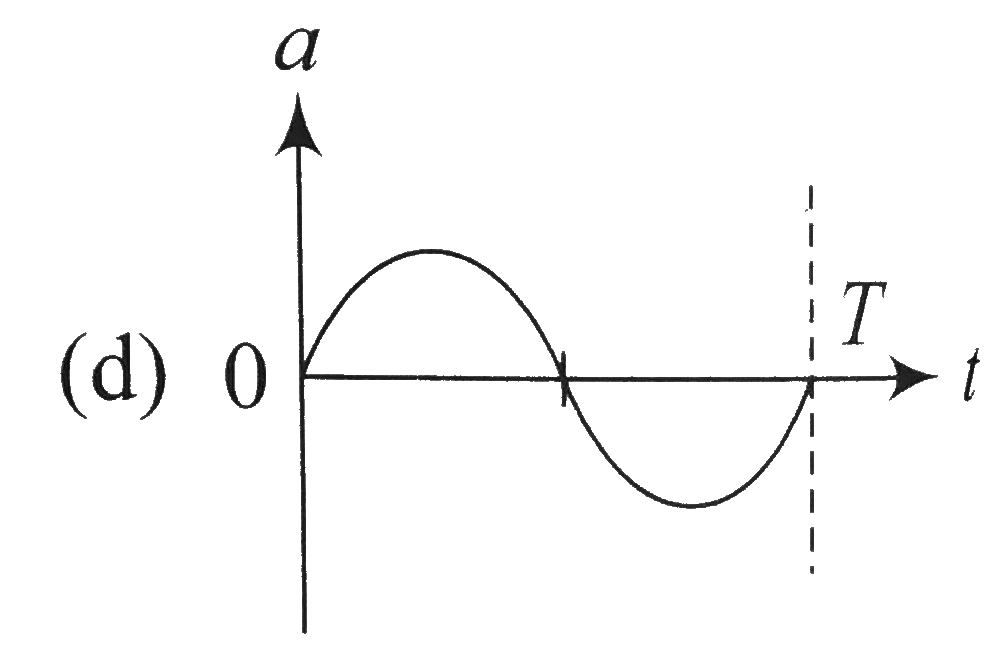
Which of the following graphs represents the variation of activity (A) of a radioactive substance with time (t).
A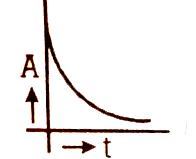 B
B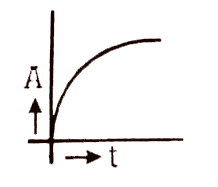 C
C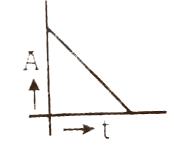 D
D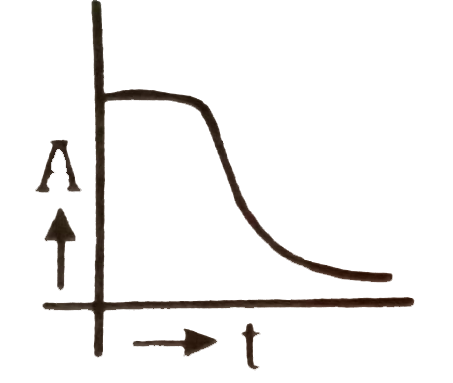
The displacement of a particle in S.H.M. is x=asinωt. Which of the following graph between displacement and time is correct :
View SolutionThe graph shown the variation with times t of the velocity v of an object . Which one of the following graphs best represents the variation of acceleration a of the object with time t?

View SolutionIf displacement x at time t is x=√1+t2, then acceleration is
View SolutionA simple harmonic motion is represented by
x(t)=sin2ωt−2cos2ωt. The angular frequency of oscillation is given by
View SolutionA simple pendulum of length φ oscillates with the time period T . Then which of the following graph correctly represents the relation ?
View Solution
