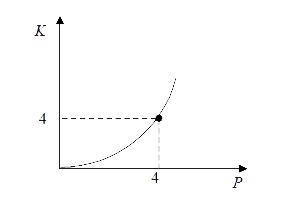
The graph bet ween kinetic energy (E) and speed (v) of the body is correctly shown by

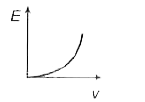
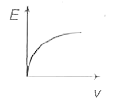
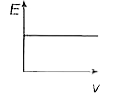
The correct Answer is:B
To determine the correct graph between kinetic energy (E) and speed (v) of a body, we start by recalling the formula for kinetic energy:
1. Write the formula for kinetic energy:
E=12mv2
where E is the kinetic energy, m is the mass of the body, and v is its speed.
2. Identify the relationship between kinetic energy and speed:
In the formula, we can see that kinetic energy E is proportional to the square of the speed v. This means:
E∝v2
3. Rearranging the equation:
We can express this relationship as:
E=12mv2
Here, 12m is a constant (let's denote it as p), so we can rewrite it as:
E=pv2
4. Identify the type of graph:
The equation E=pv2 is in the form of y=ax2, where y is the kinetic energy E, x is the speed v, and a is a positive constant p. This indicates that the graph of kinetic energy against speed will be a quadratic function.
5. Determine the shape of the graph:
Since the coefficient of v2 is positive, the graph will be an upward-opening parabola.
6. Select the correct option:
Based on the analysis, the graph between kinetic energy and speed will be an upward parabola. Therefore, we look for the option that represents an upward parabola.
7. Conclusion:
The correct option that represents the graph between kinetic energy (E) and speed (v) is option 1, which is an upward parabola.
E=12mv2
where E is the kinetic energy, m is the mass of the body, and v is its speed.
In the formula, we can see that kinetic energy E is proportional to the square of the speed v. This means:
E∝v2
We can express this relationship as:
E=12mv2
Here, 12m is a constant (let's denote it as p), so we can rewrite it as:
E=pv2
The equation E=pv2 is in the form of y=ax2, where y is the kinetic energy E, x is the speed v, and a is a positive constant p. This indicates that the graph of kinetic energy against speed will be a quadratic function.
Since the coefficient of v2 is positive, the graph will be an upward-opening parabola.
Based on the analysis, the graph between kinetic energy and speed will be an upward parabola. Therefore, we look for the option that represents an upward parabola.
The correct option that represents the graph between kinetic energy (E) and speed (v) is option 1, which is an upward parabola.
Topper's Solved these Questions
Similar Questions
Knowledge Check
- Question 1 - Select One
Acceleration A and time period T of a body in S.H.M. is given by a curve shown below. Then corresponding graph, between kinetic energy (K.E.) and time t is correctly represented by
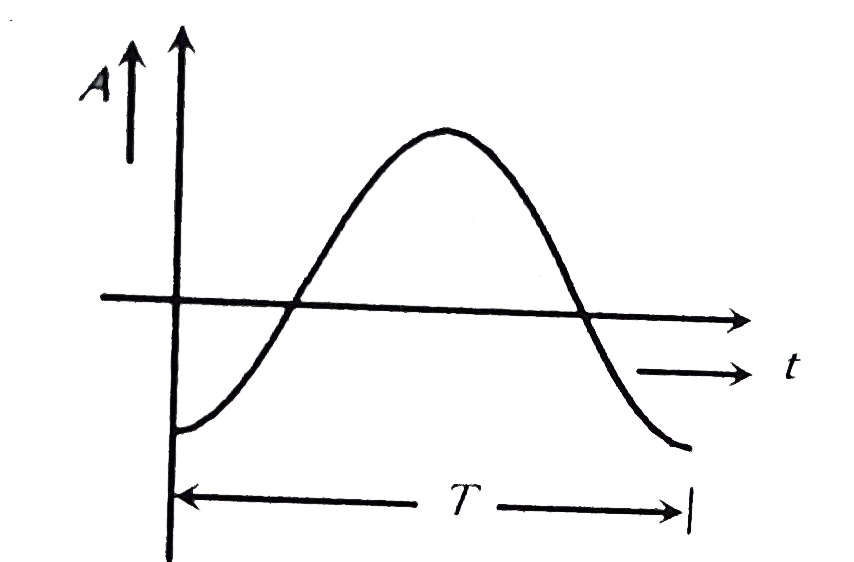 A
A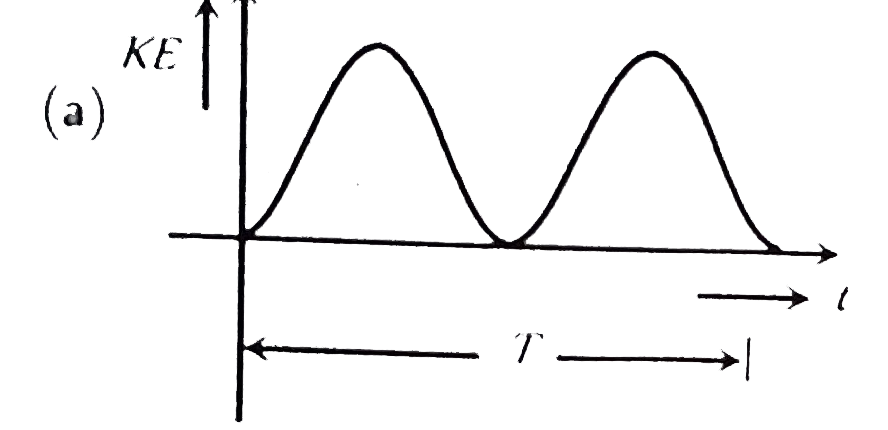 B
B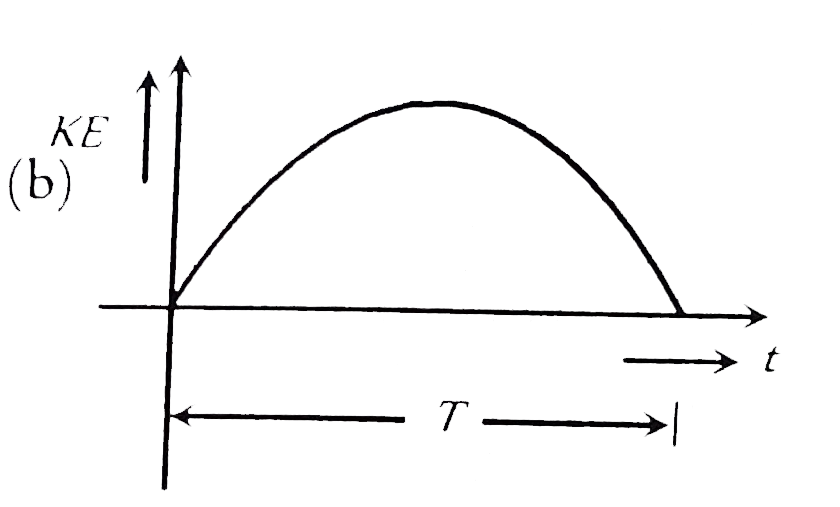 C
C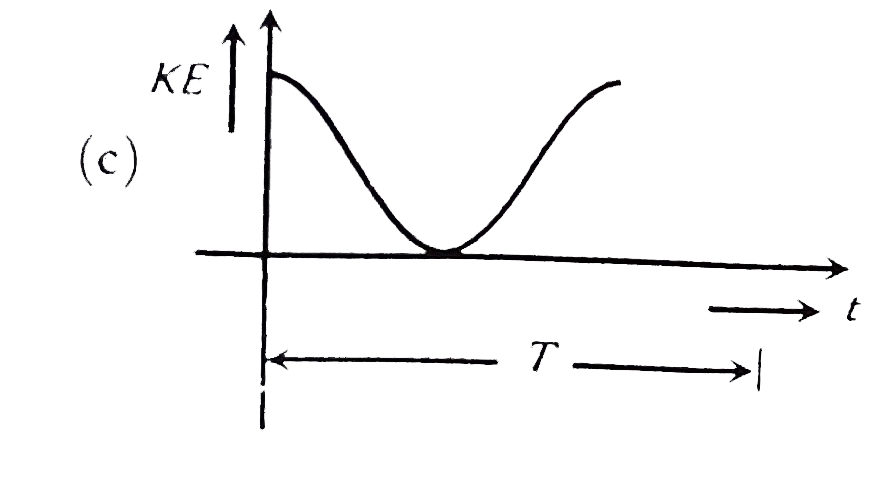 D
D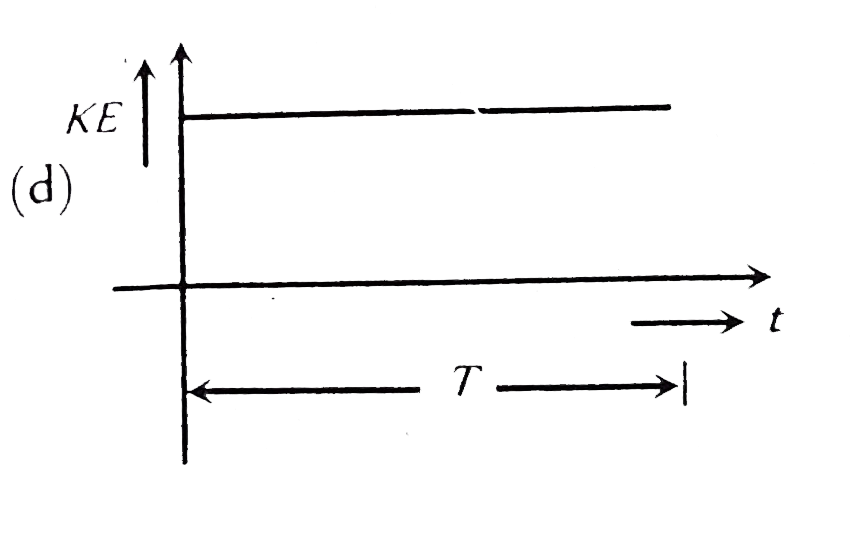
- Question 2 - Select One
Acceleration a versus time t graph of a body in SHM is given by a curve shown below. T is the time period Then corresponding graph between kinetic energy KE and time t is correctly represented by
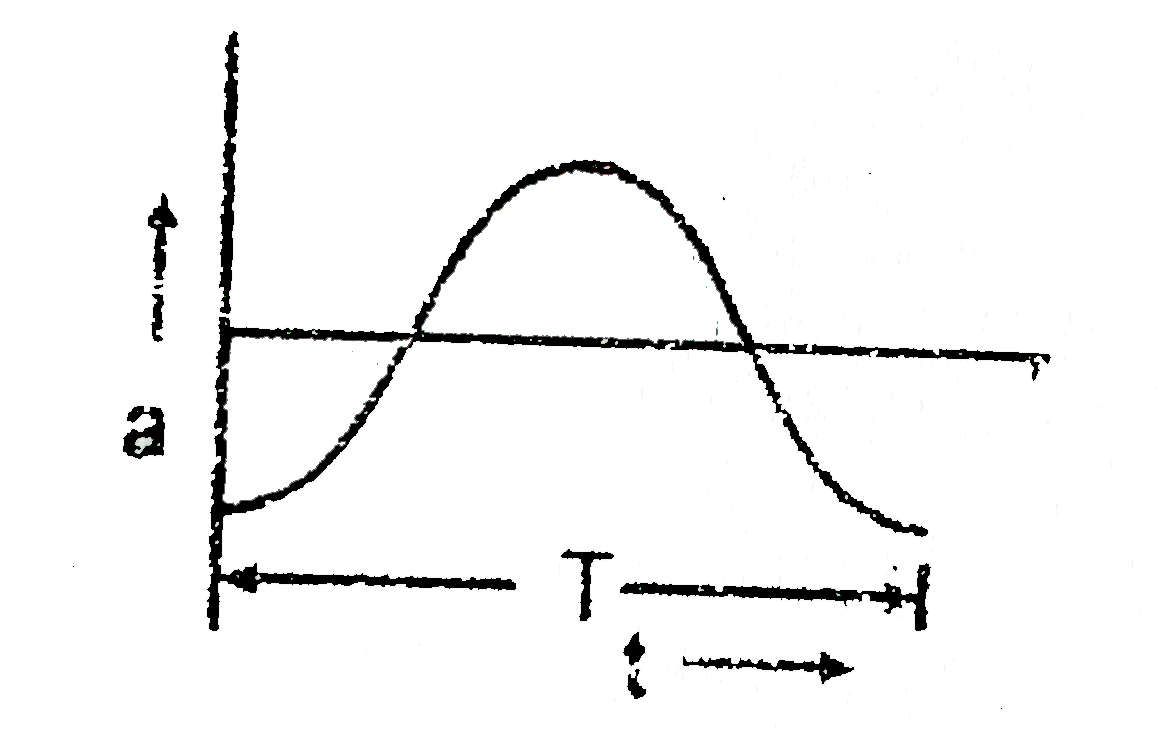 A
A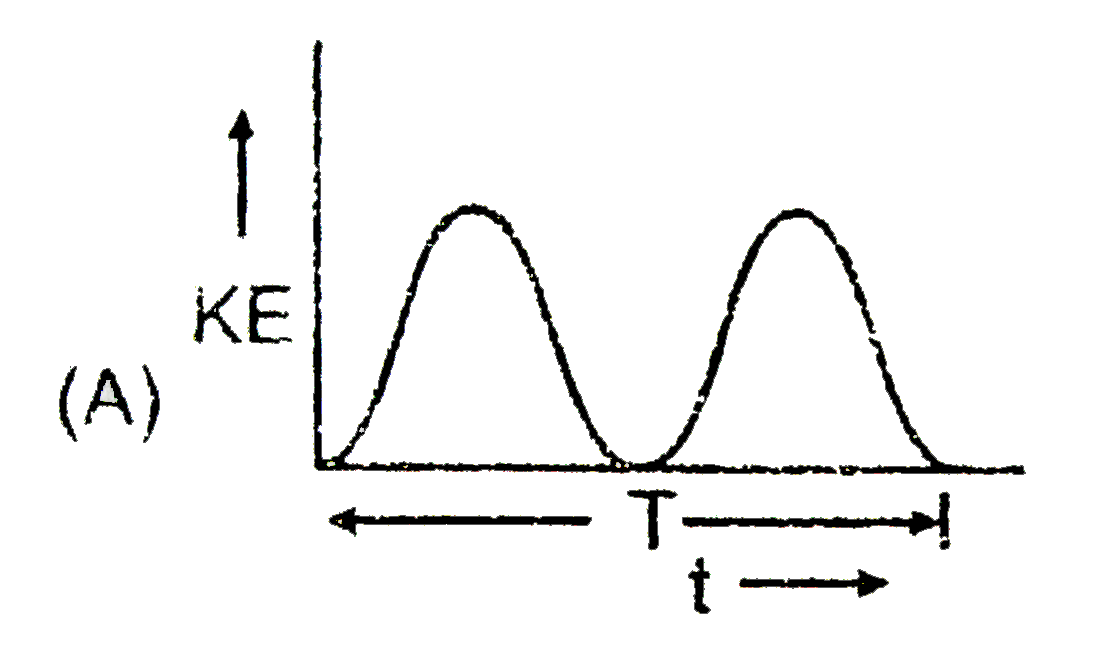 B
B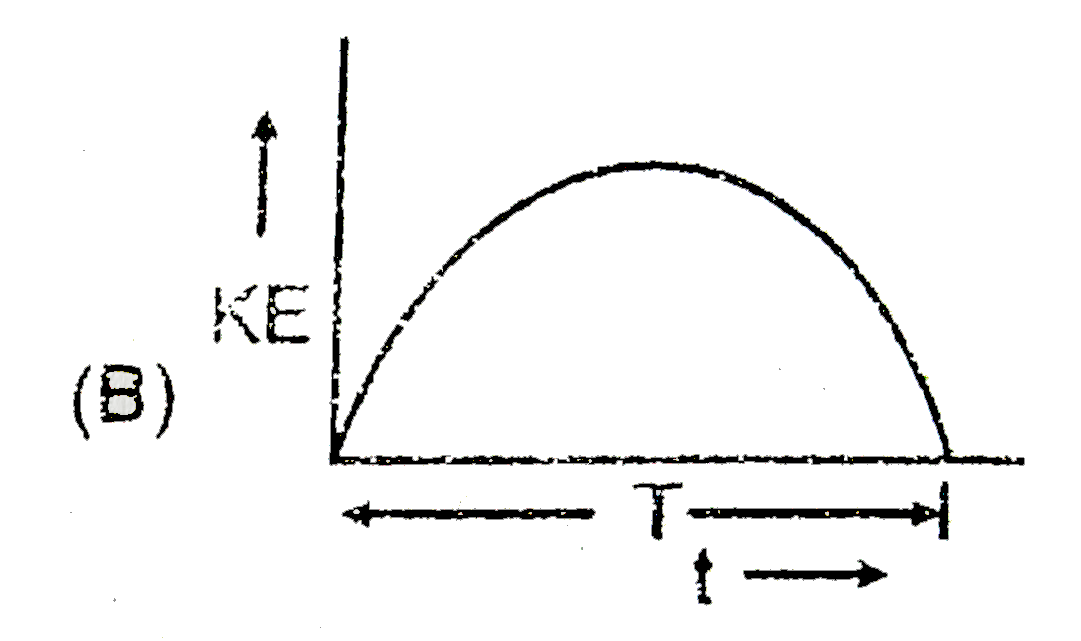 C
C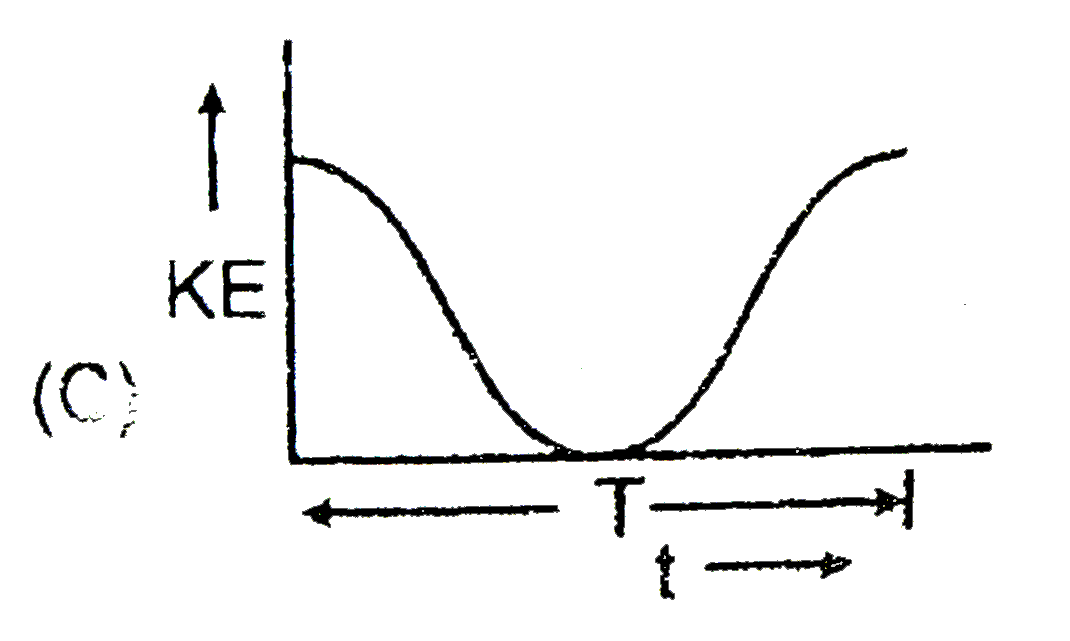 D
D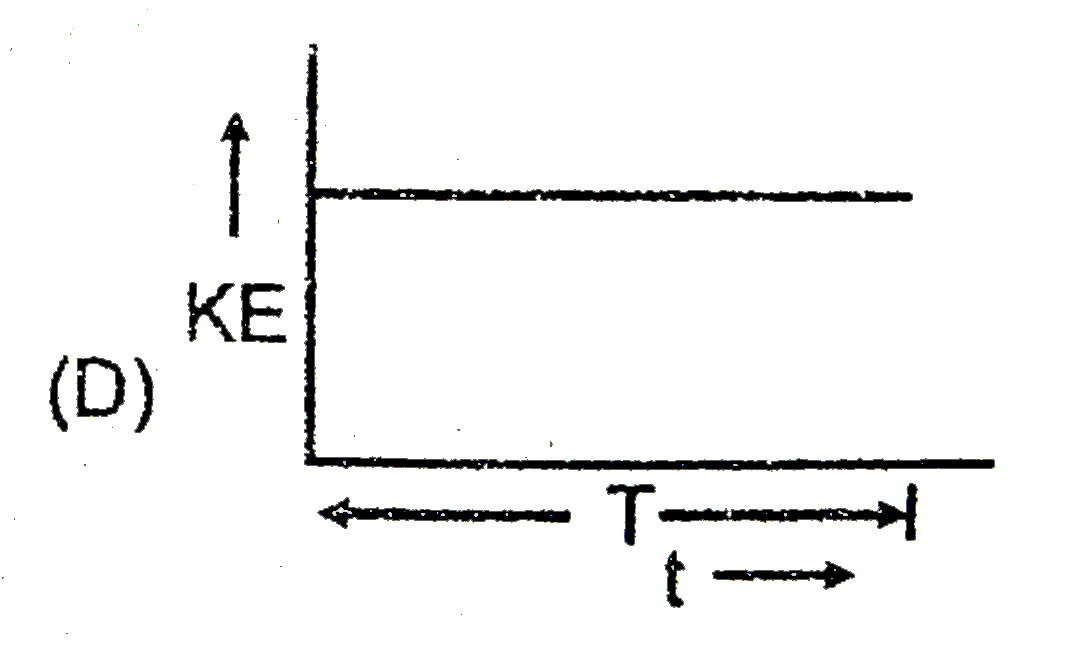
- Question 3 - Select One
Acceleration versus time graph of a body in SHM is given by a curve shown below. T is the time period. Then corresponding graph between kinetic energy KE and time t is correctly represented by
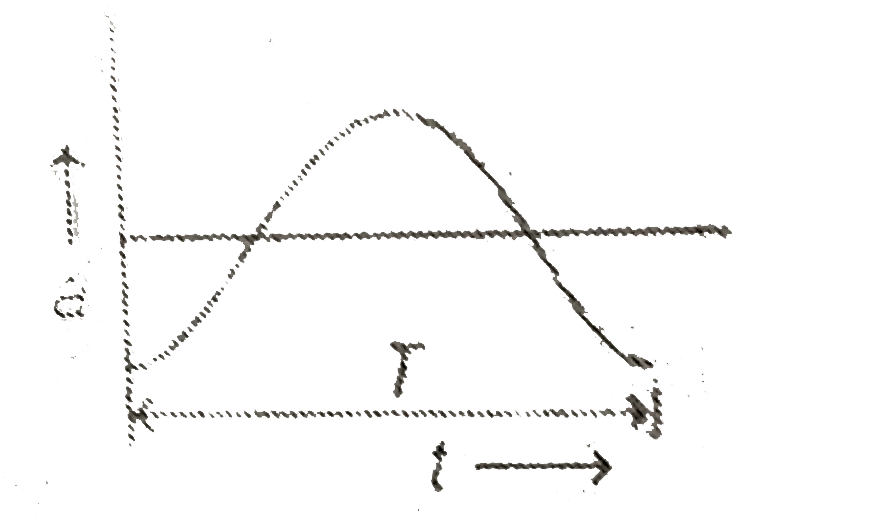 A
A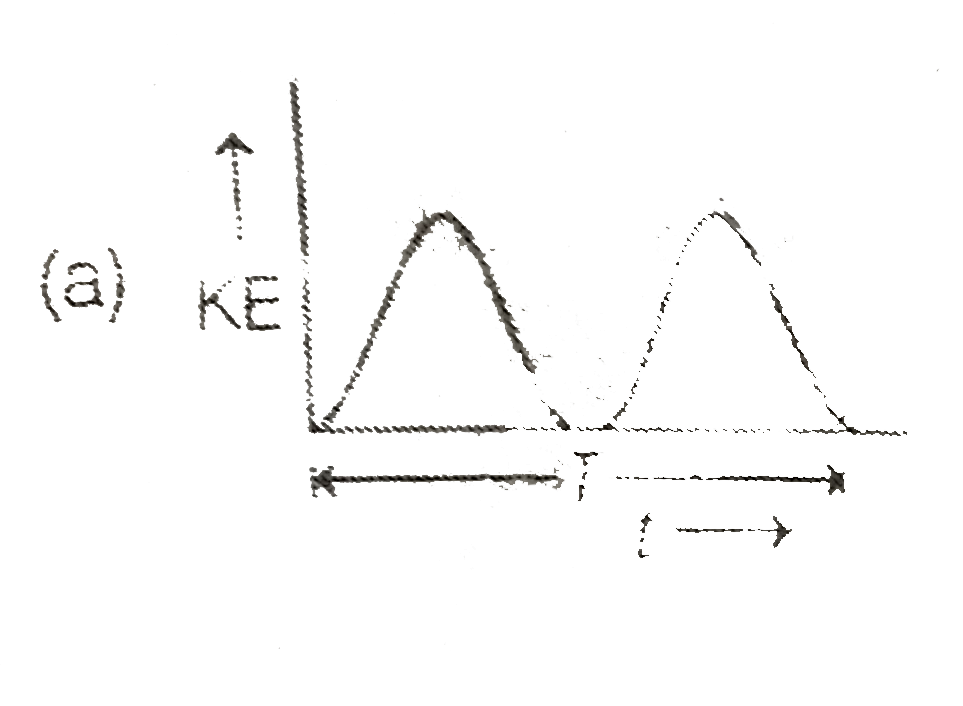 B
B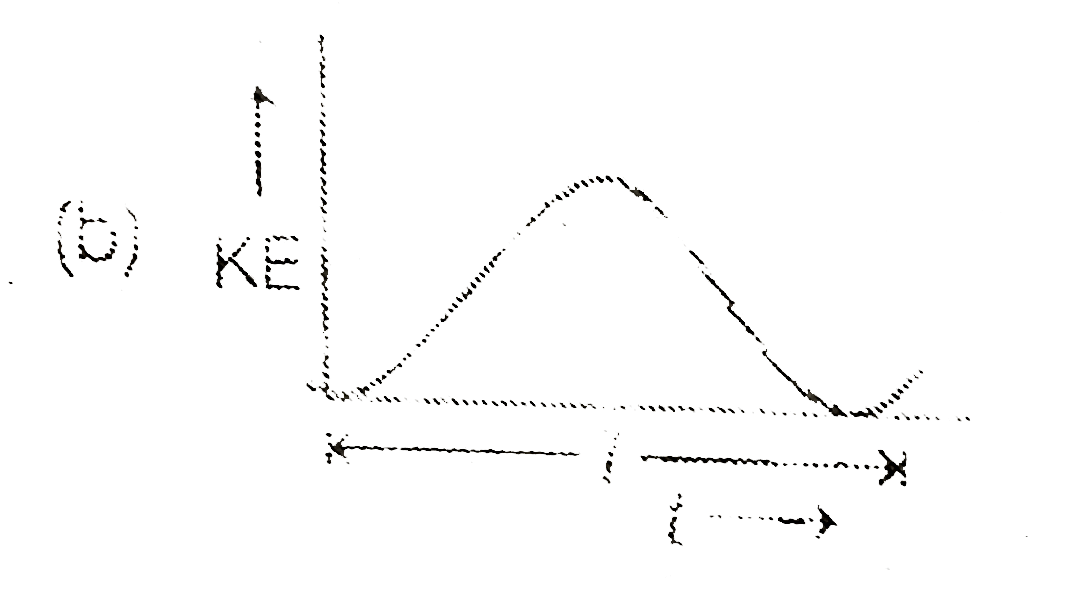 C
C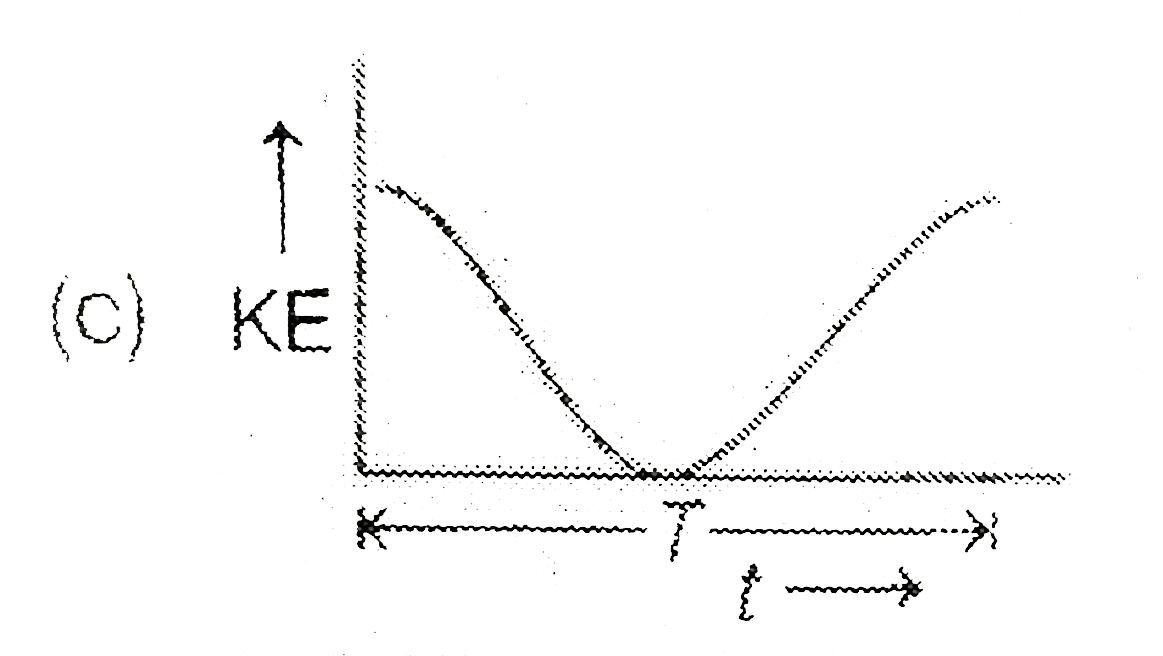 D
D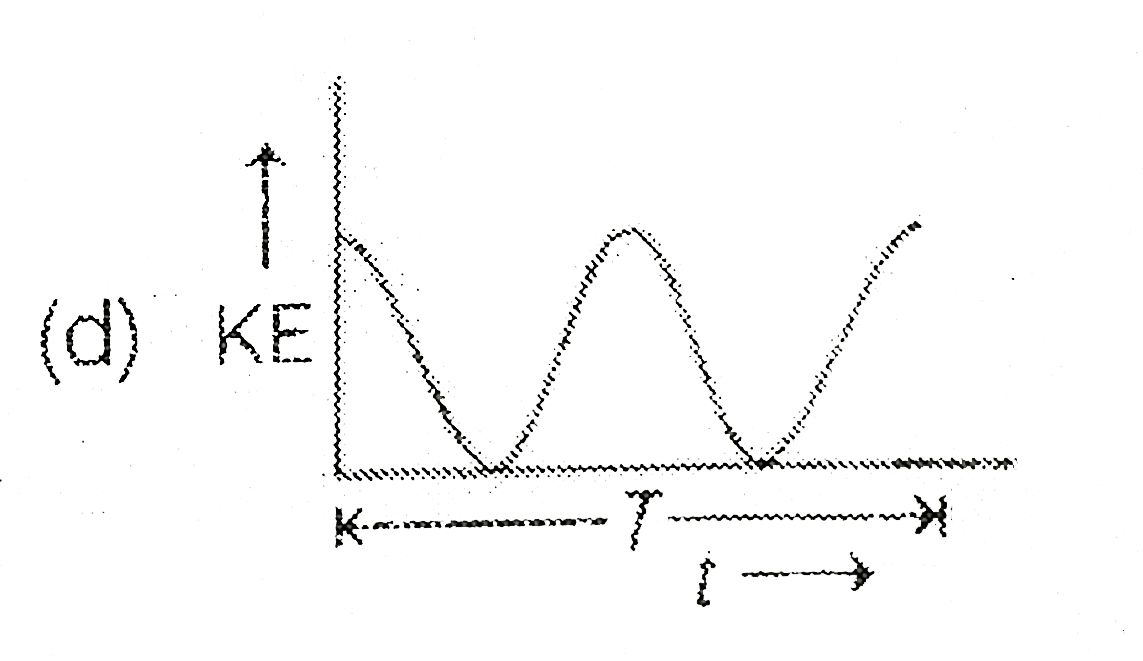
If a body is realeased from the top of a tower, the graph between distance (x) and time (t) is correctly shown by
View SolutionIf p and E represent linear momentum and kinetic energy respectively, then the graph between E and pis correctly shown by
View SolutionThe graph between L and T is correctly shown by
View SolutionThe kinetic energy of rolling body is
View SolutionThe x-t graph of a particle moving along a straight line is shown in figure
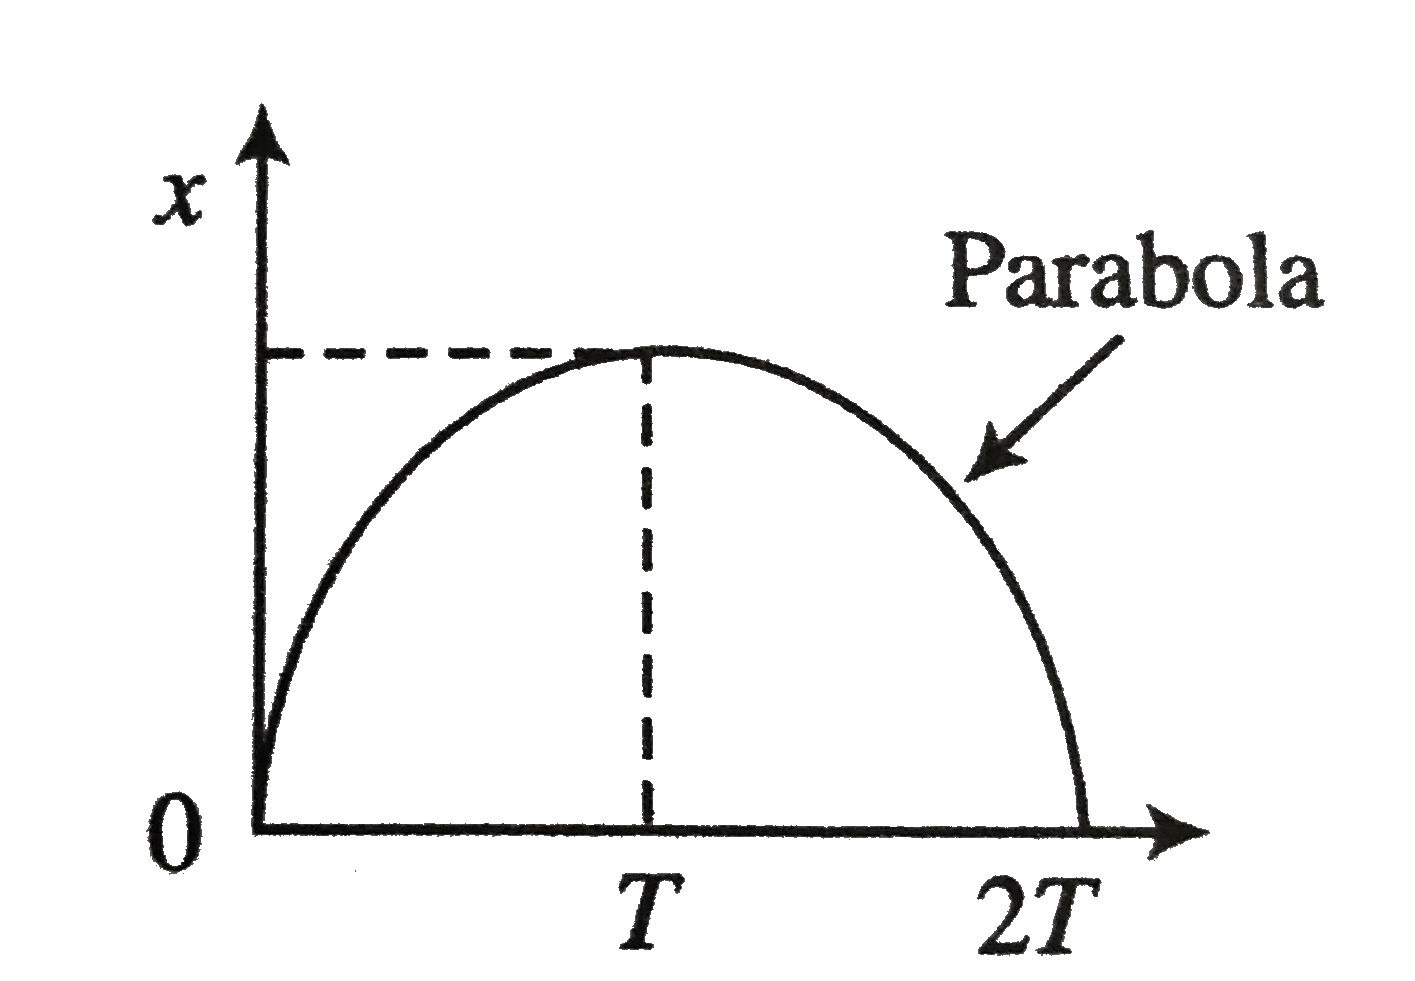
The speed-time graph of the particle is correctly shown byView Solution


