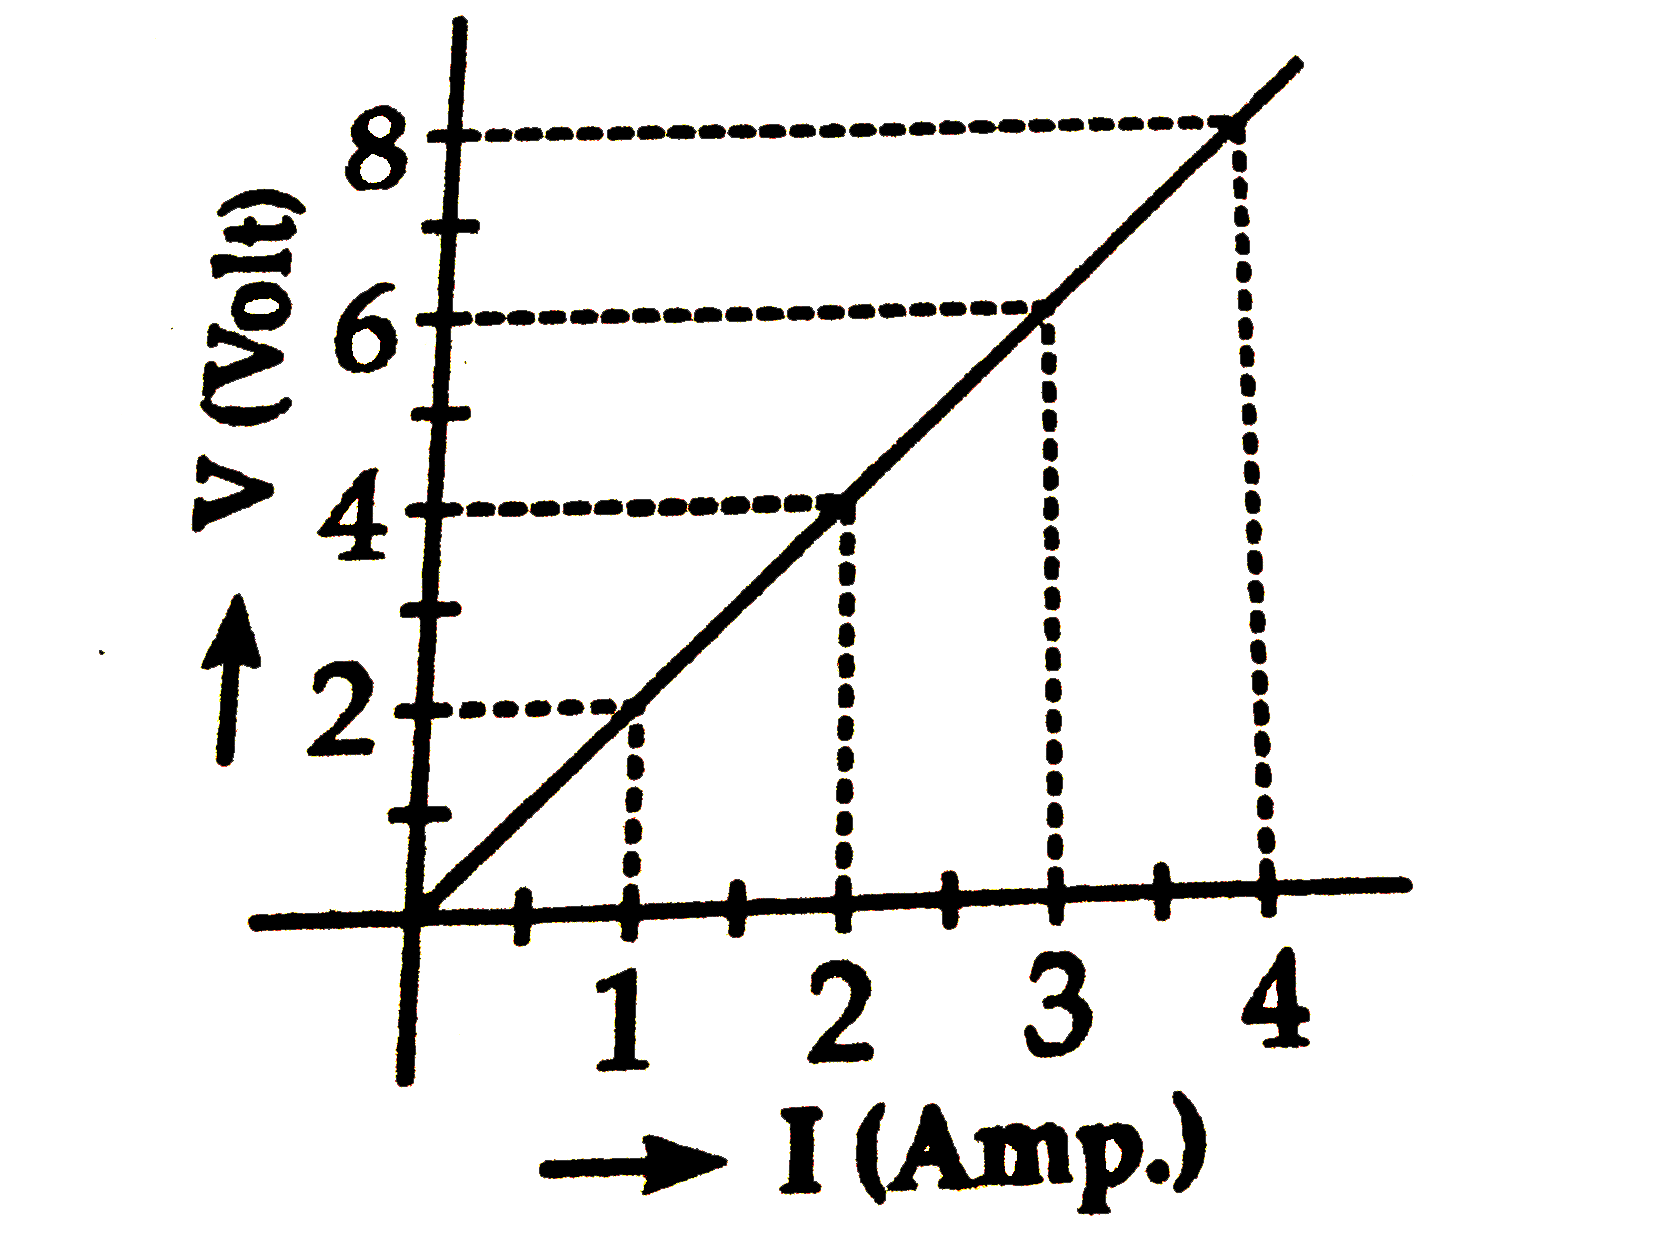
The V-I graph for a good conductor makes angle 42∘ with V-axis. Here V denotes voltage and I denotes current. Then the resistance of the conductor will be
sin42∘
cos42∘
tan42∘
cot42∘
The correct Answer is:D
To find the resistance of the conductor based on the given information about the V-I graph, we can follow these steps:
1. Understanding the V-I Graph:
The V-I graph for a good conductor is linear, which means that the relationship between voltage (V) and current (I) is direct. The angle made with the V-axis is given as 42∘.
2. Finding the Slope of the Graph:
The slope (m) of the V-I graph is defined as the ratio of current (I) to voltage (V):
m=IV
The slope can also be expressed in terms of the angle θ that the line makes with the V-axis:
m=tan(42∘)
3. Using the Slope to Find Resistance:
According to Ohm's Law, the resistance (R) is given by:
R=VI
We can rearrange the equation for the slope:
IV=tan(42∘)⟹VI=1tan(42∘)
Therefore, the resistance can be expressed as:
R=1tan(42∘)
4. Calculating the Resistance:
To find the numerical value of the resistance, we need to calculate tan(42∘). Using a calculator:
tan(42∘)≈0.9004
Thus,
R≈10.9004≈1.11Ω
Final Answer:
The resistance of the conductor is approximately 1.11Ω.
---
The V-I graph for a good conductor is linear, which means that the relationship between voltage (V) and current (I) is direct. The angle made with the V-axis is given as 42∘.
The slope (m) of the V-I graph is defined as the ratio of current (I) to voltage (V):
m=IV
The slope can also be expressed in terms of the angle θ that the line makes with the V-axis:
m=tan(42∘)
According to Ohm's Law, the resistance (R) is given by:
R=VI
We can rearrange the equation for the slope:
IV=tan(42∘)⟹VI=1tan(42∘)
Therefore, the resistance can be expressed as:
R=1tan(42∘)
To find the numerical value of the resistance, we need to calculate tan(42∘). Using a calculator:
tan(42∘)≈0.9004
Thus,
R≈10.9004≈1.11Ω
The resistance of the conductor is approximately 1.11Ω.
Topper's Solved these Questions
Similar Questions
Knowledge Check
- Question 1 - Select One
The V-I graph for a good conductor makes angle 40∘ with V-axis. Here, V denotes voltage and I denotes current. The resistance of the conductor will be
Asin40∘Bcos40∘Ctan40∘Dcot40∘ - Question 2 - Select One
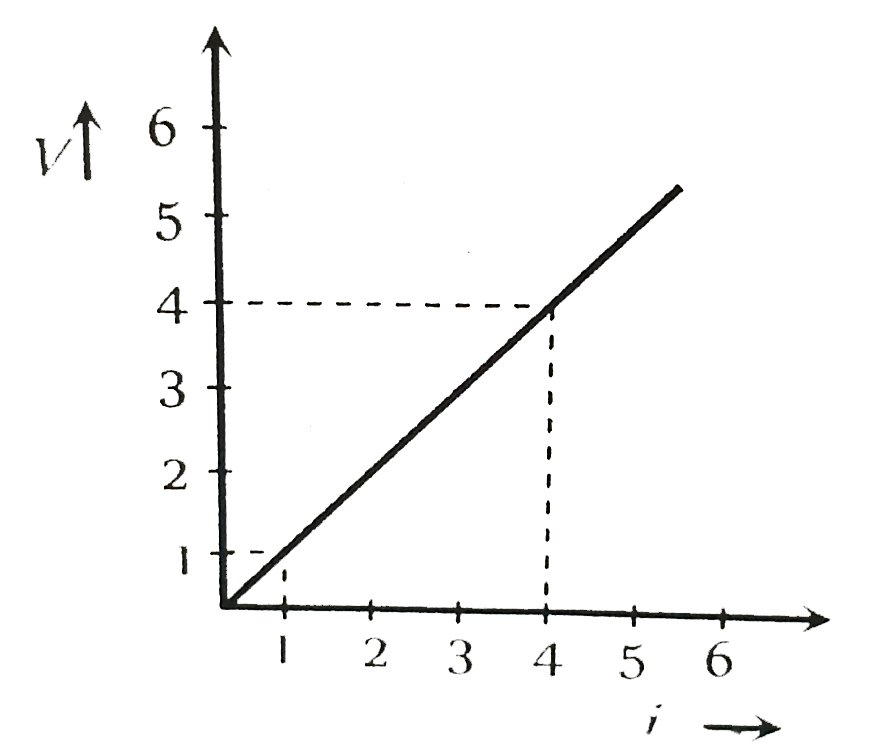
Variation of current and voltage in a conductor has been shown in the diagram below. The resistance of the conductor is.
 A4 ohmB2 ohmC3 ohmD1 ohm
 - Question 3 - Select One
Assertion : Current versus potential difference (i-V) graph for a conductor at two different temperatures T1 and T2 is shown in figure. Hence T1>T2.
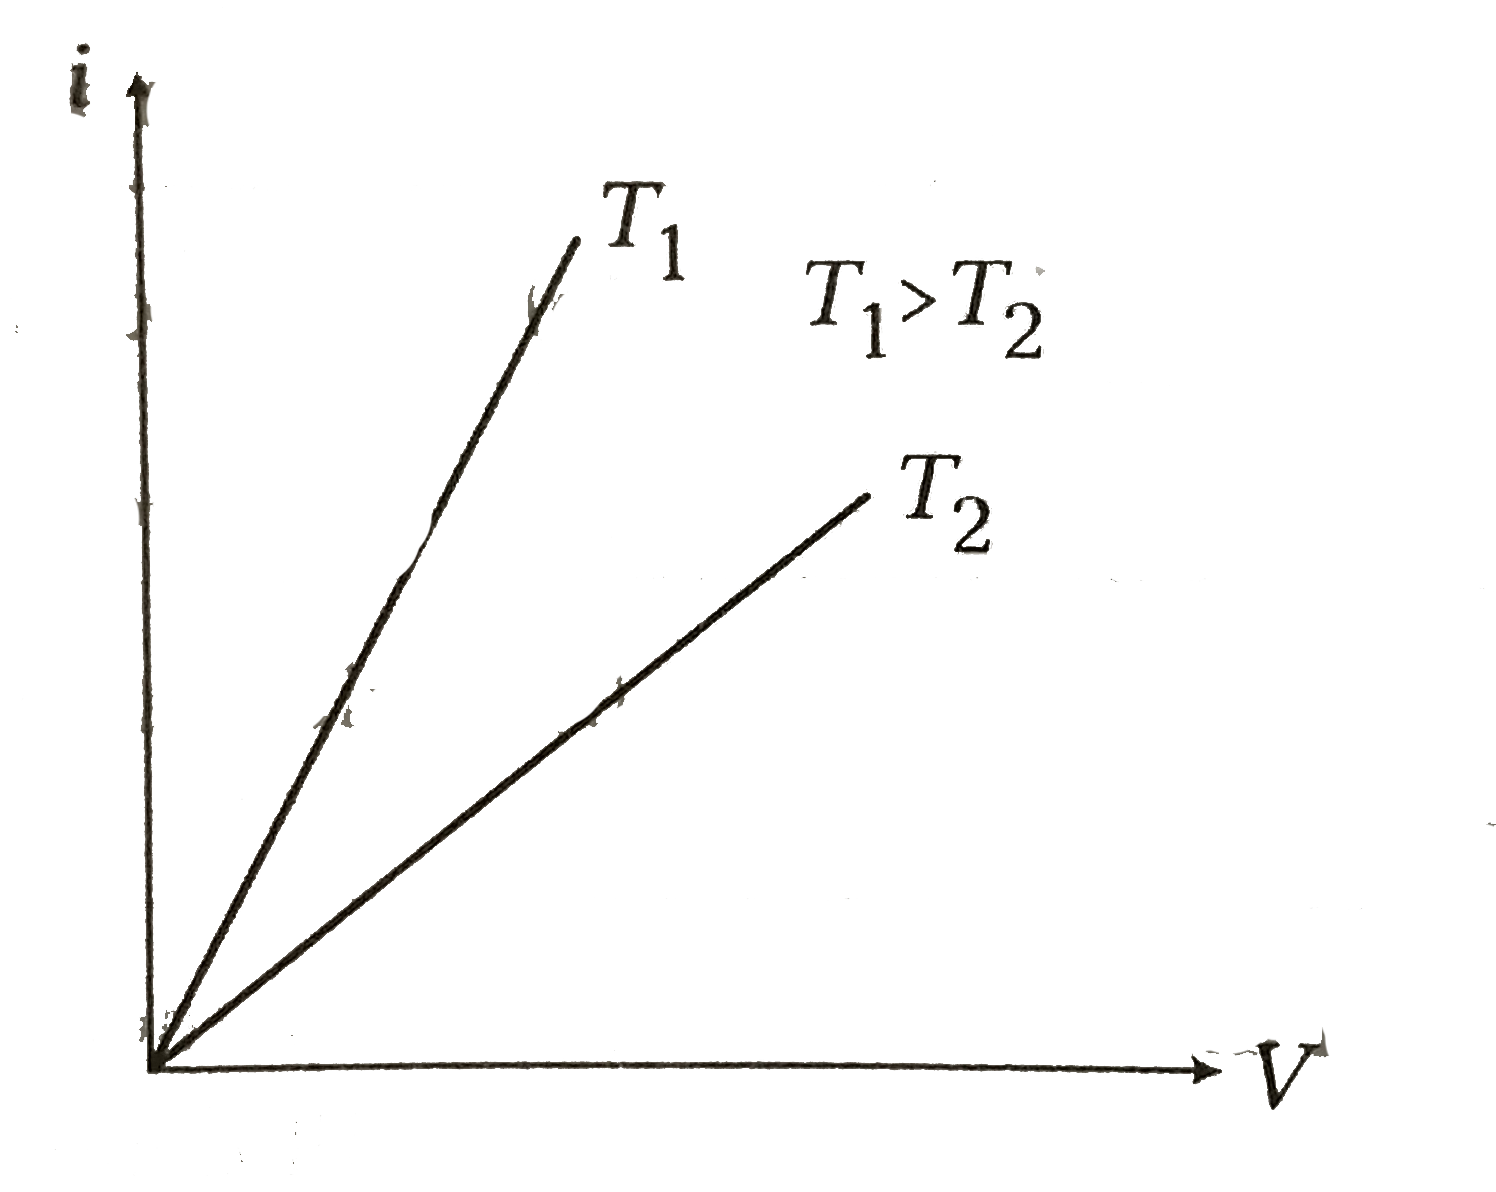
Reason : Resistance of a conductor increases with rise in temperature.AIf both Assertion and Reason are true and Reason is the correct explanation of Assertion.BIf both Assertion and Reason are true and Reason is not correct explanation of Assertion.CIf Assertion is true but Reason is false.DIf Assertion is false but Reason is true.
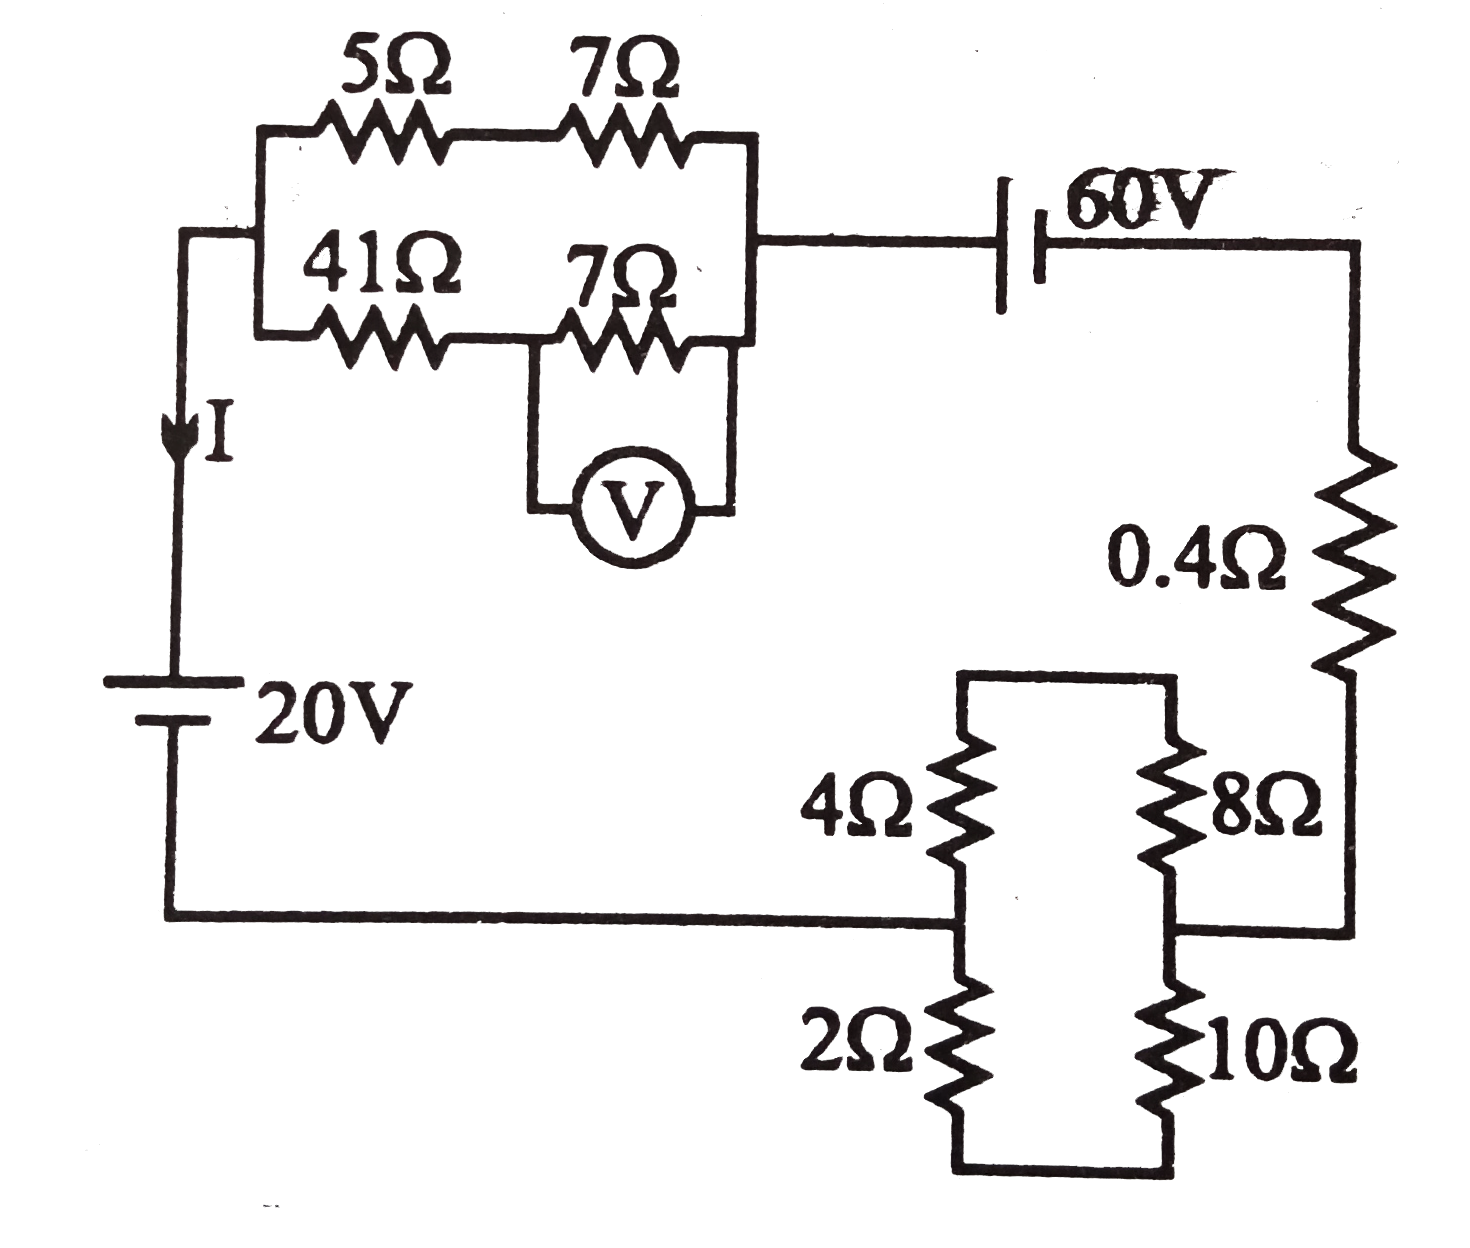
Find the current I & voltage V in the circuit shown.
 View Solution
Find the current I & voltage V in the circuit shown.
 View Solution
The slope of voltage (V) versus current (I) is called
 View Solution
The V - I graphs for a conductor at temperature T1andT2 are shown in the figure (T2−T1) is proportional to
 View Solution
Which of the following I-V characteristic represent the characteristic of a Ohmic conductor?
View Solution


