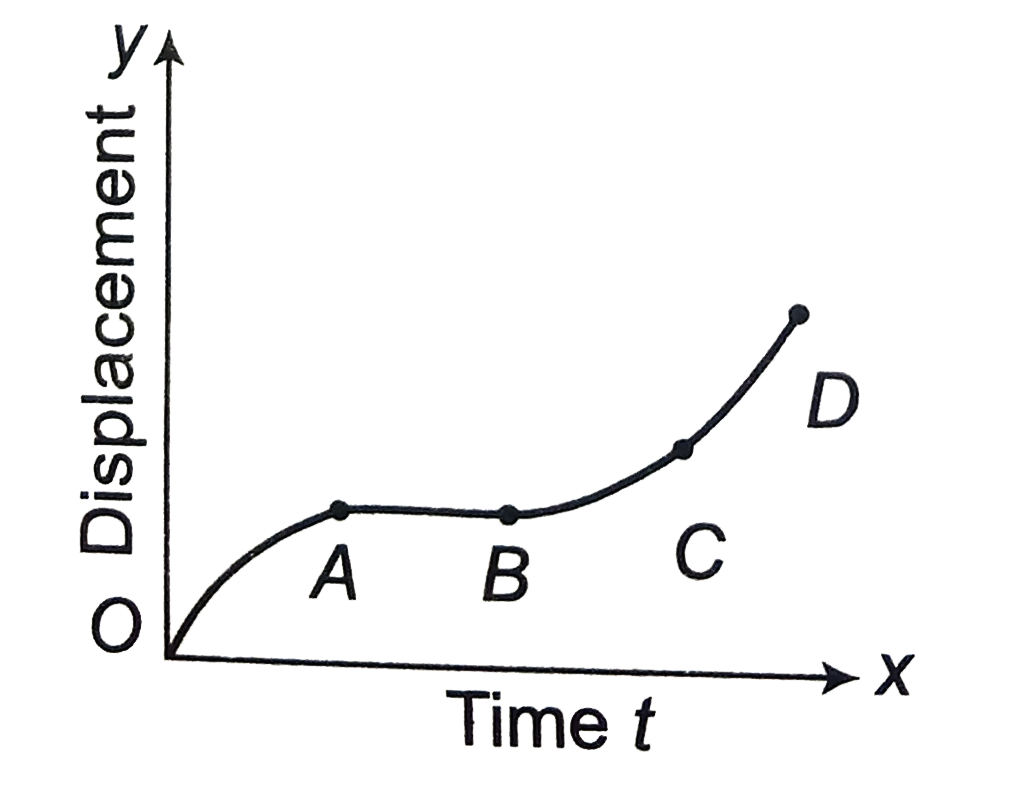
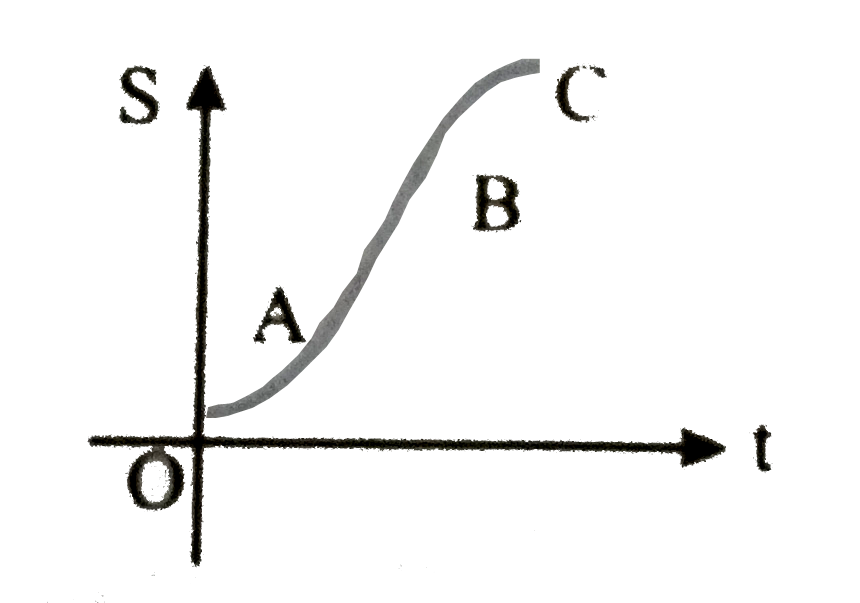
The graph between the displacement x and time t for a particle moving in a straight line is shown in the figure. During the interval OA,AB,BC and CD the acceleration of the particle is
OA,AB,BC,CD
OAABBCCD+0++
OAABBCCD−0+0
OAABBCCD+0−+
OAABBCCD−0−0
The correct Answer is:B
In portion OA, slope of graph is decreaging,so velocity is decreasing and acceleration is negative. In portion AB, displacement is constant, v= 0 and a = 0. In portion BC, slope of x-t is increasing, hence v is increasing and accelerations is positive. In portion CD, slope is constant, v=const. and a=0.
Topper's Solved these Questions
- MISCELLANEOUS QUESTIONSBOOK - MCGROW HILL PUBLICATIONCHAPTER - MISCELLANEOUS QUESTIONSEXERCISE - PART-B
99 Videos
- MEASUREMENTBOOK - MCGROW HILL PUBLICATIONCHAPTER - MEASUREMENTEXERCISE - ELEMENTARY QUESTIONS (HIGHER ORDER THINKING QUESTIONS)
13 Videos
- MOTIONBOOK - MCGROW HILL PUBLICATIONCHAPTER - MOTIONEXERCISE - HIGHER ORDER THINKING QUESTIONS
48 Videos
Similar Questions
Knowledge Check
Displacement time graph of a particle moving in a straight line is a shown in figure.
 Ain region A acceleration is positiveBin region B acceleration is negativeCin region C acceleration is positiveDin region D acceleration is negative
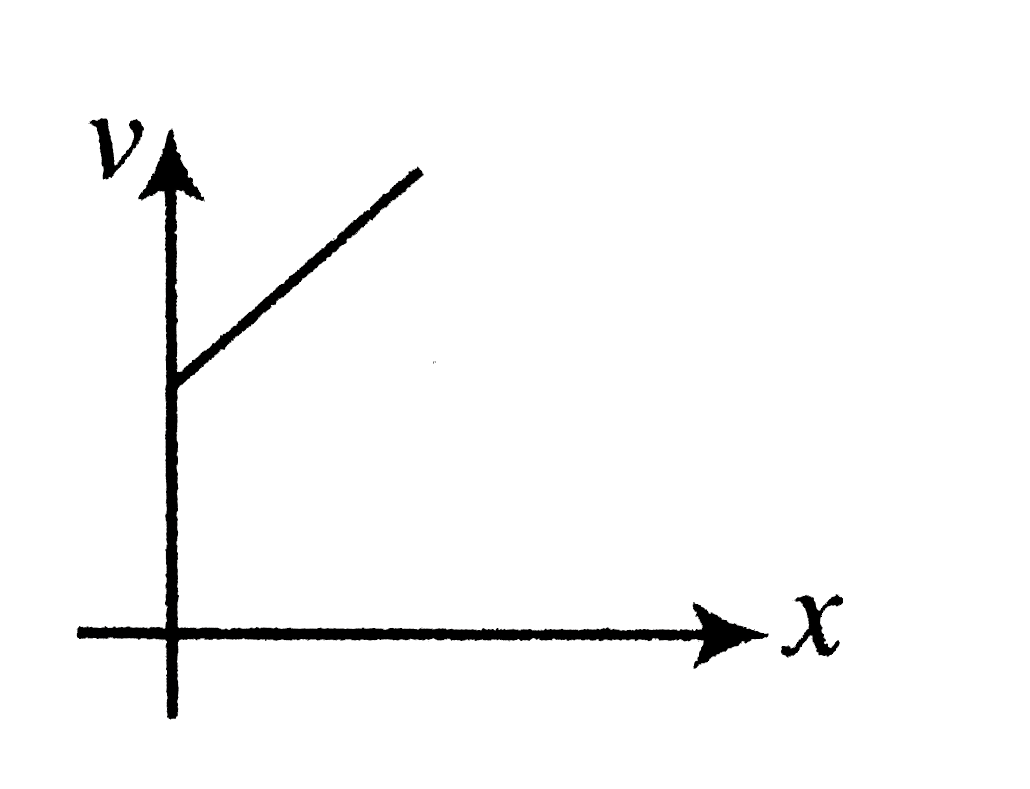
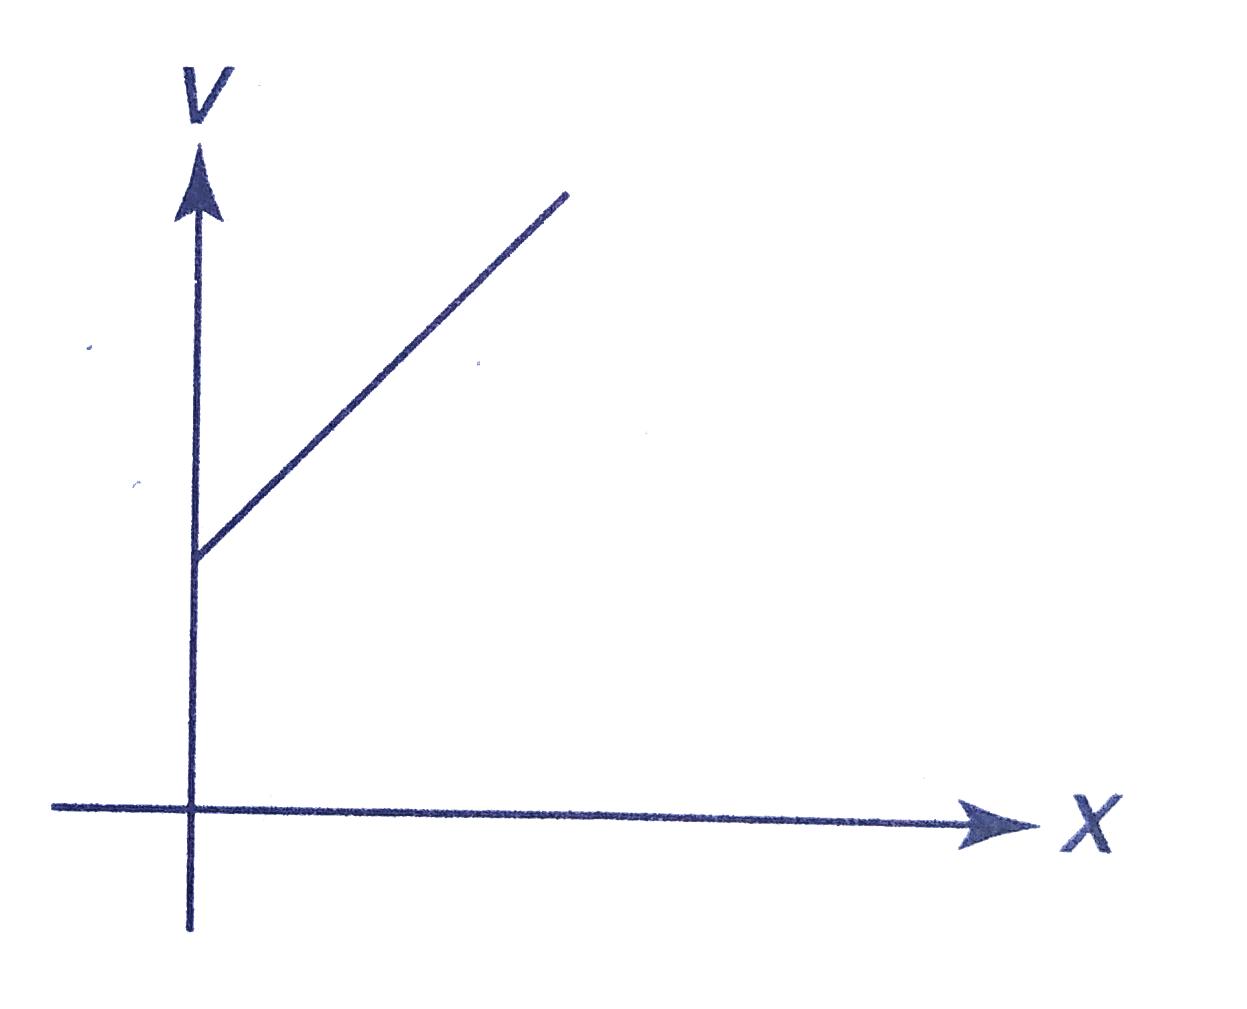
Velocity displacement graph of a particle moving in a straight line is as shown in figure.
 Amagnitude of acceleration of particle is decreasingBmagnitude of acceleration of particlre is increasingCacceleration versus displacement graph straight lineDacceleration versus displacement graph is parabola
The v-x graph for a particle moving along a straight line is shown in the figure. At which of the points marked, the acceleration is negative?
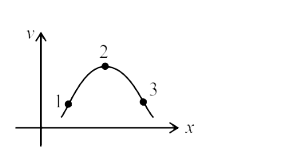 A1B3C1 and 2D3 and 2
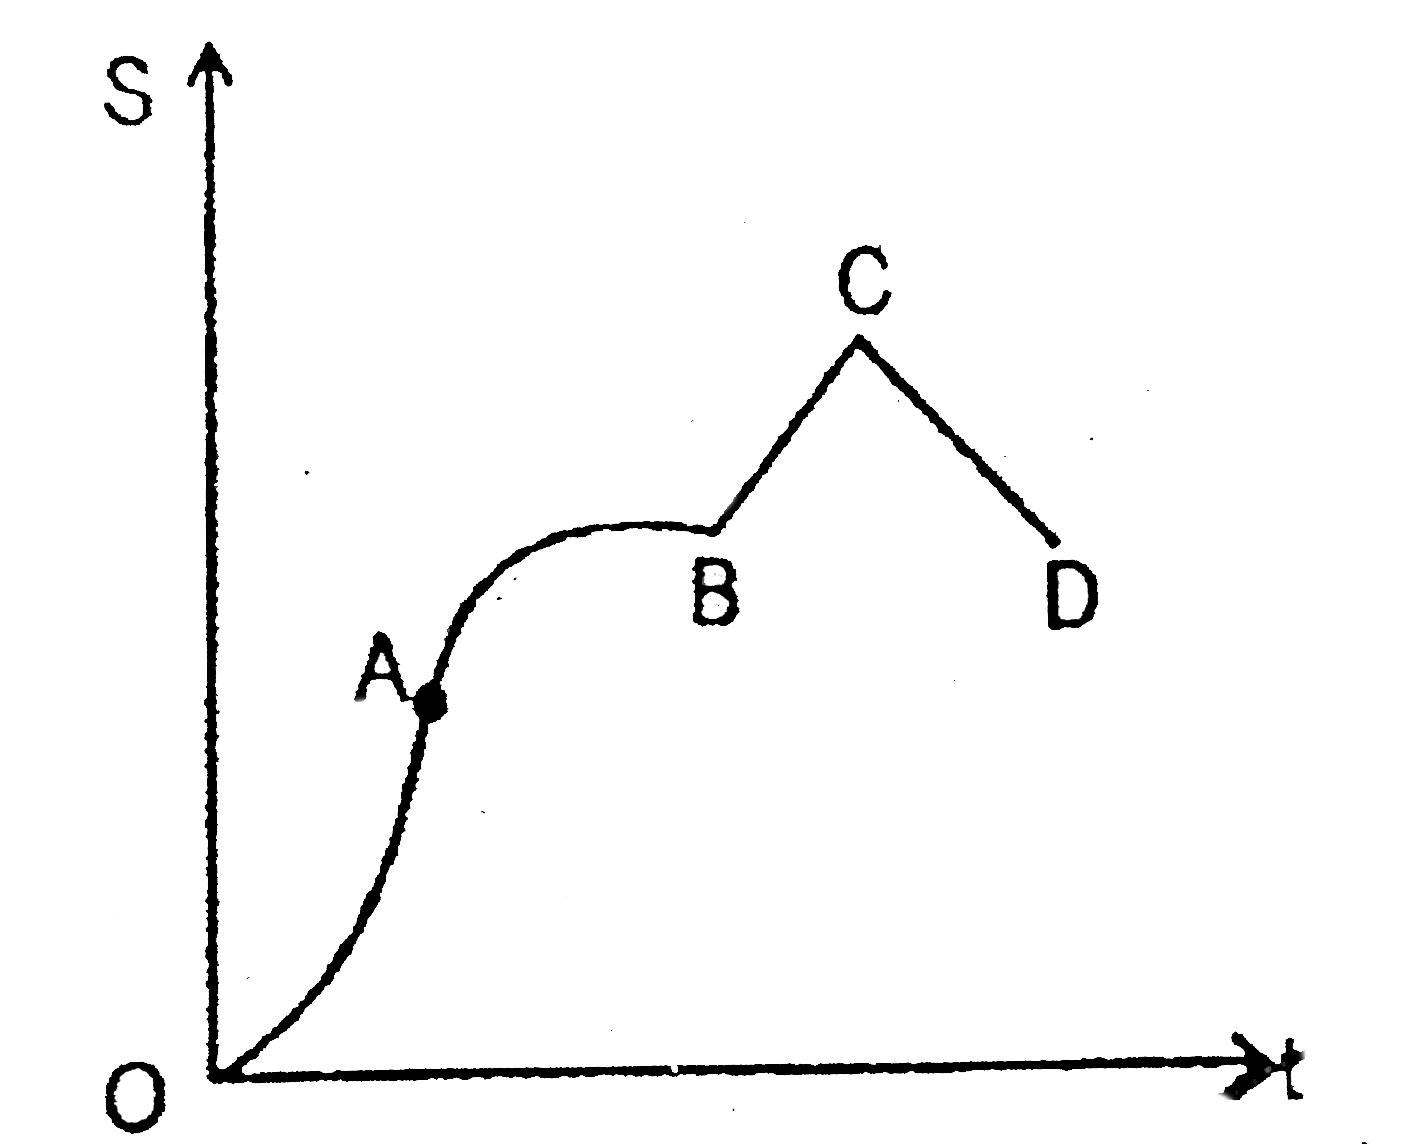
Displacment-time graph of a particle moving in a straight line is as shown in figure. Choose the INCORRECT statement(s)
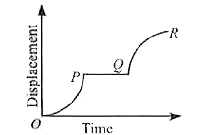
View SolutionThe displacement time graph of a particle moving along a straight line is shown. The accelerations of the particle during the regions OP, PQ and QR are
View SolutionGraph of velocity versus displacement of a particle moving in a straight line is as shown in figure.
The acceleration of the particle is.
View SolutionDisplacement-time graph of a particle moving in a straight line is as shown in figure.
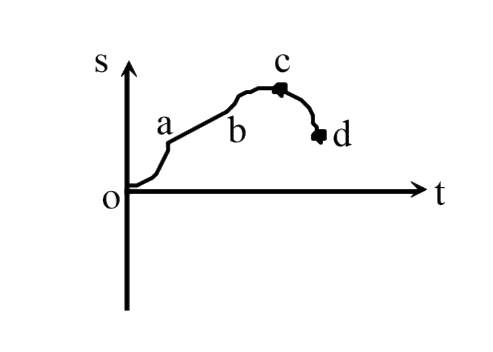
Q. Find the sign of acceleration in the above region
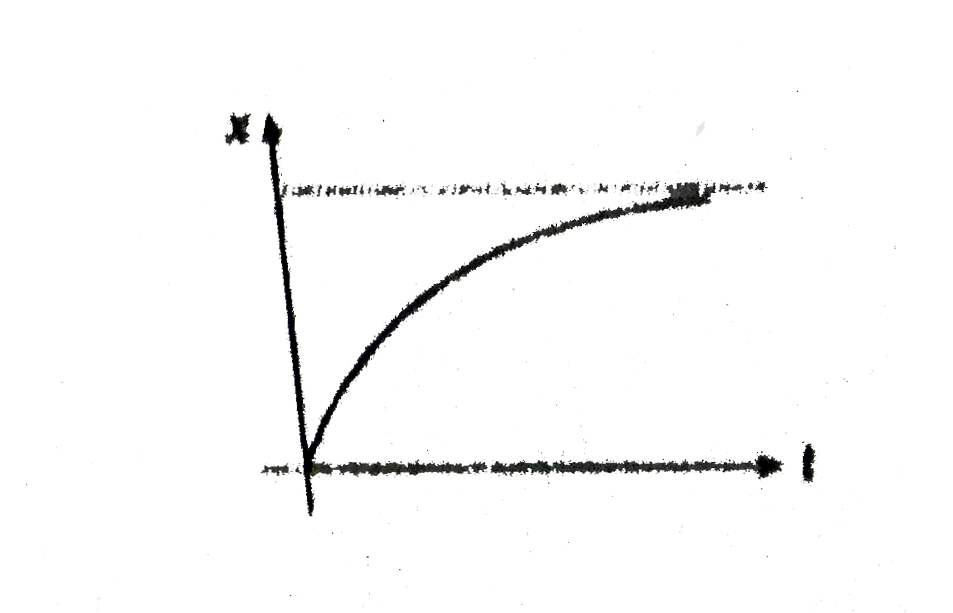
View SolutionVariation of displacement x of a particle moving on a straight line with time t is shown in following figure. The figure indicates :
View Solution

 .
.