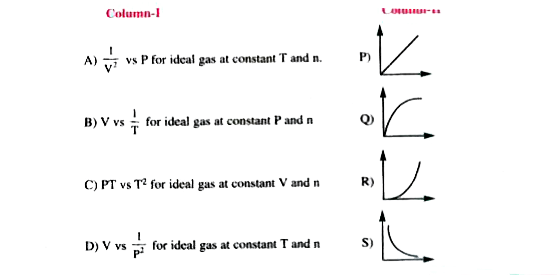
Which of the following correctly represent the behaviour of an ideal gasSolution in Telugu
PVm∝T
PM∝dT
P∝CT
PVm∝CT
The correct Answer is:A, B, C
For ideal gas , PV=nRT⇒PVm∝T
P=CRT⇒P∝CT,PM=dRT⇒PM∝dT .
Topper's Solved these Questions
- BOOK - AAKASH SERIESCHAPTER - STATES OF MATTEREXERCISE - LECTURE SHEET - EXERCISE - I (LEVEL - II ADVANCED)(LINKED COMPREHENSION TYPES QUESTIONS)3videos
STATES OF MATTER
- BOOK - AAKASH SERIESCHAPTER - STATES OF MATTEREXERCISE - LECTURE SHEET - EXERCISE - I (LEVEL - II ADVANCED)(MATRIX MATCHING TYPE QUESTIONS)1videos
STATES OF MATTER
- BOOK - AAKASH SERIESCHAPTER - STATES OF MATTEREXERCISE - LECTURE SHEET - EXERCISE - I (LEVEL - II ADVANCED)(STRAIGHT OBJECTIVE TYPES QUESTIONS)11videos
STATES OF MATTER
- BOOK - AAKASH SERIESCHAPTER - SATURATED HYDROCARBONSEXERCISE - QUESTIONS FOR DESCRIPTIVE ANSWERS10videos
SATURATED HYDROCARBONS
- BOOK - AAKASH SERIESCHAPTER - STOICHIOMETRYEXERCISE - QUESTIONS FOR DESCRIPTIVE ANSWERS59videos
STOICHIOMETRY
Similar Questions
A 10 cm column of air is trapped by a column of mercury, 8 cm long, in a capillary tube horizontally fixed as shown below, at 1 atm pressure. When the tube is held at certain angle θ∘ with open end up, the weight of Hg is borne partially by the gas. Vertical Height of Hg is a measure of additional pressure on gas.
 The length of air column, when the tube is fixed vertically at the same temperature with open end up is . View Solution
 View Solution
How much should the pressure be increased in order to decrease the volume of a gas by 5% at constant temperature
02:29View SolutionWhy boiling and melting points of hydrocarbons are low ?
03:58View SolutionDistinguish between element and compound?
04:23View SolutionWhich of the following graphs is consistent with ideal gas behaviour?
View SolutionThe graph that does represent the behaviour of an ideal gas is :
View SolutionWhich of the following graphs represent the behaviour of an ideal gas ?
02:29View SolutionWhich of the following diagram correctly describes the behaviour of a fixed mass of an ideal gas ? (T is measured in K)
View SolutionWhich one of the following graphs correctly gives the ideal gas behaviour ?
01:58View SolutionWhich of the following diagrams correctly describes behaviour of a fixed mass of an ideal gas? (T is measured in K)
01:42View SolutionWhich one of the following graphs represents the behaviour of an ideal gas.
01:41View SolutionWhich of the following graphs represent the behaviour of an ideal gas ?
03:52View SolutionWhich of the following graphs represent the behaviour of an ideal gas ?
05:54View SolutionWhich of the following diagram correctly describes the behaviour of a fixed mass of an ideal gas ? ( T is measured in K ) .
05:16View Solution

