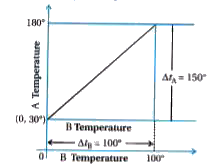
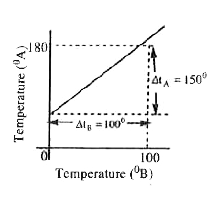
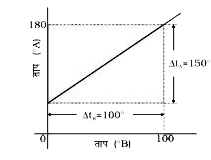
The graph between two temperature scales A and B is shown in figure. Between upper fixed point and lower fixed point there are 150 equal division on A and 100 on scale B. The relationship for conversion between the two scales is given by
 Solution in Gujrati
tA−180100=tB150
tA−30150=tB100
TB−180150=tA100
tB−40100=tA180
The correct Answer is:B
From graph, least point on scale A is 30∘C and peak point is 180∘. For scale B, least point is 0∘ and peak point is 100∘.
∴ Relation for conversion of temperature of two scales,
tA−A least point on ANo. of marks on A=tB−B least point on BNo. of marks on B
tA−30150=tB−0100
∴tA−30150=tB100
Topper's Solved these Questions
- BOOK - KUMAR PRAKASHANCHAPTER - THERMAL PROPERTIES OF MATTEREXERCISE - Section - D NCERT Exemplar Solution (Multiple Choice Questions MCQs) More than one options1videos
THERMAL PROPERTIES OF MATTER
- BOOK - KUMAR PRAKASHANCHAPTER - THERMAL PROPERTIES OF MATTEREXERCISE - Section - D NCERT Exemplar Solution (Very Short Answer Type Questions )5videos
THERMAL PROPERTIES OF MATTER
- BOOK - KUMAR PRAKASHANCHAPTER - THERMAL PROPERTIES OF MATTEREXERCISE - Section - C Objective Questions (VSQs) Assertion and Reason Type Questions5videos
THERMAL PROPERTIES OF MATTER
- BOOK - KUMAR PRAKASHANCHAPTER - SYSTEMS OF PARTICLES AND ROTATIONAL MOTIONEXERCISE - SECTION-F (SECTION-D) QUESTIONS PAPER1videos
SYSTEMS OF PARTICLES AND ROTATIONAL MOTION
- BOOK - KUMAR PRAKASHANCHAPTER - THERMODYANMICS EXERCISE - Question Paper11videos
THERMODYANMICS
Similar Questions
Mark the correct options :
02:17View SolutionIs the bulb of a thermometer made of diathermic or adiabatic wall ?
02:56View SolutionAssertion : Good absorbers of radiation are weak emitters.
Reason : Ratoi of emissivity and absorptivity is constant for all substances at any temperature for same wavelength radiation.02:34View SolutionA rope of negligible mass is wound round a hollow cylinder of mass 3 kg and radius 40 cm. What is the angular acceleration of the cylinder if the rope is pulled with a force of 30 N? What is the linear acceleration of the rope? Assume that there is no slipping.
02:18View SolutionWhy is a steam burn more damaging than a burn with boiling water of the same ?
03:14View SolutionThe graph between two temperature scales A and B is shown in Fig. Between upper fixed point and lower fixed point there are 150 equal divisions on scales A and 100 on scale B. The relation between the temperature in two scales is given by_
_S01_001_Q01.png) 03:09View Solution
03:09View SolutionA faulty thermometer has its lower fixed point marked as 110^(@) and upper fixed point marked as 110^(@) and upper fixed point marked as 110^(@) . If the temperature of the body shown in this scale is 62^(@) , the temperature shown on the Celsius scale is
02:40View SolutionThe relationship between the two scales of temperature A and B. (A-42)/110 = (B-72)/220 | At what temperature will the two scales have equal readings?
01:56View Solutionफॉरेनहाइट स्केल का निम्न नियत बिन्दु तथा ऊपरी नियत बिन्दु होता है
01:56View SolutionWhat are two fixed points on a temperature scale?
03:44View SolutionThe graph between two temperature scales A and B is shown in Fig. Between upper fixed point and lower fixed point there are 150 equal divisions on scales A and 100 on scale B. The relation between the temperature in two scales is given by_
_S01_001_Q01.png) 04:36View Solution
04:36View SolutionPassage - I: The graph between two temperature scales A and B is as shown in fig. Between upper fixed and lower fixed points there are 150 equal divisions on scale A and 100 on scale B. Lower fixed point on scale B and scale A.
03:04View SolutionPassage - I: The graph between two temperature scales A and B is as shown in fig. Between upper fixed and lower fixed points there are 150 equal divisions on scale A and 100 on scale B. The relation between two scales A and B is given by
02:11View SolutionThe graph between two temperature scales A and B is shown in Fig. 11.1 Between upper fixed point and lower fixed point there
 01:59View Solution
चित्र 11.1 में दो तापक्रमों A तथा B के बीच ग्राफ दर्शाया गया है। स्केल A तथा B पर निम्न नियत तापांक तथा उच्च नियत तापांक के बीच क्रमशः 150 तथा 100 समान भाग है|
दोनों स्केलों के बीच रूपांतरण के लिए दिया गया संबंध है -
 02:20View Solution

