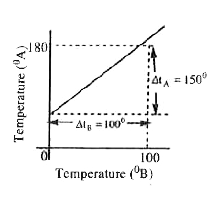
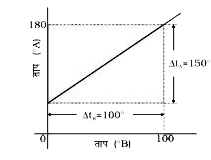
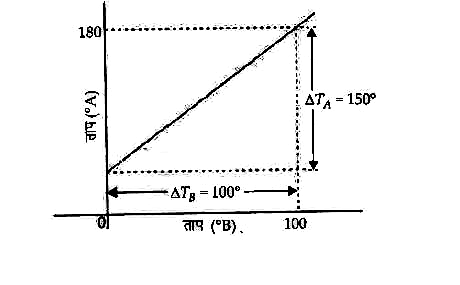
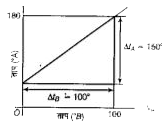
The graph between two temperature scales A and B is shown in Fig. 11.1 Between upper fixed point and lower fixed point there
 Solution in Telugu
The correct Answer is:B
Step by step video, text & image solution for The graph between two temperature scales A and B is shown in Fig. 11.1 Between upper fixed point and lower fixed point there by Physics experts to help you in doubts & scoring excellent marks in Class 11 exams.
Updated on:21/07/2023Similar Questions
Passage - I: The graph between two temperature scales A and B is as shown in fig. Between upper fixed and lower fixed points there are 150 equal divisions on scale A and 100 on scale B. The relation between two scales A and B is given by
View Solutionचित्र 11.1 में दो तापक्रमों A तथा B के बीच ग्राफ दर्शाया गया है। स्केल A तथा B पर निम्न नियत तापांक तथा उच्च नियत तापांक के बीच क्रमशः 150 तथा 100 समान भाग है|
दोनों स्केलों के बीच रूपांतरण के लिए दिया गया संबंध है -

View SolutionMention different scales of temperature, mentioning their lower and upper fixed points, Establish a relation between them.
View Solutionदो ताप पैमाने A एवं B के मध्य ग्राफ को चित्र में दिखाया गया है। ऊपरी स्थिर बिन्दु एवं निचले स्थिर बिन्दु के मध्य पैमाने A पर 150 समान भाग तथा पैमाने B पर 100 भाग हैं। दोनों पैमानों के मध्य परिवर्तन के लिए सम्बन्ध हैं -

View SolutionThe graph between two temperature scales A and B is shown in Fig. Between upper fixed point and lower fixed point there are 150 equal divisions on scales A and 100 on scale B . The relation between the temperature in two scales is given by_
View SolutionWhat are the lower and upper fixing points in Celsius and Fahrenheit scales ?
View Solutionचित्र में दो तापमान पैमानों A व B के मध्य ग्राफ दर्शाया गया है। निम्न नियत ताप तथा उच्च नियत ताप के मध्य क्रमश 150 तथा 100 समान भाग है । दोनों पैमानों के मध्य रुअंतरण सम्बन्ध होगा

View Solution
