Passage - I:
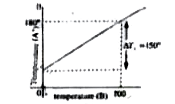
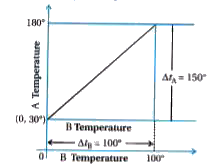
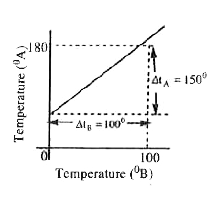
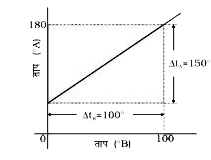
The graph between two temperature scales A and B is as shown in fig. Between upper fixed and lower fixed points there are 150 equal divisions on scale A and 100 on scale B.

Lower fixed point on scale B and scale A.Solution in Telugu
30∘.0∘
0∘,30∘
30∘,27∘
27∘,30∘
The correct Answer is:A
Step by step video, text & image solution for Passage - I: The graph between two temperature scales A and B is as shown in fig. Between upper fixed and lower fixed points there are 150 equal divisions on scale A and 100 on scale B. Lower fixed point on scale B and scale A. by Physics experts to help you in doubts & scoring excellent marks in Class 11 exams.
Updated on:21/07/2023Topper's Solved these Questions
- THERMAL PROPERTIES OF MATTERBOOK - AAKASH SERIESCHAPTER - THERMAL PROPERTIES OF MATTEREXERCISE - THERMOMETRY (LECTURE SHEET) Matrix Matching Type Questions
2 Videos
- THERMAL PROPERTIES OF MATTERBOOK - AAKASH SERIESCHAPTER - THERMAL PROPERTIES OF MATTEREXERCISE - THERMOMETRY (LECTURE SHEET) Integer/Subjective Type Questions
3 Videos
- THERMAL PROPERTIES OF MATTERBOOK - AAKASH SERIESCHAPTER - THERMAL PROPERTIES OF MATTEREXERCISE - THERMOMETRY (LECTURE SHEET) More than One correct answer Type Questions
5 Videos
- SYSTEM OF PARTICLES AND ROTATIONAL MOTIONBOOK - AAKASH SERIESCHAPTER - SYSTEM OF PARTICLES AND ROTATIONAL MOTIONEXERCISE - PRACTICE EXERCISE
99 Videos
- THERMODYNAMICSBOOK - AAKASH SERIESCHAPTER - THERMODYNAMICSEXERCISE - EXERCISE - 3
33 Videos
Similar Questions
Match the following.
List-IList-IIThermometric substanceRangeA)AirP)−200∘to1500∘CB) HydrogenQ) Below−200∘CC) NitrogenR)−200∘Cto500∘CD) HeliumS) upto600∘C
View SolutionThe electrical resistance in ohms of a certain thermometer varies with temperature according to the approximate law:
R=R0[1+α(T−T0)]
The resistance is 101.6Ω at the triple-point of water 273.16K, and 165.5Ω at the normal melting point of lead (600.5K). What is the temperature when the resistance is 123.4Ω?
View SolutionIn which of the following pairs of temperature scales, the size of a degree is identical?
View SolutionThe centre of mass of two particles with masses 2kg and 6 kg located at (1,1,1), (2,2,1) respectively has the coordinates
View SolutionA bullet of mass 10×10−3 moving with a speed of 20ms−1 hits an ice block (0∘C) of 990g kept at rest on a frictionless floor and gets embedded in it. If ice takes 50% of K.E, the amount of ice melted (in grams) approximately is (J=4.2J/cal) (latent heat of ice=80cal/g)
View SolutionThe graph between two temperature scales A and B is shown in Fig. Between upper fixed point and lower fixed point there are 150 equal divisions on scales A and 100 on scale B. The relation between the temperature in two scales is given by_
_S01_001_Q01.png)
View SolutionA faulty thermometer has its lower fixed point marked as 110^(@) and upper fixed point marked as 110^(@) and upper fixed point marked as 110^(@) . If the temperature of the body shown in this scale is 62^(@) , the temperature shown on the Celsius scale is
View SolutionWhat is lower fixed point of kelvin scale?
View Solutionफॉरेनहाइट स्केल का निम्न नियत बिन्दु तथा ऊपरी नियत बिन्दु होता है
View SolutionThe graph between two temperature scales A and B is shown in figure. Between upper fixed point and lower fixed point there are 150 equal division on A and 100 on scale B. The relationship for conversion between the two scales is given by

View SolutionThe lower fixed point on the Celsius scale is _______
View SolutionThe graph between two temperature scales A and B is shown in Fig. Between upper fixed point and lower fixed point there are 150 equal divisions on scales A and 100 on scale B. The relation between the temperature in two scales is given by_
_S01_001_Q01.png)
View SolutionPassage - I: The graph between two temperature scales A and B is as shown in fig. Between upper fixed and lower fixed points there are 150 equal divisions on scale A and 100 on scale B. The relation between two scales A and B is given by
View SolutionThe graph between two temperature scales A and B is shown in Fig. 11.1 Between upper fixed point and lower fixed point there

View Solutionचित्र 11.1 में दो तापक्रमों A तथा B के बीच ग्राफ दर्शाया गया है। स्केल A तथा B पर निम्न नियत तापांक तथा उच्च नियत तापांक के बीच क्रमशः 150 तथा 100 समान भाग है|
दोनों स्केलों के बीच रूपांतरण के लिए दिया गया संबंध है -

View Solution
