Which of the following graph shows the variation in the value of 'g' with increasing distance from the centre of the earth. [Re = Radius of earth]
A

B

C

D

Text Solution
The correct Answer is:D
|
Topper's Solved these Questions
- GRAVITATIONBOOK - KUMAR PRAKASHANCHAPTER - GRAVITATIONEXERCISE - Section - F Questions from Module
20 Videos
- GRAVITATIONBOOK - KUMAR PRAKASHANCHAPTER - GRAVITATIONEXERCISE - QUESTIONS PAPER Section - A
6 Videos
- GRAVITATIONBOOK - KUMAR PRAKASHANCHAPTER - GRAVITATIONEXERCISE - Section - D NCERT Exemplar Solutions (Long Answer Type Question )
5 Videos
- LAW OF MOTIONBOOK - KUMAR PRAKASHANCHAPTER - LAW OF MOTIONEXERCISE - (QUESTION PAPER) SECTION-D
1 Videos
Similar Questions
Knowledge Check
Which of the following graphs shows the variation of acceleration due to gravity g with depth h from the surface of the earth ?
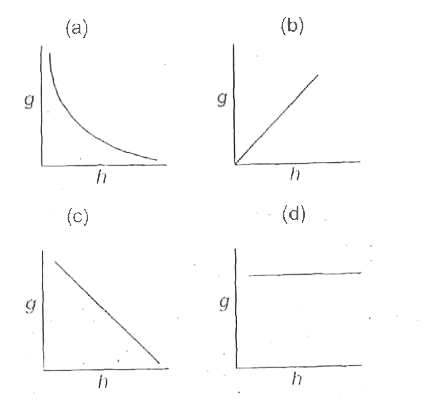 A(a)B(b)C(c )D(d)
The diagram showing the variation of gravitational potential of earth with distance from the centre of earth is
A B
B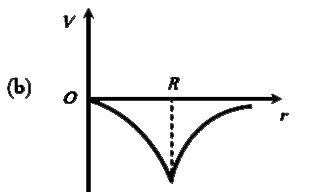 C
C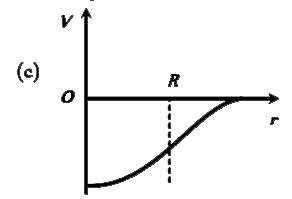 D
D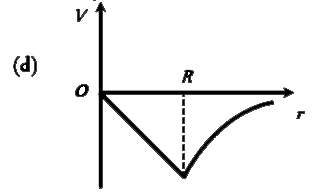
The diagram showing the variation of gravitational potential of earth with distance from the centre of earth is
A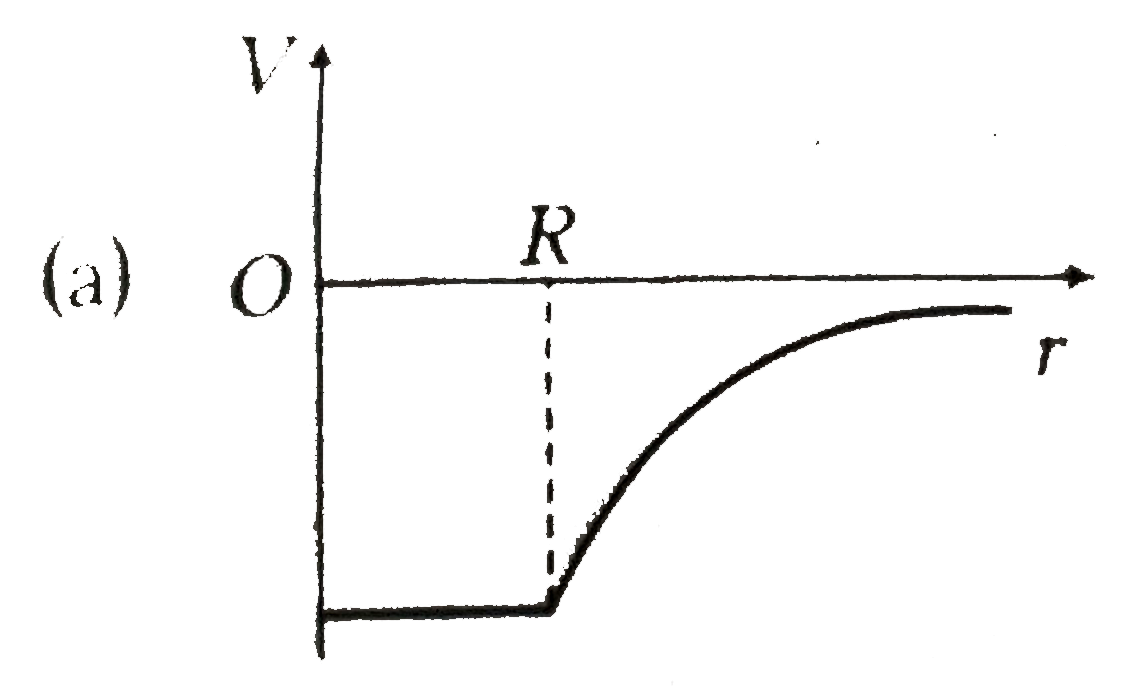 B
B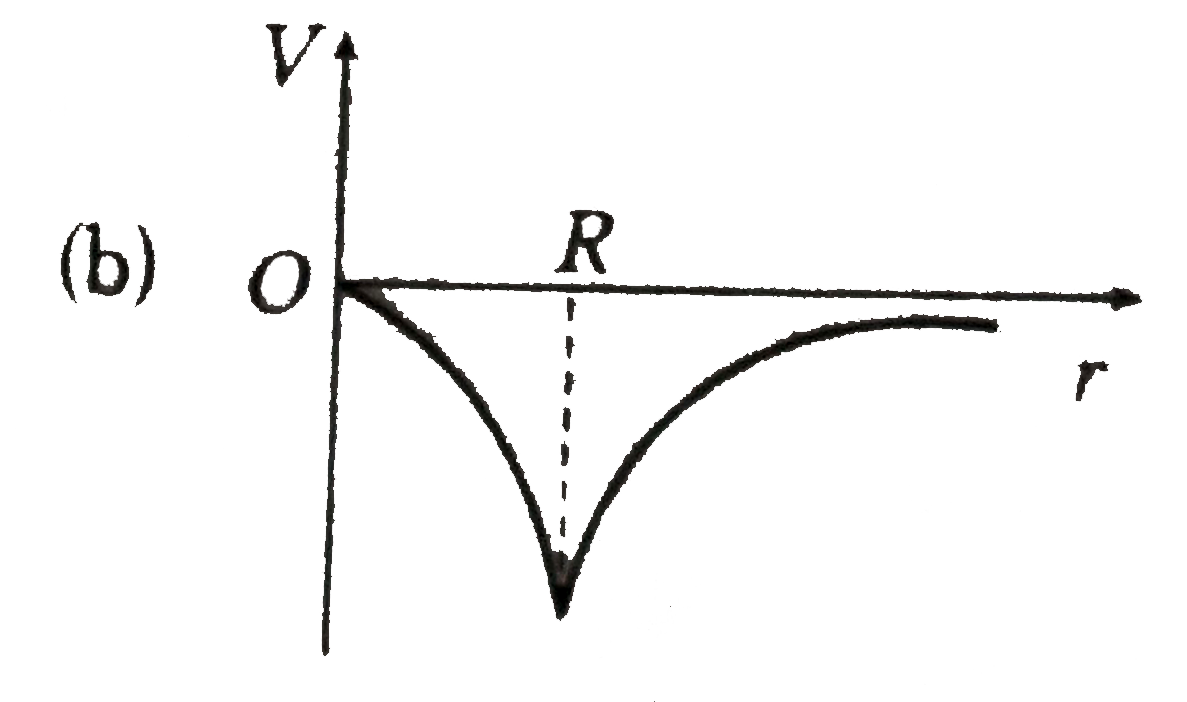 C
C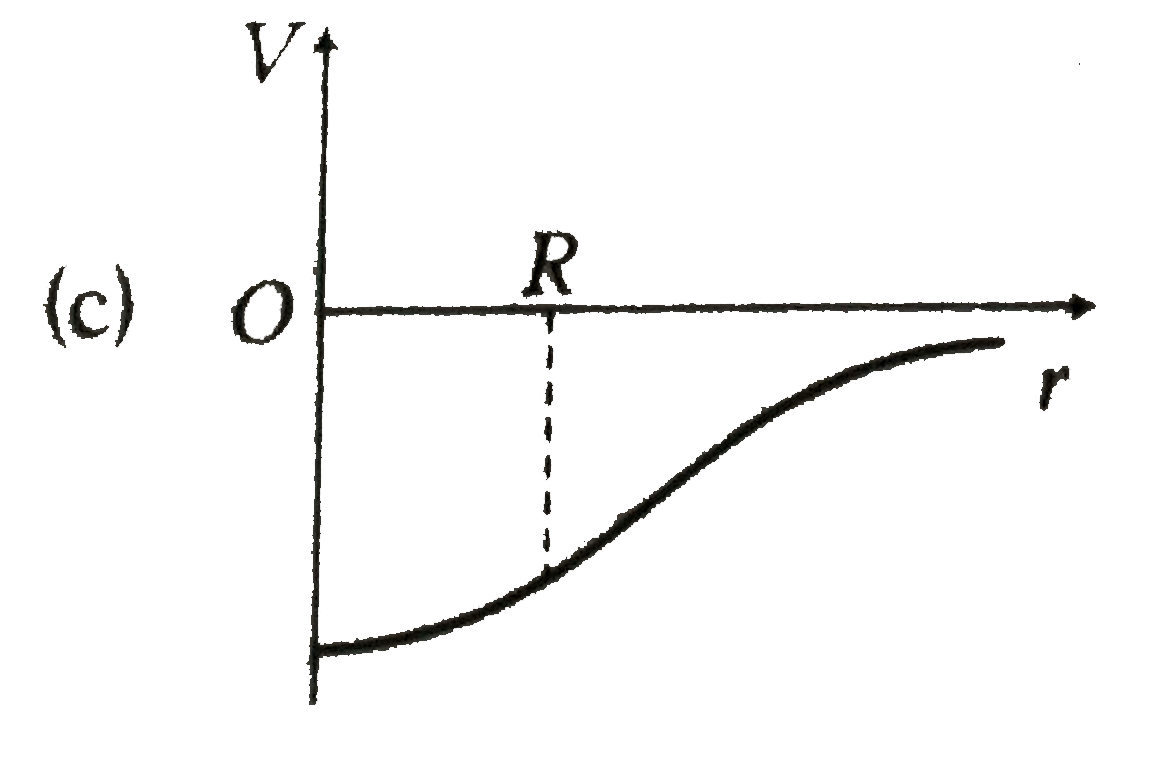 D
D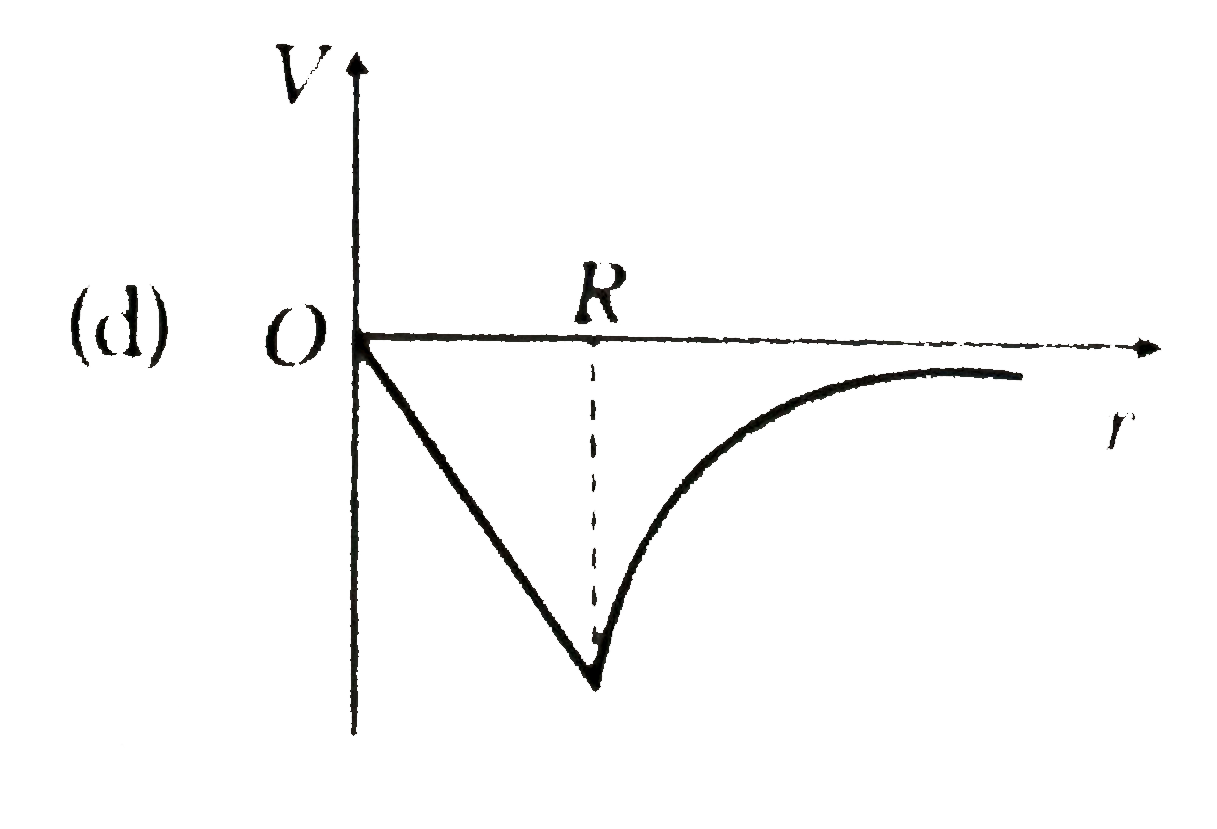
Which graph correctley presents the variation of acceleration due to gravity with the distance form the centre of the earth?
View SolutionWhich one of the following graphs represents the variation of electric field with distance r from the centre of a charged spherical conductor of radius R?
View SolutionWhich one of the following graphs represents the variation of electric field with distance r from the centre of a charged spherical conductor of radius R?
View SolutionWhich of the following graphs correctly represents the variation of g on the - Earth?
View SolutionWhich graph correctly presents the variation of acceleration due to gravity with the distance form the centre of the earth?
View Solution
