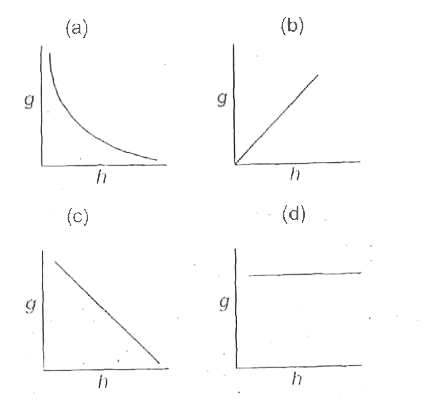
Starting from the centre of the earth having radius R, the variation of g (acceleration due to gravity) is shown by which one of the following graph ?


The correct Answer is:D
⇒ Inside the earth , g(GMeR3e)r(0<r≤Re)
∴g∝r (GMeRe) is constant )
outside earth g=GMer2 (r≥Re)
∴g∝1r2
These both situation is truly shown in graph (D)
Topper's Solved these Questions
- GRAVITATIONBook:KUMAR PRAKASHANChapter:GRAVITATIONExercise:Section - F Questions from Module
Explore 20 Videos
- GRAVITATIONBook:KUMAR PRAKASHANChapter:GRAVITATIONExercise:QUESTIONS PAPER Section - A
Explore 6 Videos
- GRAVITATIONBook:KUMAR PRAKASHANChapter:GRAVITATIONExercise:Section - D NCERT Exemplar Solutions (Long Answer Type Question )
Explore 5 Videos
- LAW OF MOTIONBook:KUMAR PRAKASHANChapter:LAW OF MOTIONExercise:(QUESTION PAPER) SECTION-D
Explore 1 Video
Similar Questions
Knowledge Check
One goes from the centre of the earth to a distance two third the radius of the earth. The acceleration due to gravity is highest at
Athe centre of the earthBa distance half the radius of the earthCa distance one-third of the radius of the earthDa distance two-third of the radius of the earthWhich of the following graphs shows the variation of acceleration due to gravity g with depth h from the surface of the earth ?
 A(a)B(b)C(c )D(d)
At what distance from the centre of the earth, the value of acceleration due to gravity g will be half that on the surface ( R = radius of earth)
A2RBRC1.414RD0.414R
Which of the following graphs shows the variation of acceleration due to gravity g with depth h from the surface of the earth ?

View SolutionIf g is acceleration due to gravity on the surface of the earth, having radius R, the height at which the acceleration due to gravity reduces to g/2 is
View SolutionObtain an expression for the acceleration due to gravity on the surface of the earth in terms of mass of the earth and its radius. Discuss the variation of acceleration due to gravity with altitude and depth. If a body is taken to a height R / 4 from the surface of the earth, find percentage decrease in the weight of the body ? Here R is the radius of the earth.
View SolutionIf g is acceleration due to gravity on the surface of the earth, having radius R, the height at which the acceleration due to gravity reduces to g/2 is
View SolutionThe satellite is moving round the earth (radius of earth = R) at a distance r from the centre of the earth. If g is the acceleration due to gravity on the surface of the earth. The acceleration of the satellite will be
View Solution
