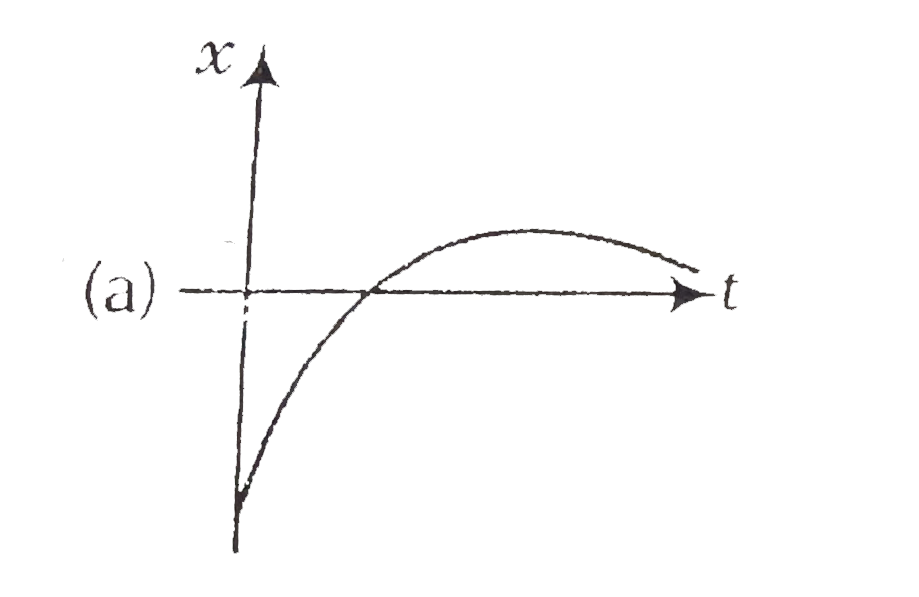
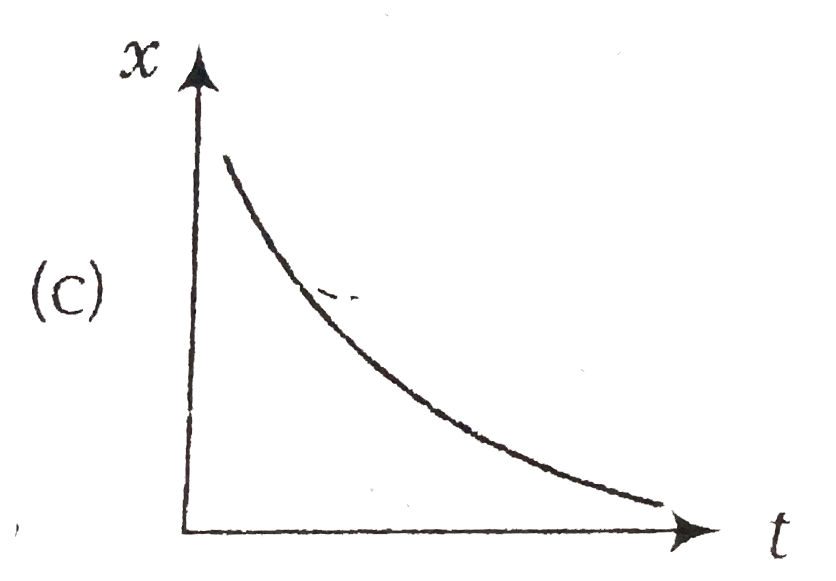
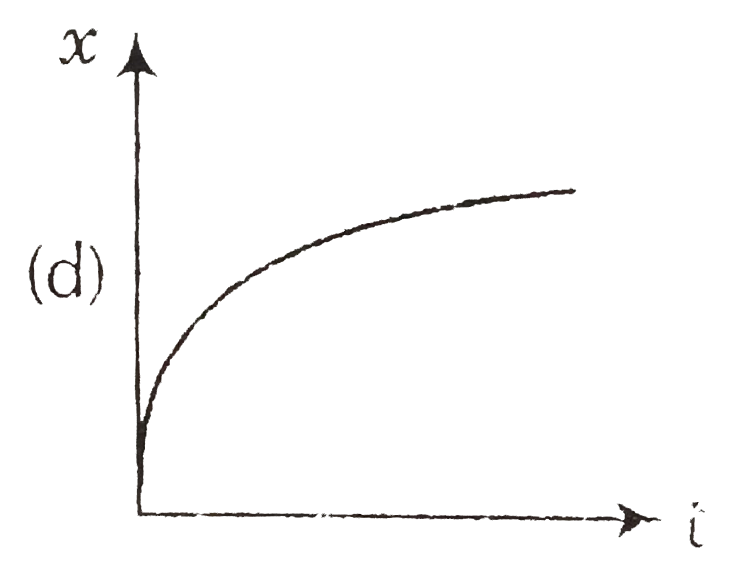
Among the four graphs shown in the figure there is only one graph for which average velocity over the time interval (0,T) can vanish for a suitably chosen . Which one is it ?

The correct Answer is:B
To determine which graph allows for the average velocity over the time interval (0, T) to vanish for a suitably chosen T, we can follow these steps:
1. Understanding Average Velocity:
The average velocity (V_avg) over a time interval is defined as the total displacement divided by the total time taken. Mathematically, it can be expressed as:
Vavg=ΔxΔt
where Δx is the change in position and Δt is the change in time.
2. Condition for Average Velocity to be Zero:
For the average velocity to be zero, the total displacement (Δx) must be zero over the chosen time interval. This means that the object must return to its starting position.
3. Analyzing the Graphs:
We need to analyze the four graphs provided (not shown here) to see which one allows for a situation where the object returns to its starting position after some time T.
4. Identifying Graph B:
Upon examining the graphs, we focus on Graph B. In this graph, we can observe that there are two points in time (let’s call them A and B) where the object has the same displacement. This means that if we choose a time interval that starts at time 0 and ends at time T, where T corresponds to either point A or point B, the object will have returned to its original position.
5. Calculating the Average Velocity:
Since the displacement at both points A and B is the same, the average velocity can be calculated as:
Vavg=xB−xAT=0T=0
This confirms that the average velocity can indeed vanish for a suitably chosen T.
6. Conclusion:
Therefore, the graph for which the average velocity over the time interval (0, T) can vanish is Graph B.
The average velocity (V_avg) over a time interval is defined as the total displacement divided by the total time taken. Mathematically, it can be expressed as:
Vavg=ΔxΔt
where Δx is the change in position and Δt is the change in time.
For the average velocity to be zero, the total displacement (Δx) must be zero over the chosen time interval. This means that the object must return to its starting position.
We need to analyze the four graphs provided (not shown here) to see which one allows for a situation where the object returns to its starting position after some time T.
Upon examining the graphs, we focus on Graph B. In this graph, we can observe that there are two points in time (let’s call them A and B) where the object has the same displacement. This means that if we choose a time interval that starts at time 0 and ends at time T, where T corresponds to either point A or point B, the object will have returned to its original position.
Since the displacement at both points A and B is the same, the average velocity can be calculated as:
Vavg=xB−xAT=0T=0
This confirms that the average velocity can indeed vanish for a suitably chosen T.
Therefore, the graph for which the average velocity over the time interval (0, T) can vanish is Graph B.
Topper's Solved these Questions
- MOTION IN A STRAIGHT LINE BOOK - NCERT EXEMPLAR ENGLISHCHAPTER - MOTION IN A STRAIGHT LINE EXERCISE - Multiple Choice Question (More Than One Qns)
6 Videos
- MOTION IN A STRAIGHT LINE BOOK - NCERT EXEMPLAR ENGLISHCHAPTER - MOTION IN A STRAIGHT LINE EXERCISE - Very Short Answer Type Qns
14 Videos
- MOTION IN A PLANEBOOK - NCERT EXEMPLAR ENGLISHCHAPTER - MOTION IN A PLANEEXERCISE - Multiple Choice Questions
37 Videos
- OSCILLATIONSBOOK - NCERT EXEMPLAR ENGLISHCHAPTER - OSCILLATIONSEXERCISE - All Questions
36 Videos
Similar Questions
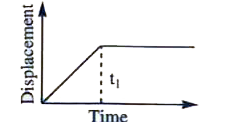
The x-t graph shown in figure represents

View SolutionThe x-t graph shown in figure represents.
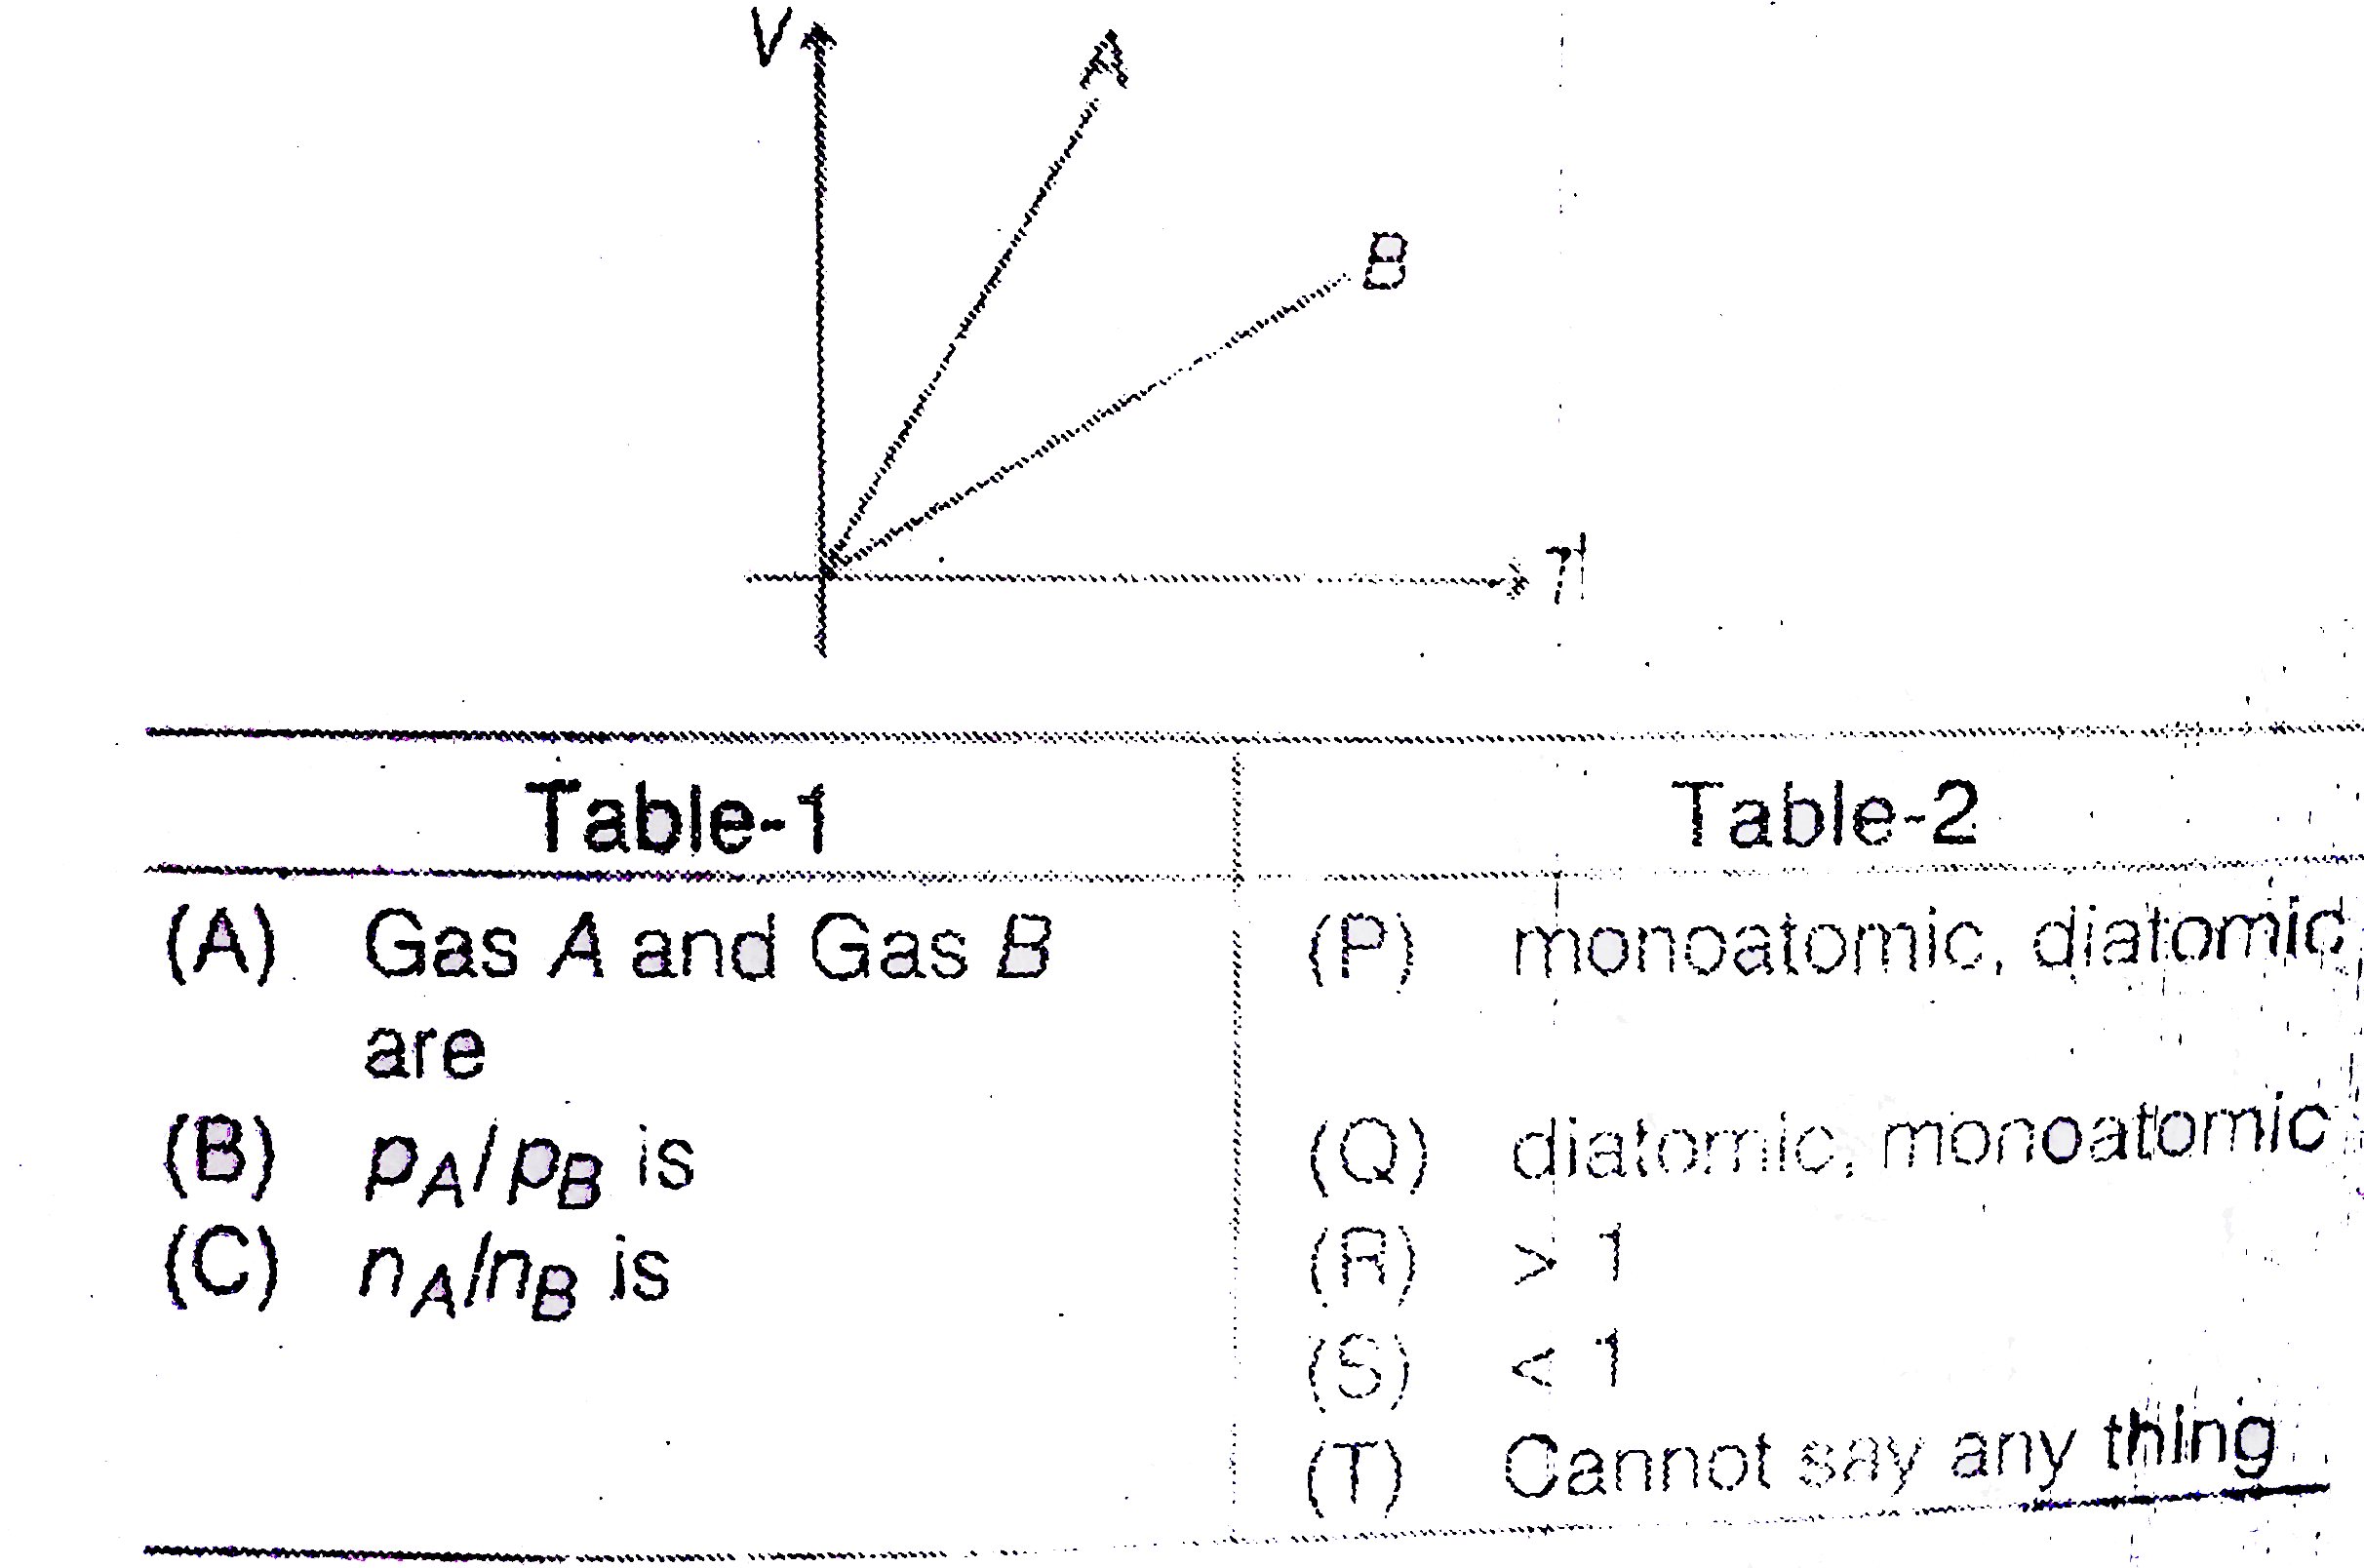
View SolutionIn the V-T graph shown in figure match the following.
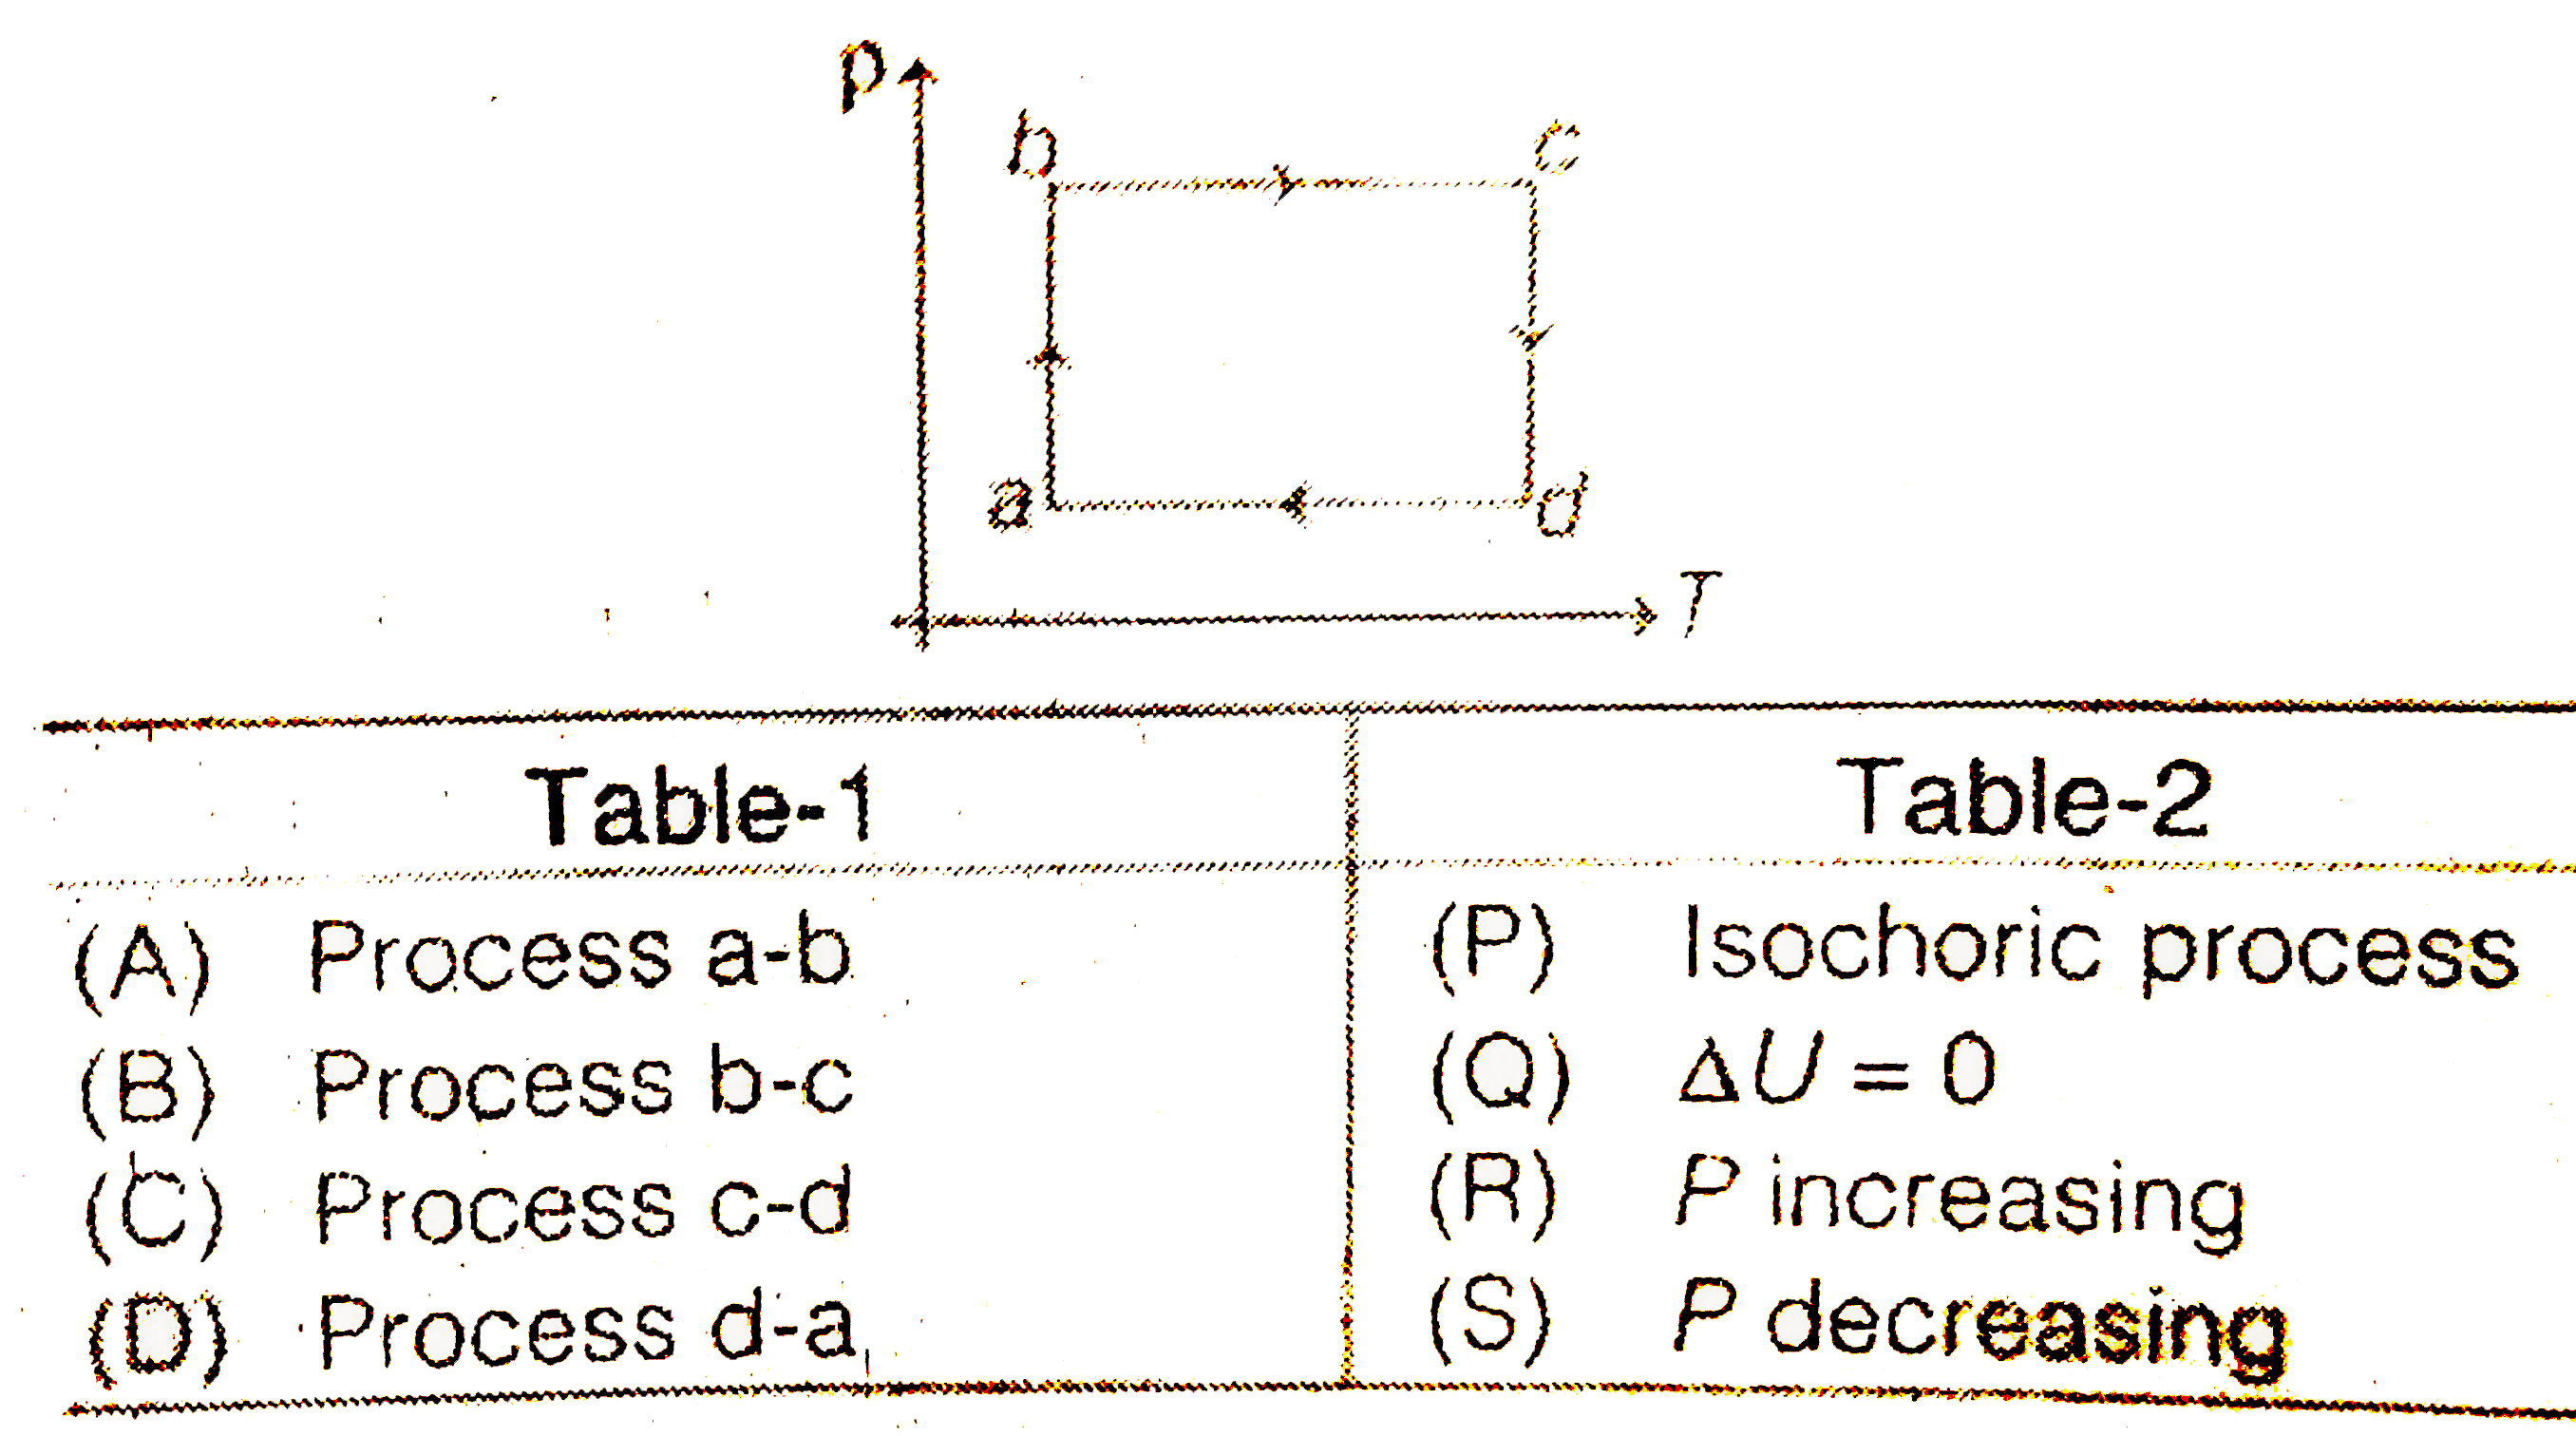
View SolutionIn the ρ-T graph shown in figure, match the following.
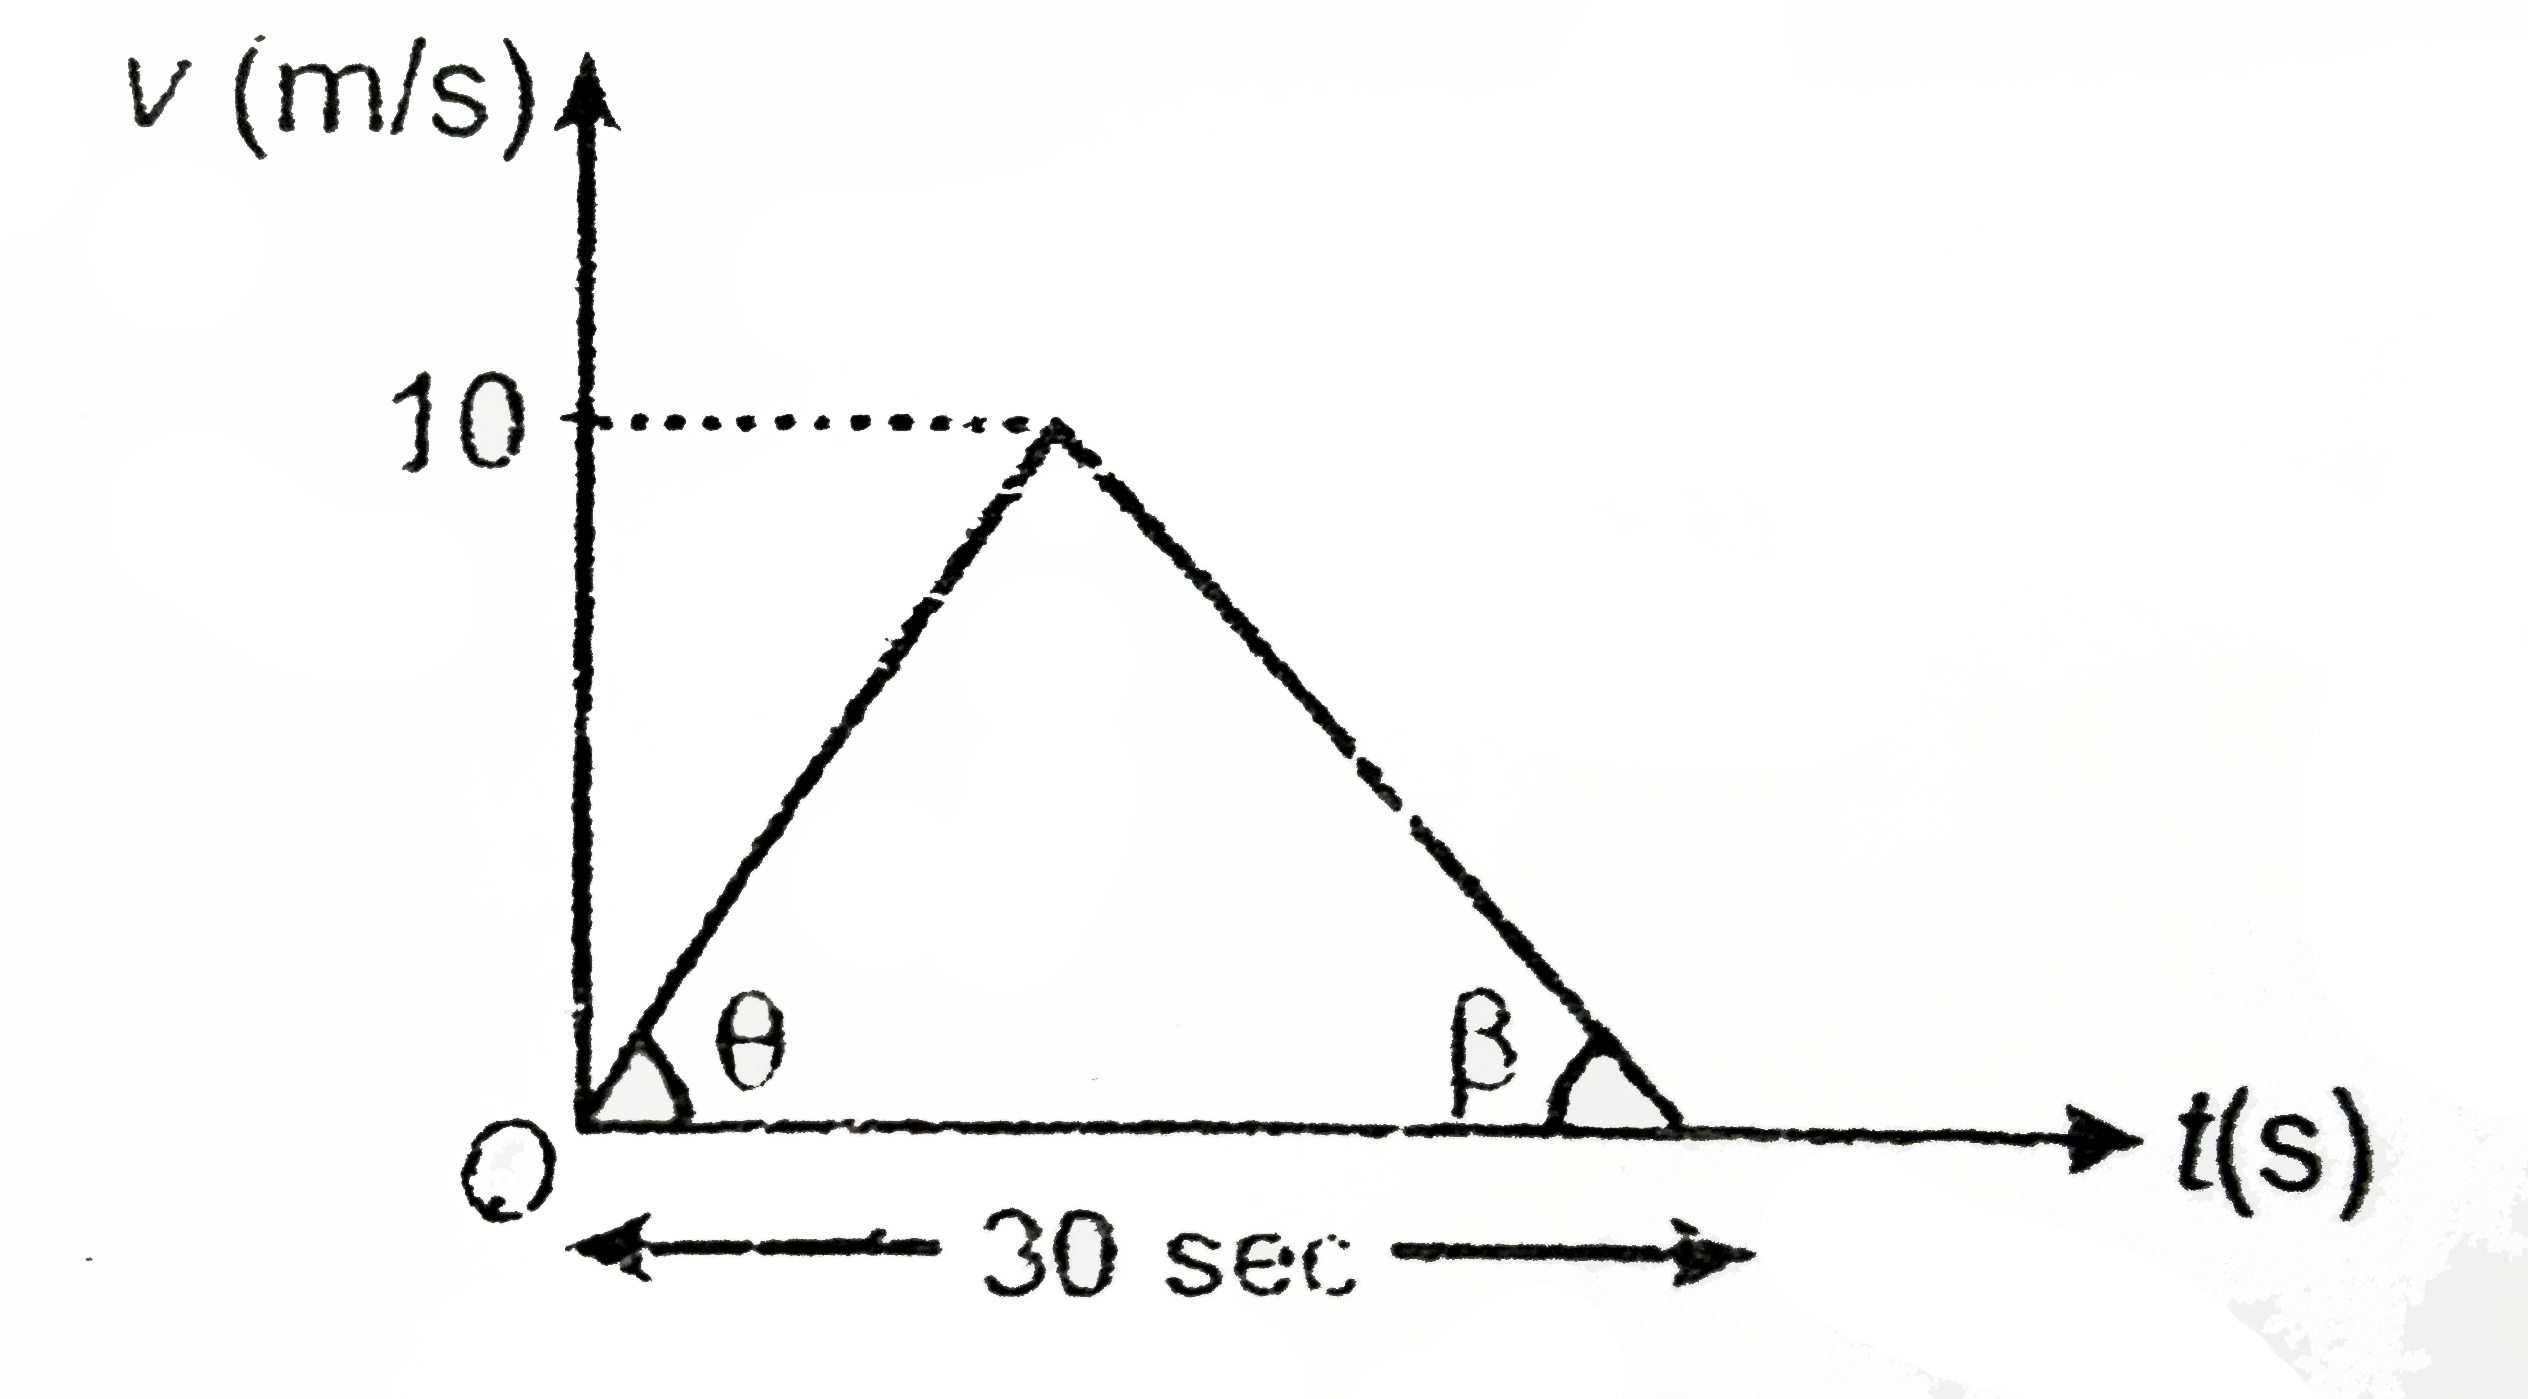
View SolutionA particle obeys the following v - t graph as shown. The average velocity over 30 s is
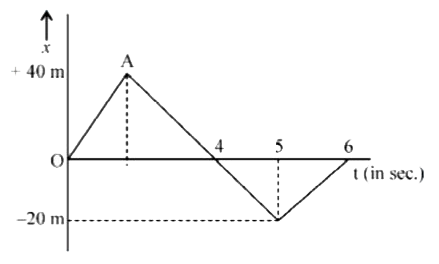
View Solutions-t graph of a particle in motion is shown in Fig. Calculate Average velocity
View Solution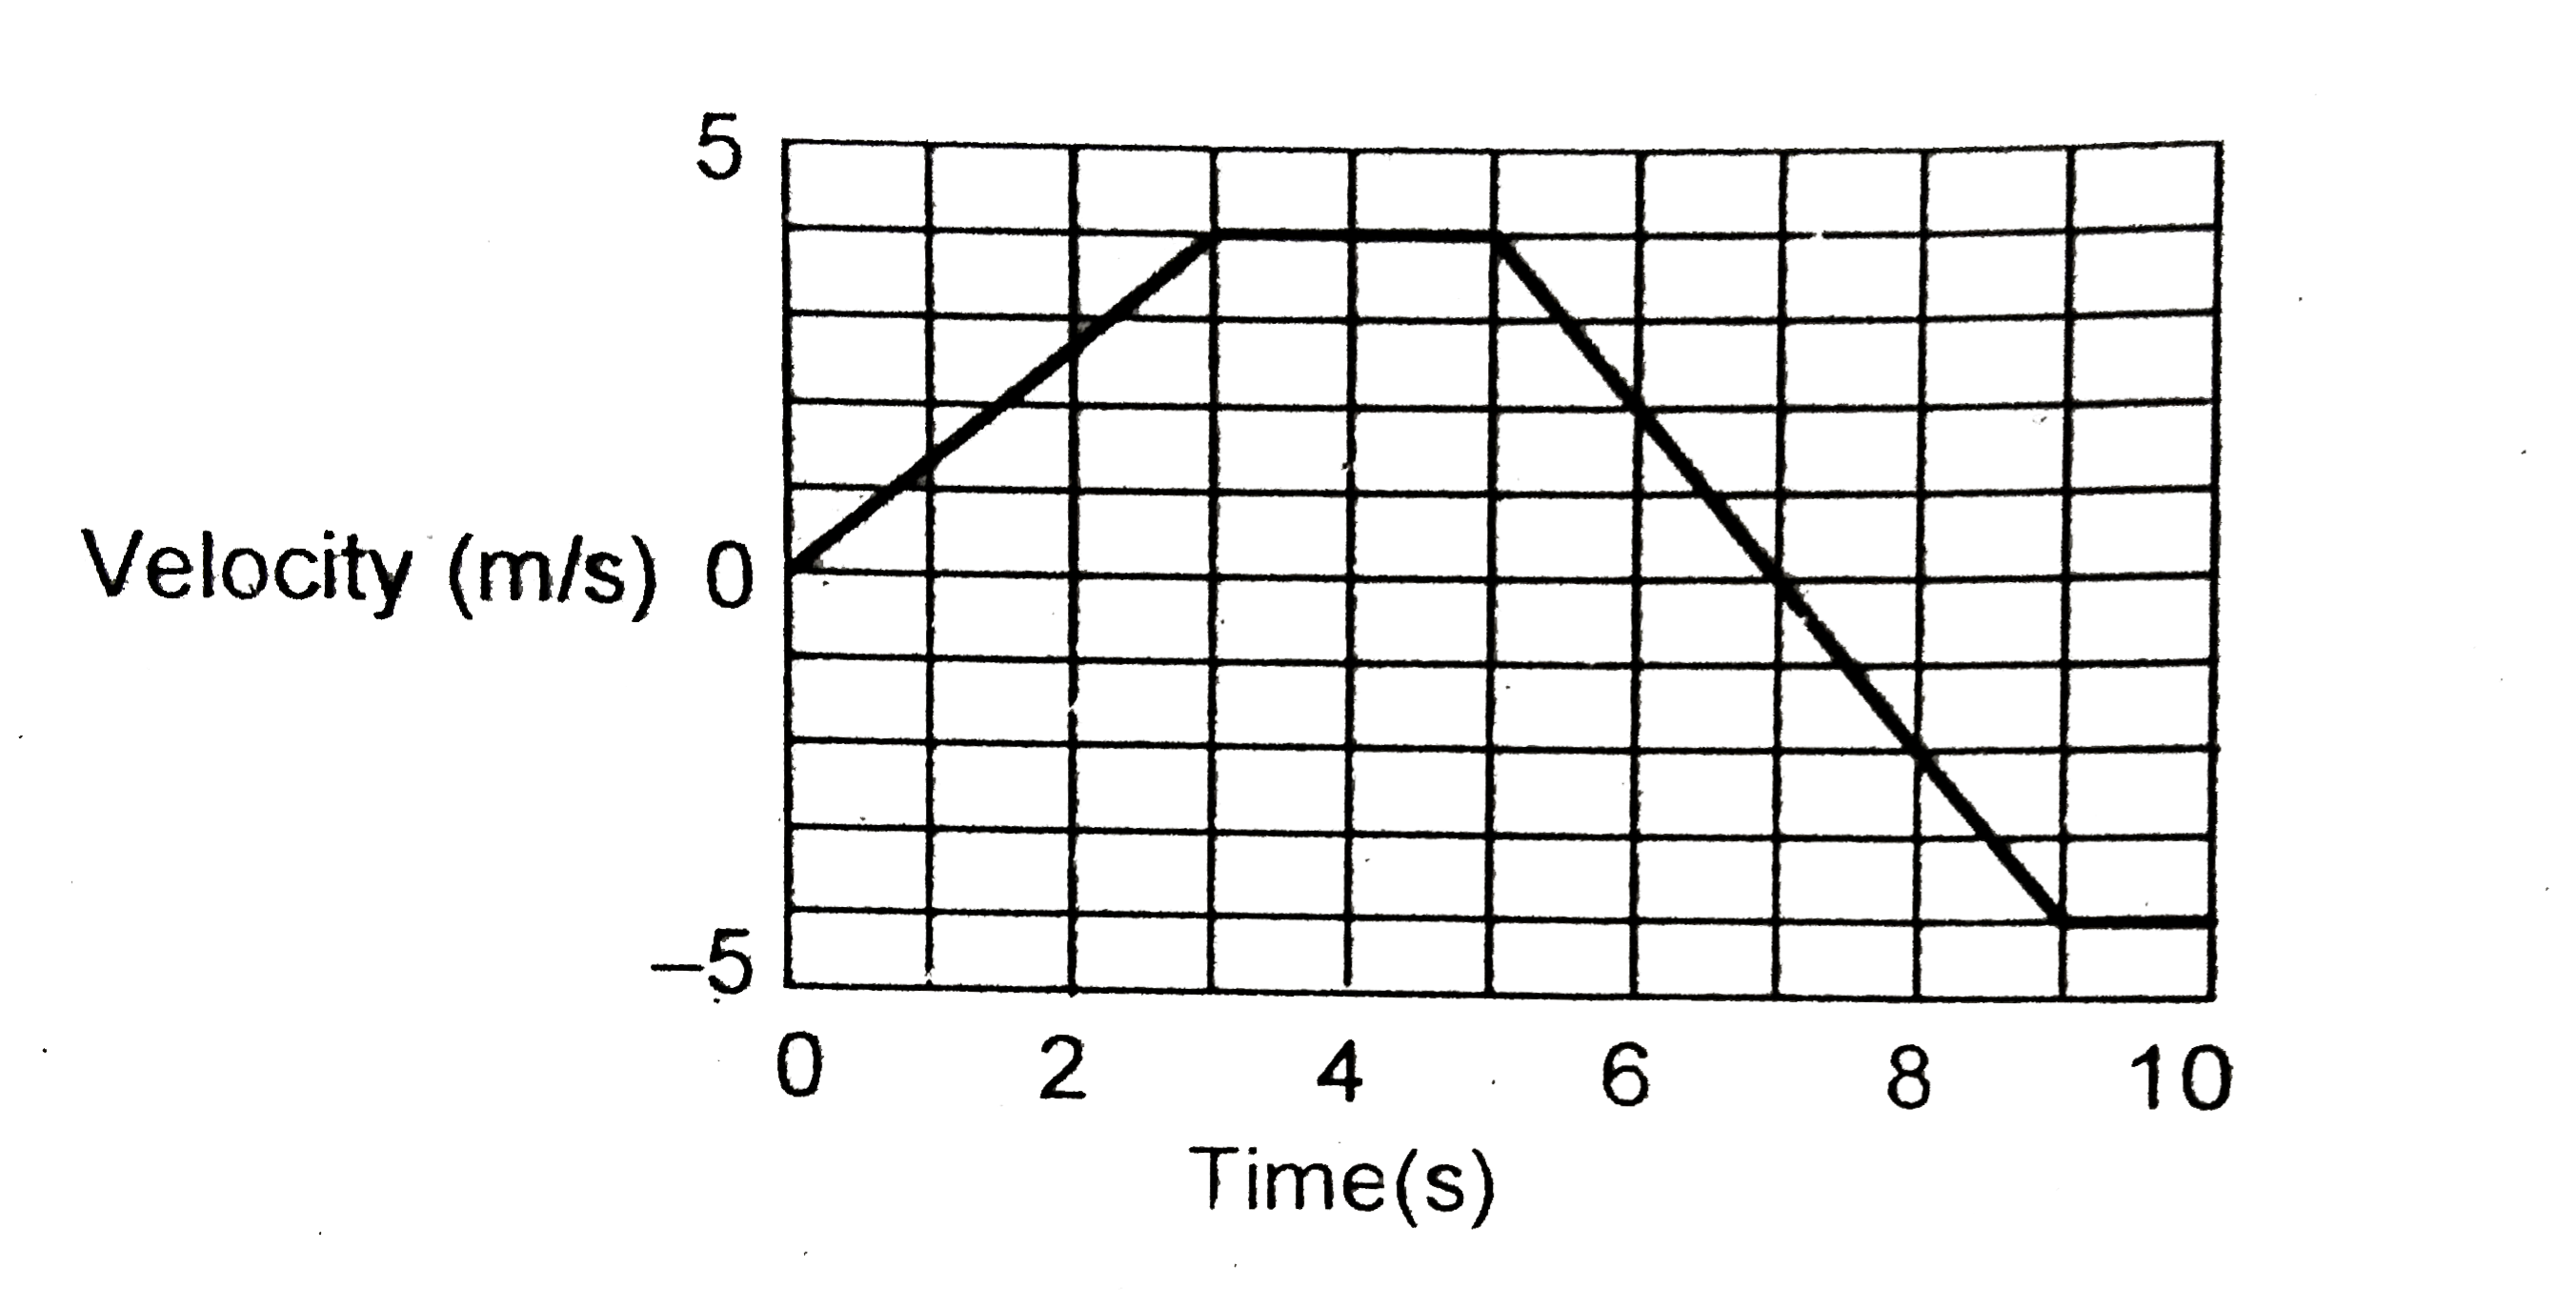
An object starts at the origin in a straight line. Its velocity versus time graph is shown in the figure. Which one of the following choices best gives the proper intervals (s) of time for which the object is moving away from the origin?
View SolutionThe a -t graph is shown in the figure. The maximum velocity attained by the body from rest will be

View SolutionFor which of the following graphs the average velocity of a particle moving along a straight line for time interval (0,t) must be negative−
View SolutionFor which of the following graphs the average velocity of a particl moving along a straight line for time interval (0,t) must be negative−
View Solution
