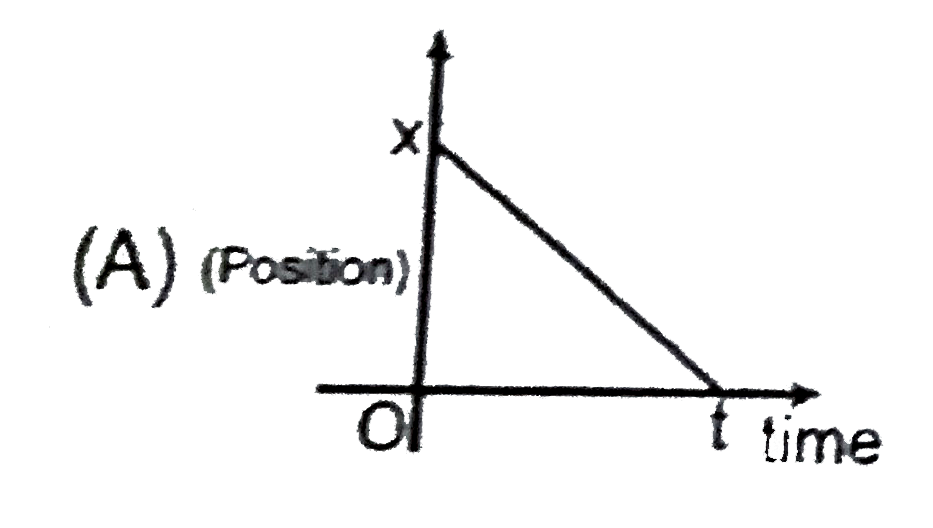
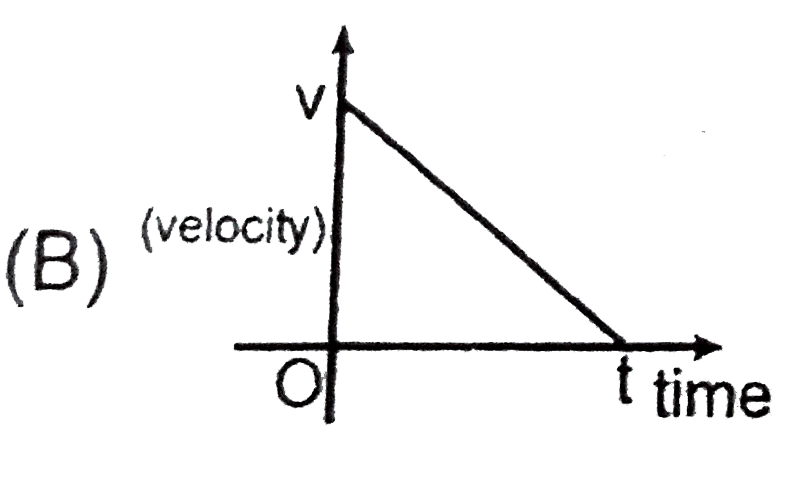
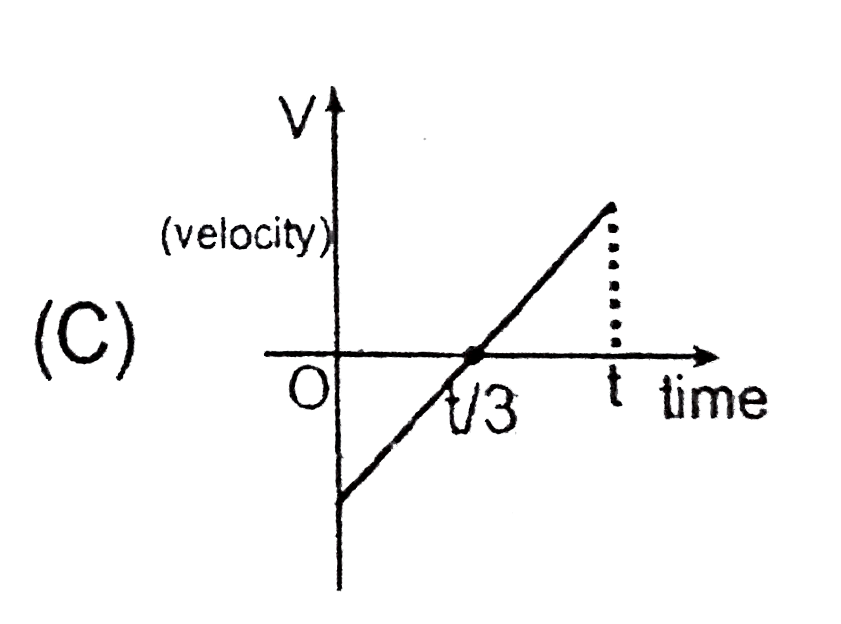
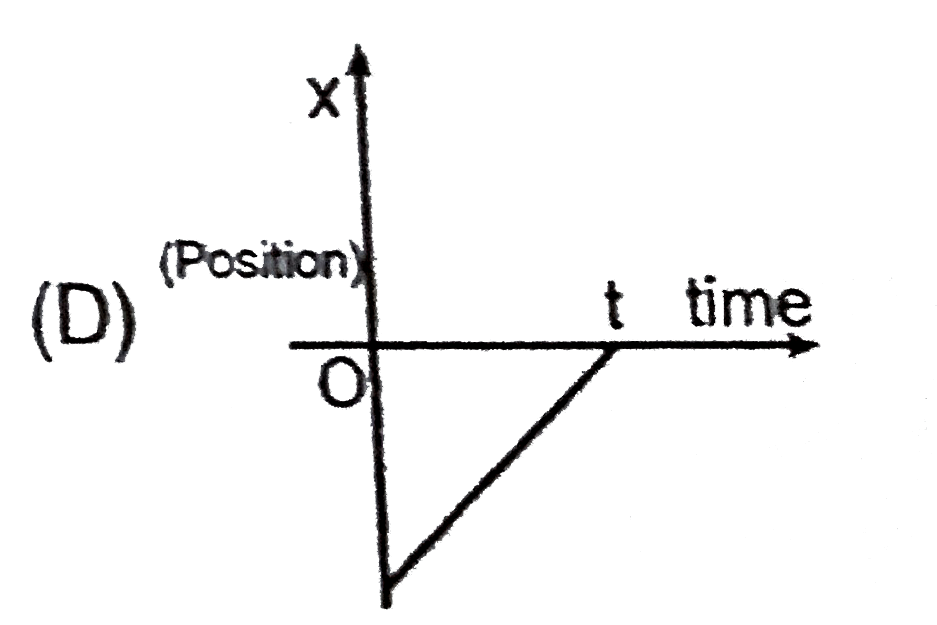
For which of the following graphs the average velocity of a particl moving along a straight line for time interval (0,t) must be negative−
The correct Answer is:A
To determine which graph indicates that the average velocity of a particle moving along a straight line for the time interval (0,t) must be negative, we need to analyze the graphs based on the concept of average velocity.
1. Understanding Average Velocity:
Average velocity (Vavg) is defined as the change in position (Δs) divided by the change in time (Δt):
Vavg=ΔsΔt
Here, Δs=s(t)−s(0) and Δt=t−0=t.
2. Analyzing Graphs:
We need to evaluate each graph to see if the change in position (Δs) is negative over the time interval (0,t).
- Graph 1 (Position vs. Time):
- If the graph shows a downward slope (i.e., the position decreases as time increases), then Δs<0. This indicates that the average velocity is negative.
- Graph 2 (Velocity vs. Time):
- For a velocity vs. time graph, the area under the curve represents the displacement. If the entire area is above the time axis (positive velocity), then Δs>0 and Vavg>0. Thus, this graph cannot represent a negative average velocity.
- Graph 3 (Velocity vs. Time):
- If this graph has both positive and negative areas, we need to compare the areas. If the positive area is greater than the negative area, then Δs>0. If the negative area is greater, then Δs<0. However, if the positive area is greater, Vavg>0.
- Graph 4 (Position vs. Time):
- Similar to Graph 1, if this graph shows a downward slope, then Δs<0, indicating a negative average velocity.
3. Conclusion:
After analyzing all the graphs:
- Only the first graph shows a negative average velocity because it represents a decrease in position over time, leading to Δs<0.
Final Answer:
The graph for which the average velocity of a particle moving along a straight line for the time interval (0,t) must be negative is Graph 1.
Average velocity (Vavg) is defined as the change in position (Δs) divided by the change in time (Δt):
Vavg=ΔsΔt
Here, Δs=s(t)−s(0) and Δt=t−0=t.
We need to evaluate each graph to see if the change in position (Δs) is negative over the time interval (0,t).
- If the graph shows a downward slope (i.e., the position decreases as time increases), then Δs<0. This indicates that the average velocity is negative.
- Graph 2 (Velocity vs. Time):
- For a velocity vs. time graph, the area under the curve represents the displacement. If the entire area is above the time axis (positive velocity), then Δs>0 and Vavg>0. Thus, this graph cannot represent a negative average velocity.
- Graph 3 (Velocity vs. Time):
- If this graph has both positive and negative areas, we need to compare the areas. If the positive area is greater than the negative area, then Δs>0. If the negative area is greater, then Δs<0. However, if the positive area is greater, Vavg>0.
- Graph 4 (Position vs. Time):
- Similar to Graph 1, if this graph shows a downward slope, then Δs<0, indicating a negative average velocity.
After analyzing all the graphs:
- Only the first graph shows a negative average velocity because it represents a decrease in position over time, leading to Δs<0.
The graph for which the average velocity of a particle moving along a straight line for the time interval (0,t) must be negative is Graph 1.
Topper's Solved these Questions
- DAILY PRACTICE PROBLEMSBook:RESONANCE ENGLISHChapter:DAILY PRACTICE PROBLEMSExercise:dpp 20
Explore 8 Videos
- DAILY PRACTICE PROBLEMSBook:RESONANCE ENGLISHChapter:DAILY PRACTICE PROBLEMSExercise:dpp 21
Explore 8 Videos
- DAILY PRACTICE PROBLEMSBook:RESONANCE ENGLISHChapter:DAILY PRACTICE PROBLEMSExercise:dpp 18
Explore 7 Videos
- CURRENT ELECTRICITYBook:RESONANCE ENGLISHChapter:CURRENT ELECTRICITYExercise:Exercise
Explore 53 Videos
- ELASTICITY AND VISCOCITYBook:RESONANCE ENGLISHChapter:ELASTICITY AND VISCOCITYExercise:Advanced Level Problems
Explore 9 Videos
Similar Questions
Knowledge Check
Which of the following graphs represents the position time-graph of a particle moving with negative velocity?
A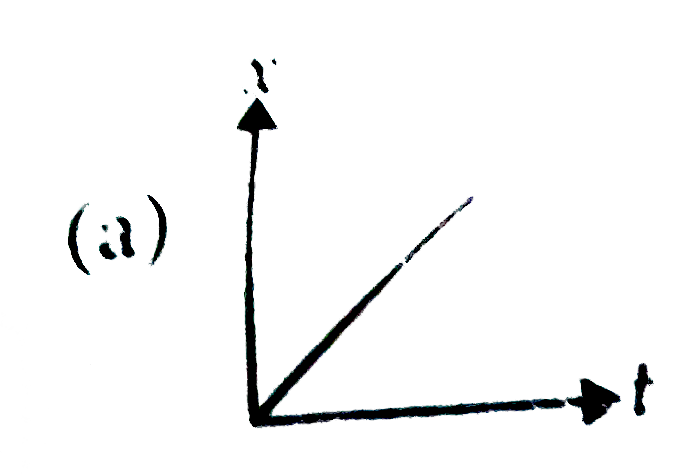 B
B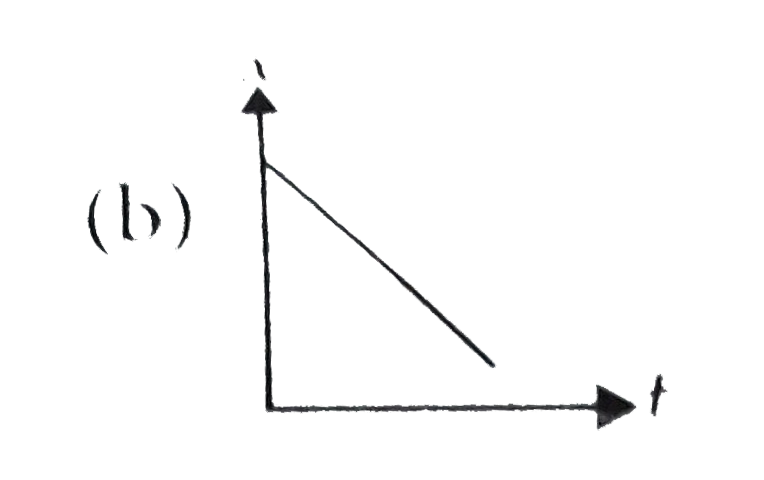 C
C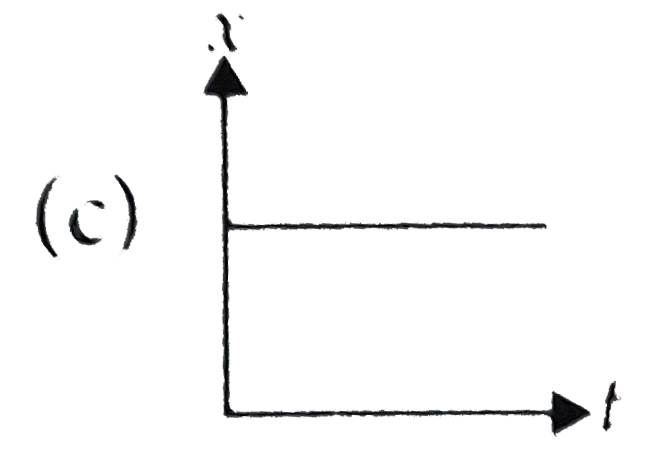 D
D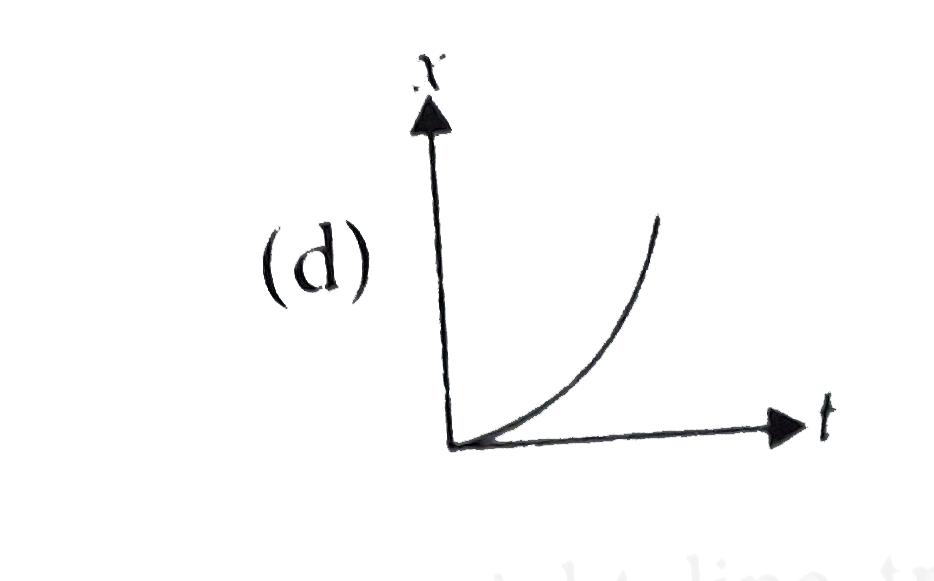
Which of the following graph for a body moving along a straight line is possible ?
View SolutionAverage velocity of a particle moving in a straight line, with constant acceleration a and initial velocity u in first t seconds is.
View SolutionAverage velocity of a particle moving in a straight line, with constant acceleration a and initial velocity u in first t seconds is.
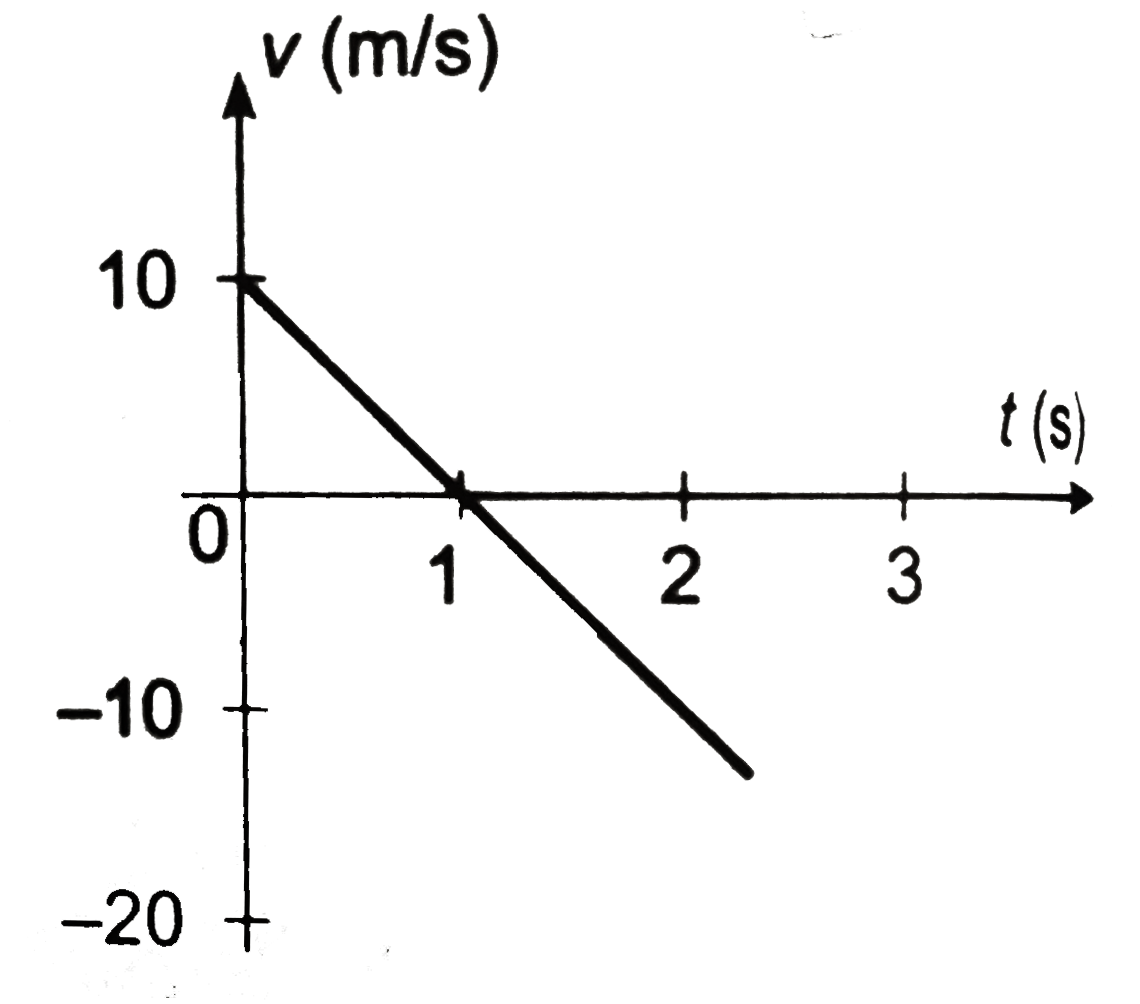
View SolutionThe figure shows velocity-time graph of a particle moving along a straight line. Identify the correct statement.
View SolutionVelocity displacement graph of a particle moving in a straight line is as shown in figure.

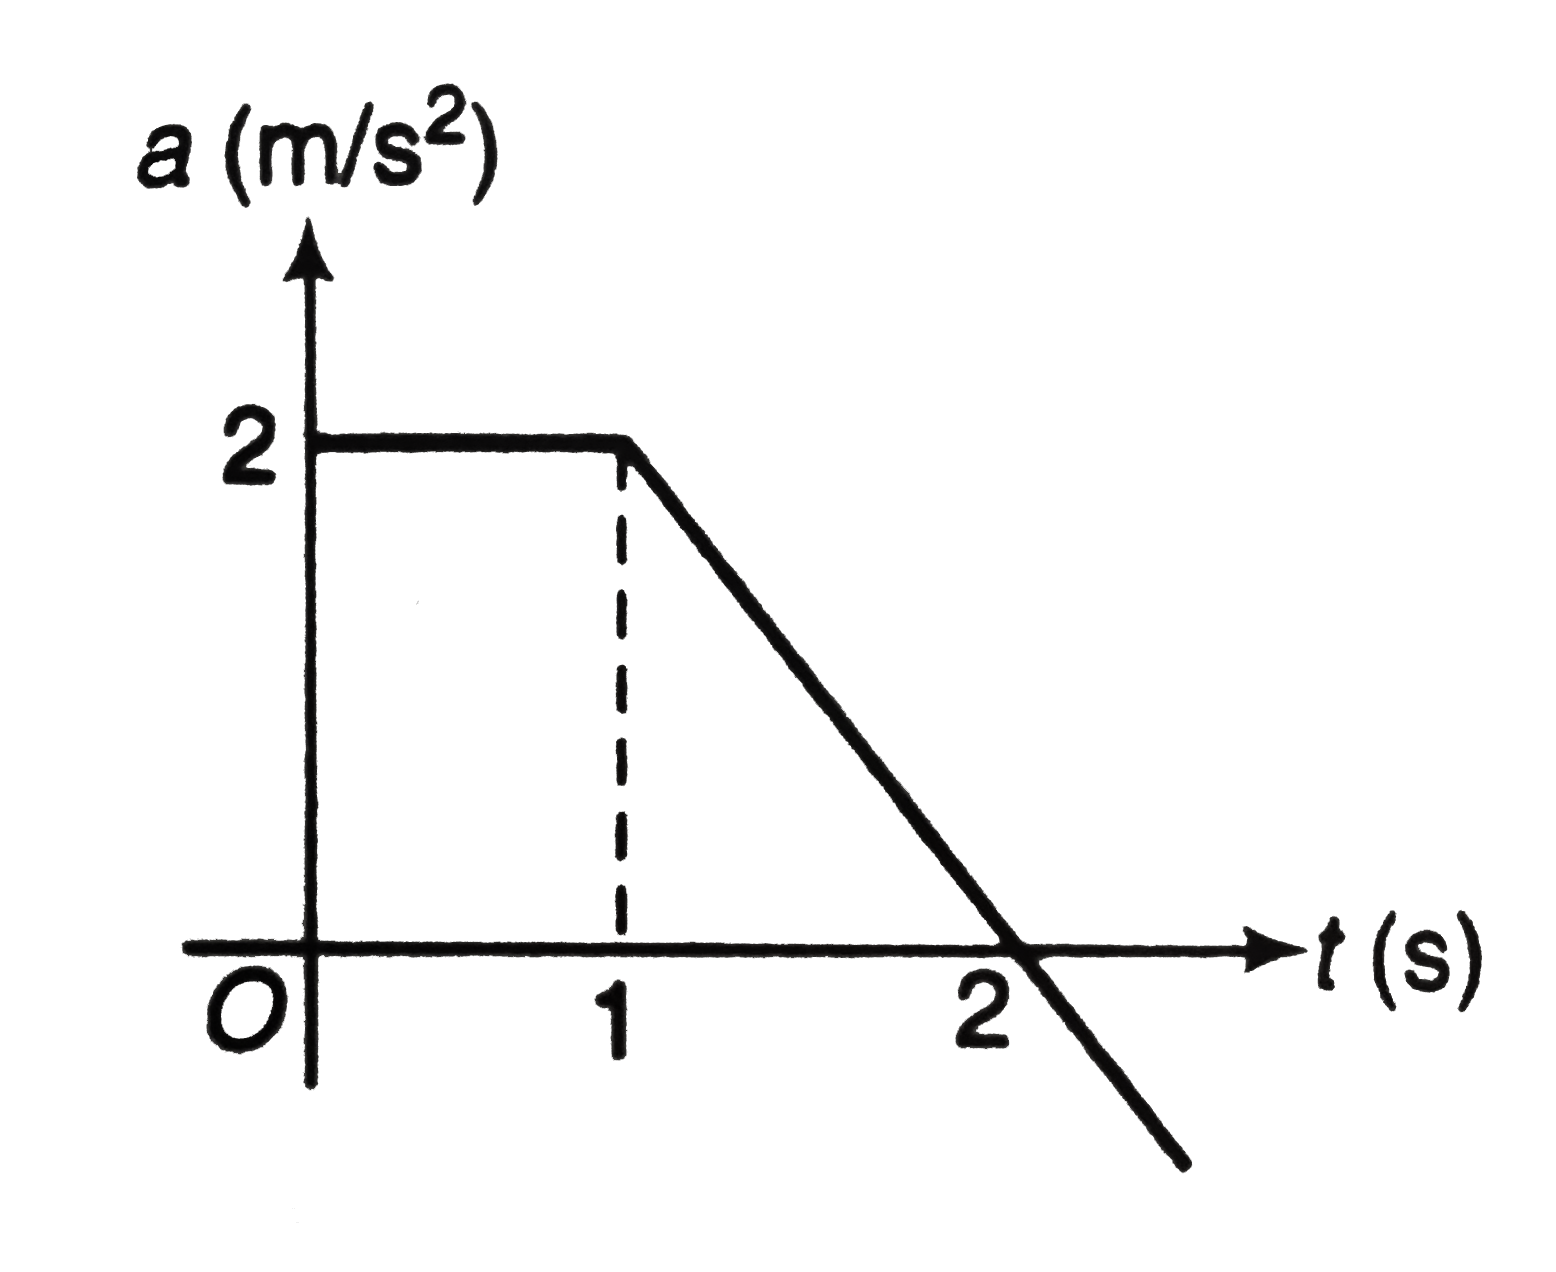
View SolutionFigure shows the acceleration-time graph of a particle moving along a straight line. After what time the particle acquires its initial velocity?
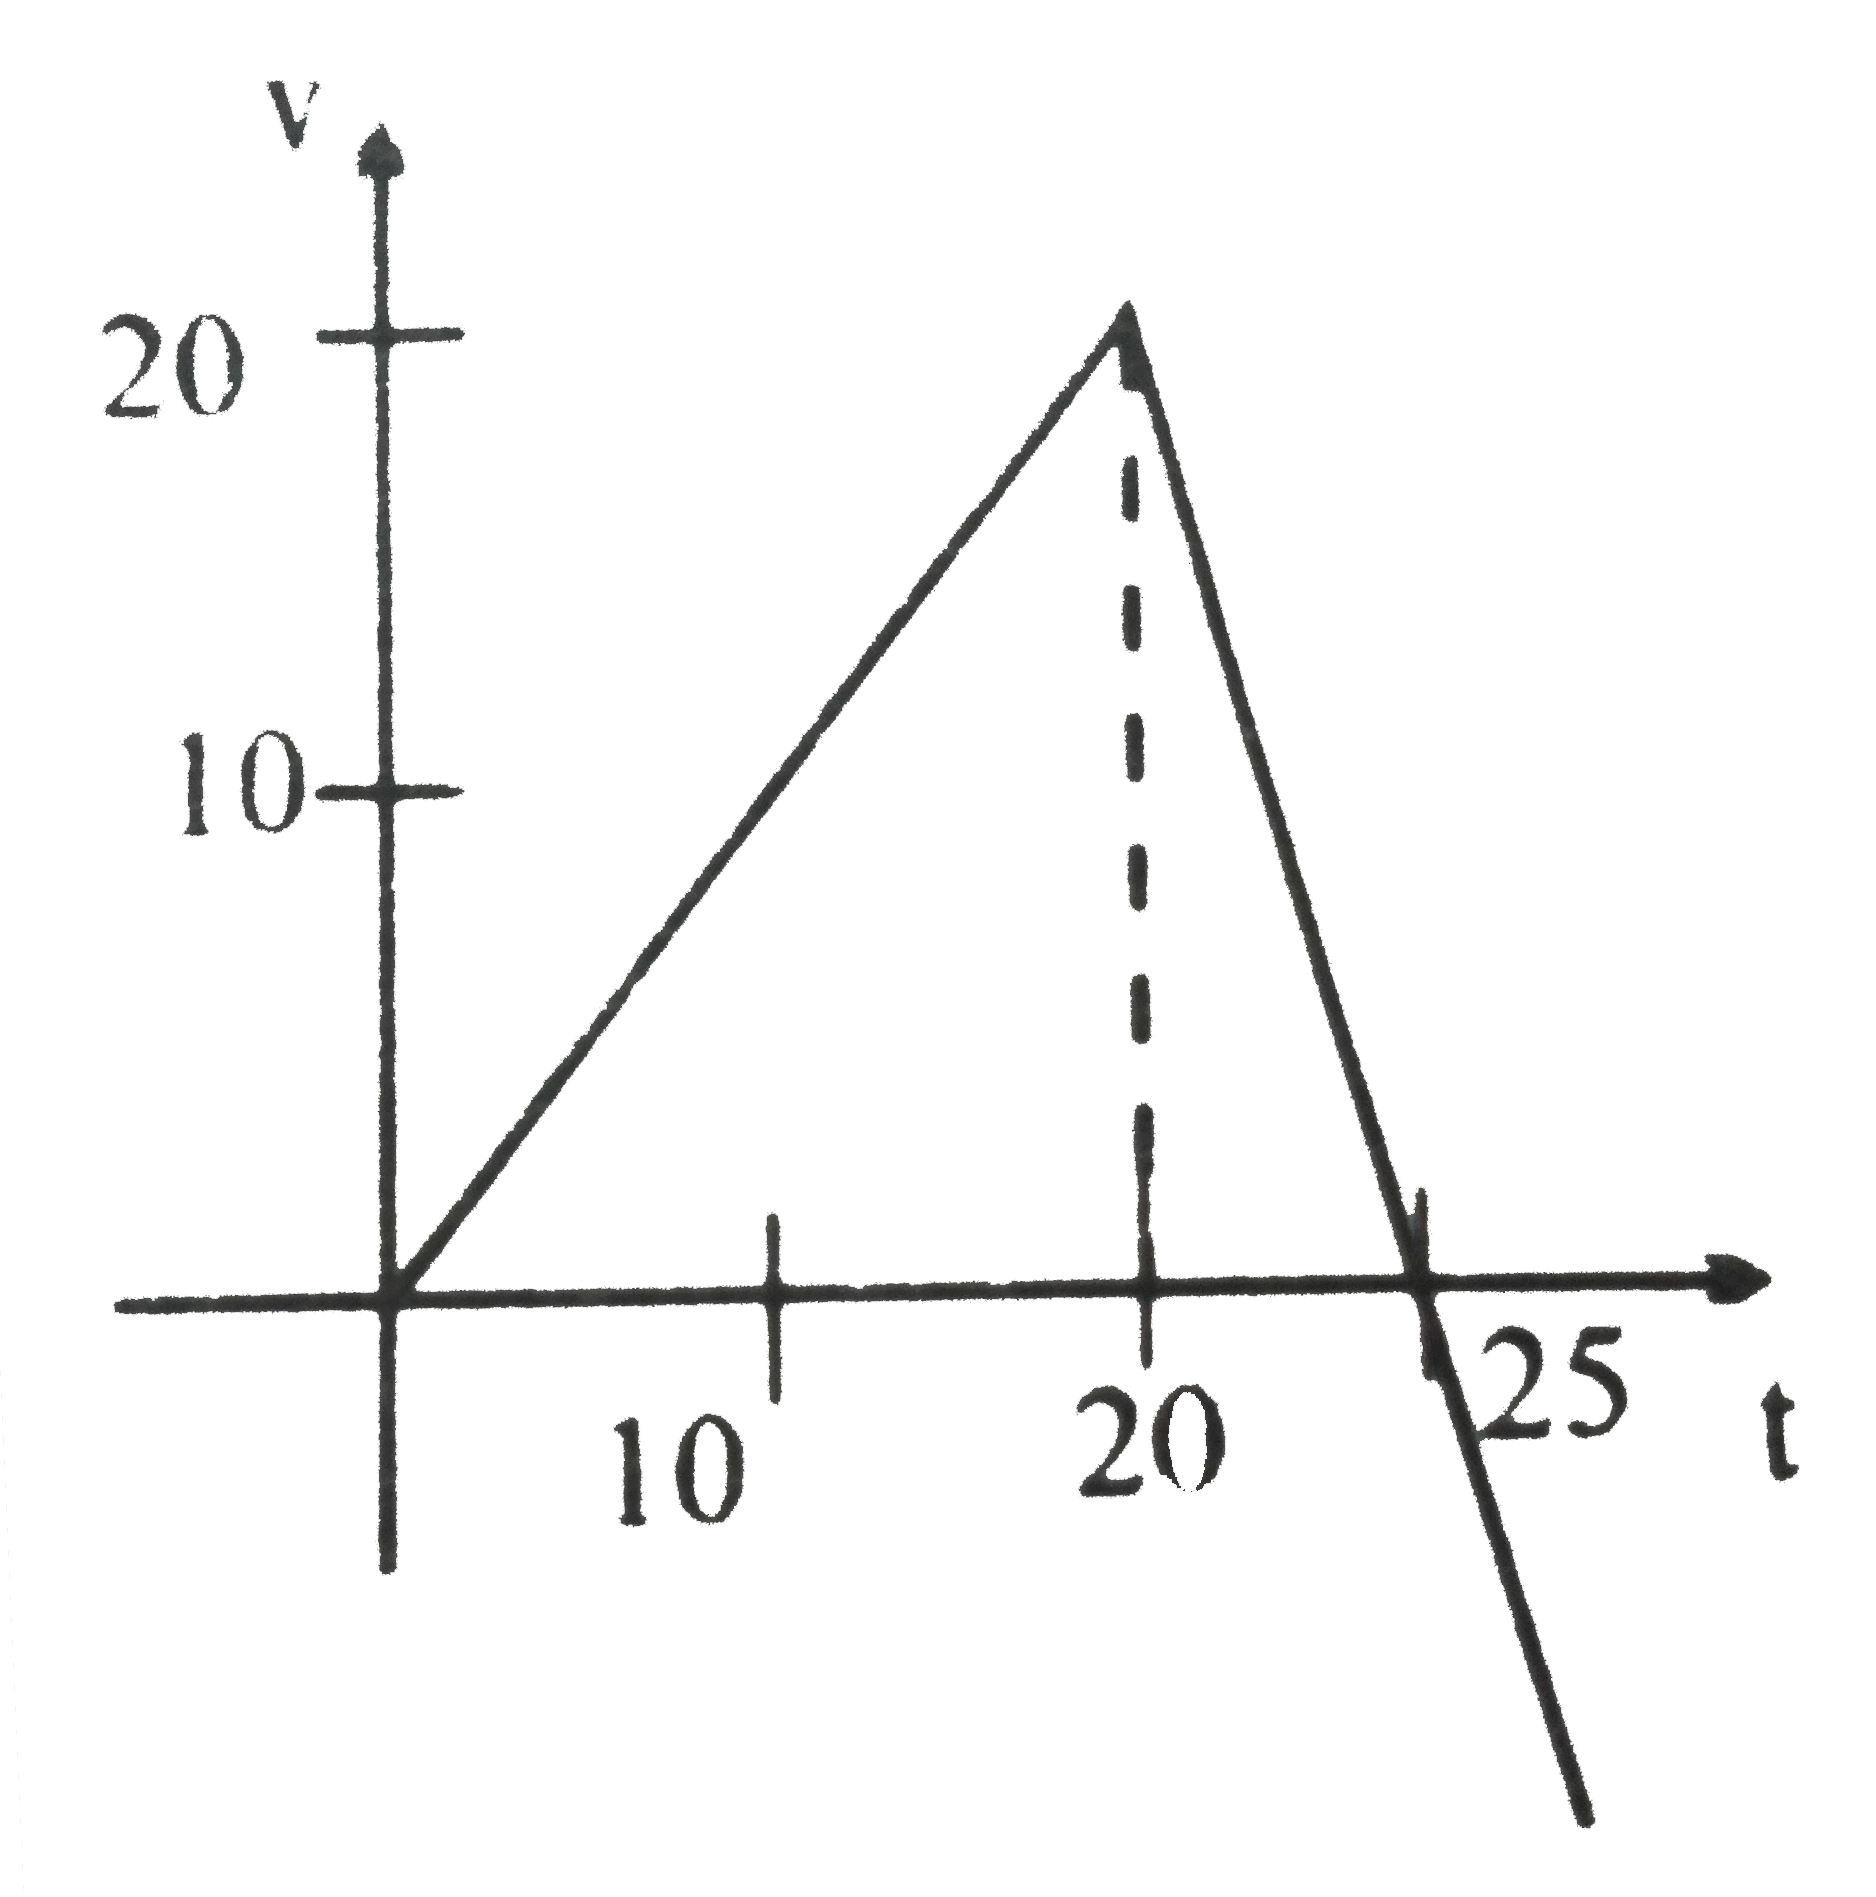
View SolutionThe fig. shows the v−t graph of a particle moving in straight line. Find the time when particle returns to the starting point.
View Solution