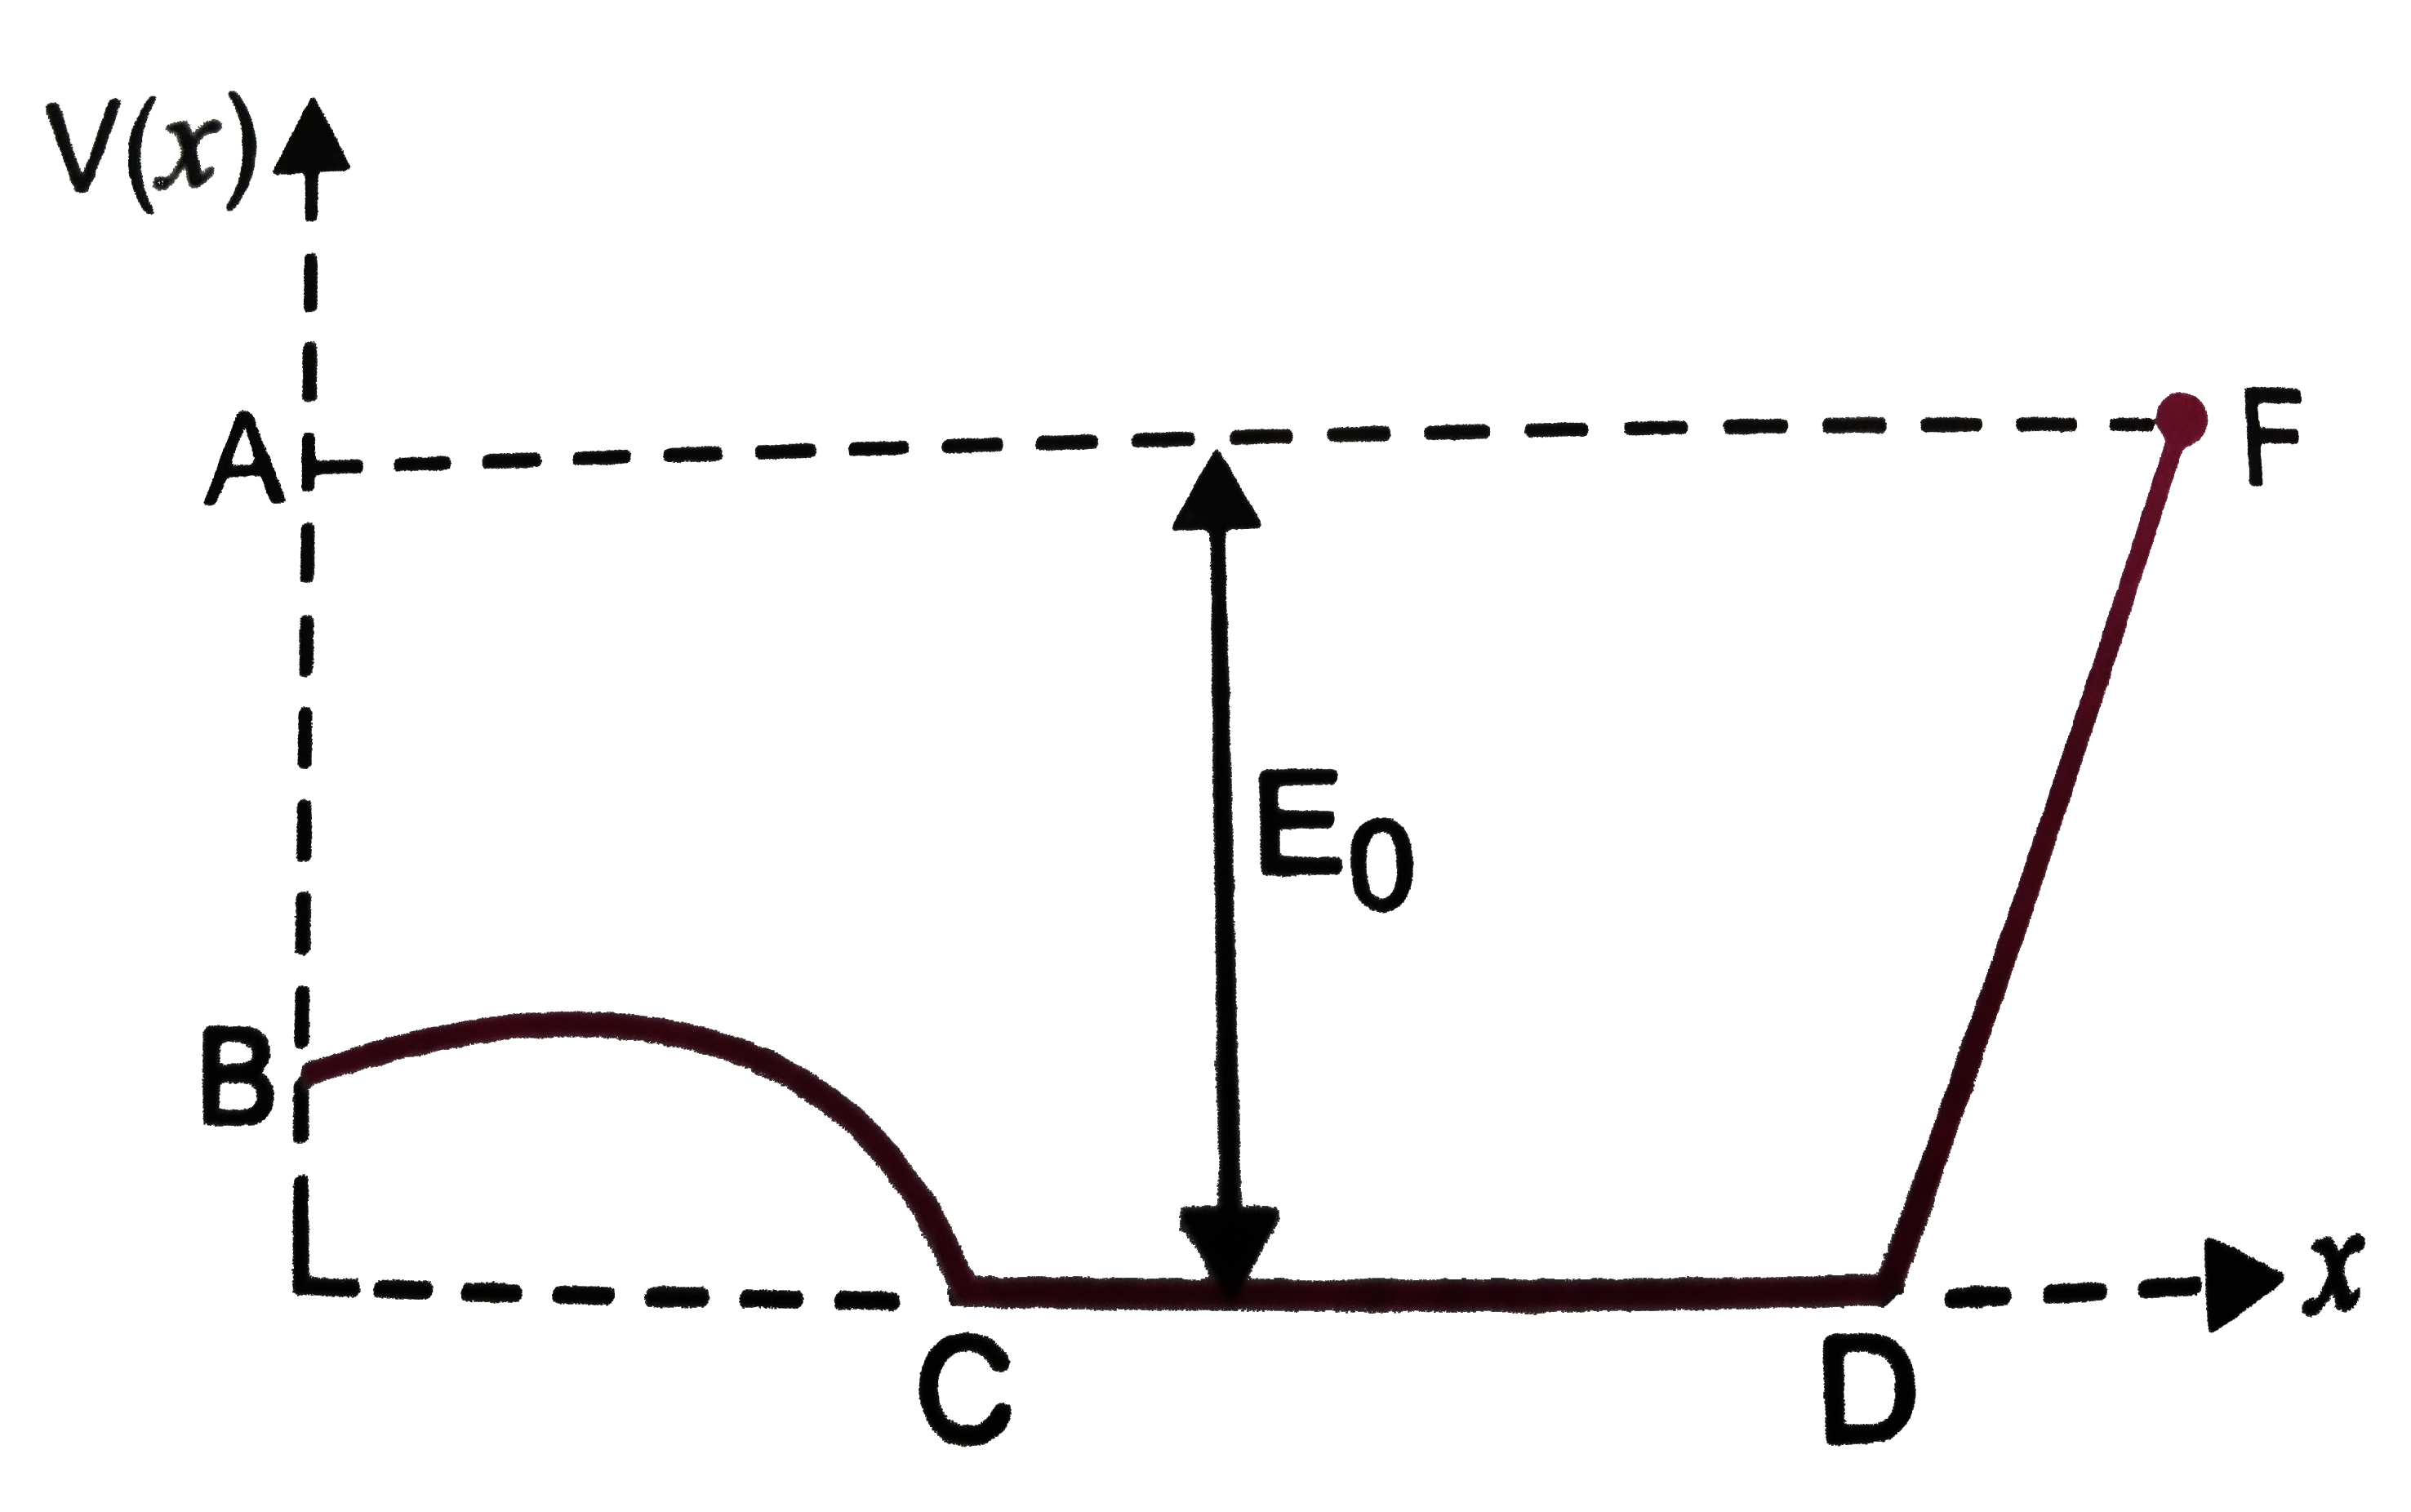
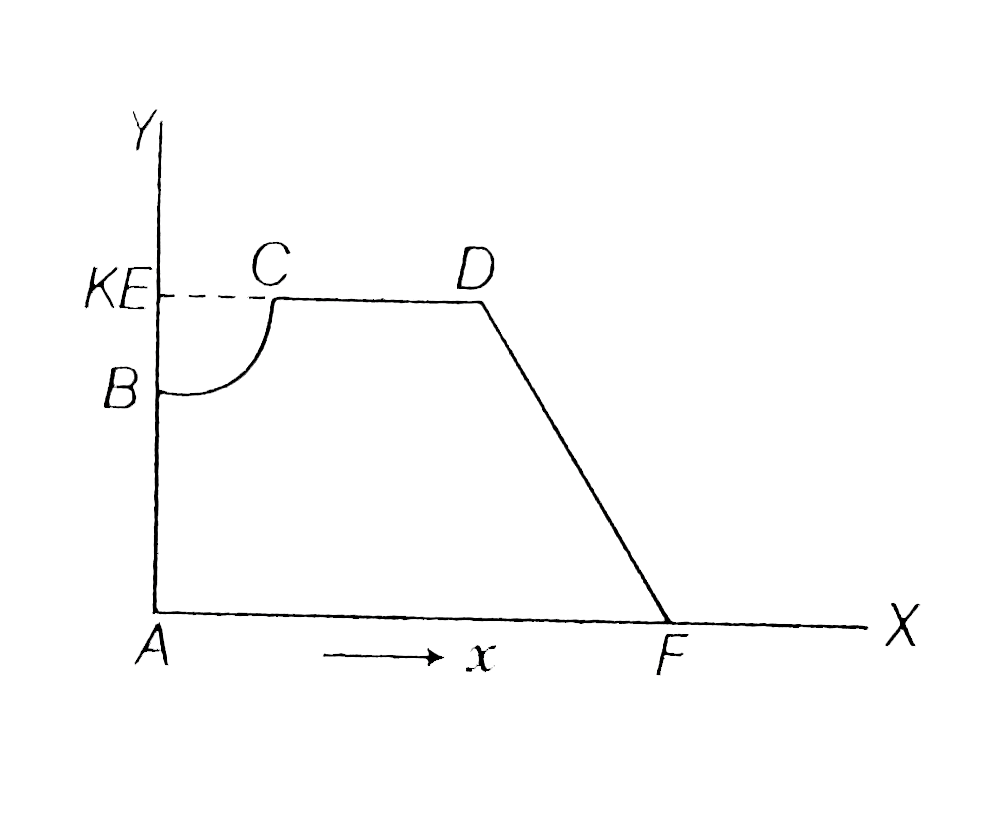
A graph of potential energy V(x) verses x is shown in figure. A particle of energy E0 is executing motion in it. Draw graph of velocity and kinetic energy versus x for one complete cycle AFA.

We know that Total ME=KE+PE
⇒E0=KE+V(x) ltbRgt ⇒KE=E0−V(x)
at A1x=0,V(x)=E0
⇒KE=E0−E0=0
at B1V(x)>E0
⇒KE>0
at C and D1V(x)=0
⇒KEismaxiμmatF_(1)V(x)=E_(0)<br>Hence,KE=0<br>Hence,KE=0Thevariationisshown∈adjacentdiagram.<br>Velocityversusxgraph<br>AsKE=(1)/(2)mv^(2)<br><imga≤ocr_imageload∈g=lazysrc=https://d10lpgp6xz60nq.cloudfront.net/physics_images/ARH_NCERT_EXE_PHY_XI_C05_S01_034_S01.pngwh=80%mx-autosty≤=background:white;><br>thereforeAtAandF,whereKE=0,v=0<br>AtCandD,KEismaxiμm.Therefore,vispmmax.<br>AtB,KEispositivebut¬maxiμm<br>Therefore,v is pm "some value"
The variation is shown in the diagram.

Topper's Solved these Questions
- WORK, ENERGY AND POWERBOOK - NCERT EXEMPLAR ENGLISHCHAPTER - WORK, ENERGY AND POWEREXERCISE - Long answer
1 Videos
- WORK, ENERGY AND POWERBOOK - NCERT EXEMPLAR ENGLISHCHAPTER - WORK, ENERGY AND POWEREXERCISE - Very short answer
1 Videos
- WAVESBOOK - NCERT EXEMPLAR ENGLISHCHAPTER - WAVESEXERCISE - LONG ANSWER TYPE QUESTIONS
5 Videos
Similar Questions
Knowledge Check
The potential energy function for a particle executing linear SHM is given by V(x)=12kx2 where k is the force constant of the oscillator. For k=0.5Nm−1, the graph of V(x) versus x is shown in the figure A particle of total energy E turns back when it reaches x=±xm.if V and K indicate the potential energy and kinetic energy respectively of the particle at x=+xm,then which of the following is correct?
 AV=0, K=EBV=E, K=0CV lt K, K=0DV=0, K lt E
The potential energy function for a particle executing linear SHM is given by V(x)=12kx2 where k is the force constant of the oscillator. For k=0.5Nm−1, the graph of V(x) versus x is shown in the figure A particle of total energy E turns back when it reaches x=±xm.if V and K indicate the potential energy and kinetic energy respectively of the particle at x=+xm,then which of the following is correct?
 AV=0, K=EBV=E, K=0CV lt K, K=0DV=0, K lt E
The slope of potential energy versus position graph represents
AforceBpowerCmomentumDwork
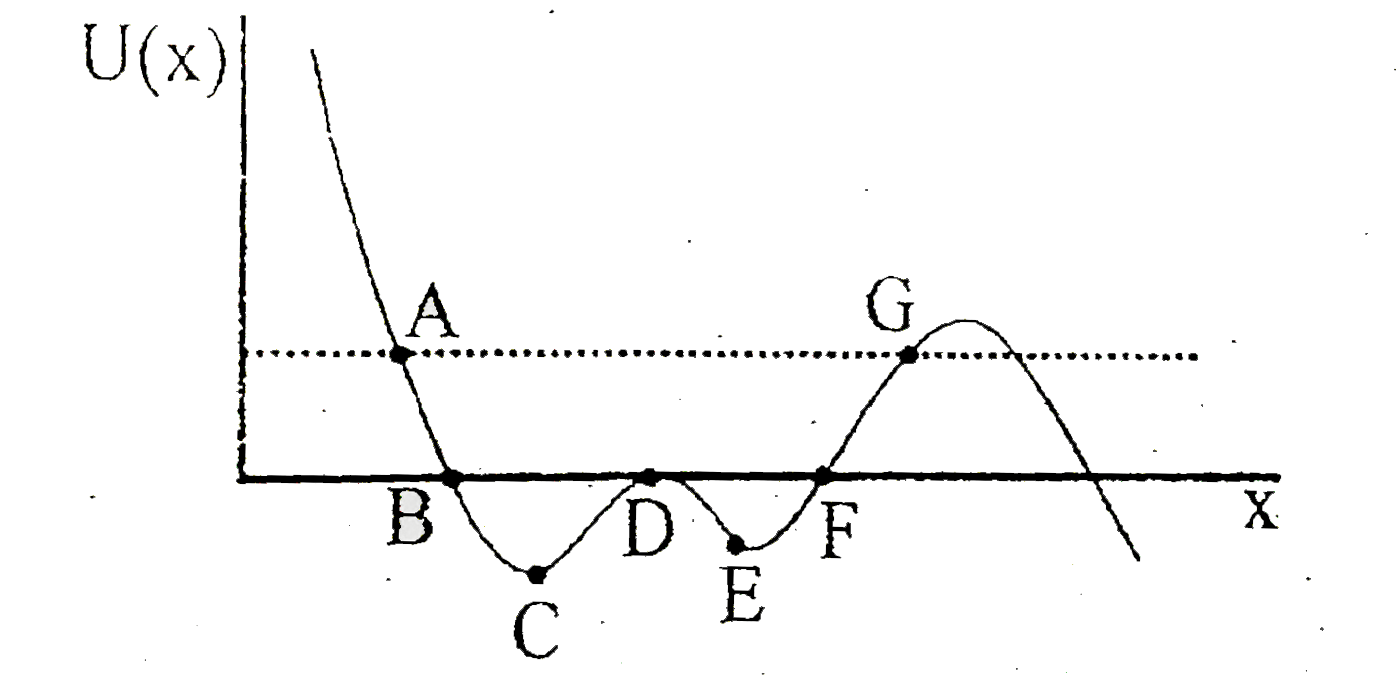
The figure below shows a graph of potential energy U(s) verses position x for a particle executing on edimensional motion along the x axis. The total mechanical energy of the system is indicated by the dashed line. At t=0 the particle is somewhere between points A and G. For later times choose the correct statement:-

View SolutionAssertion : The graph of potential energy and kinetic energy of a particle in SHM with respect to position is a parabola.
Reason : Potential energy and kinetic energy do not vary linearly with position.
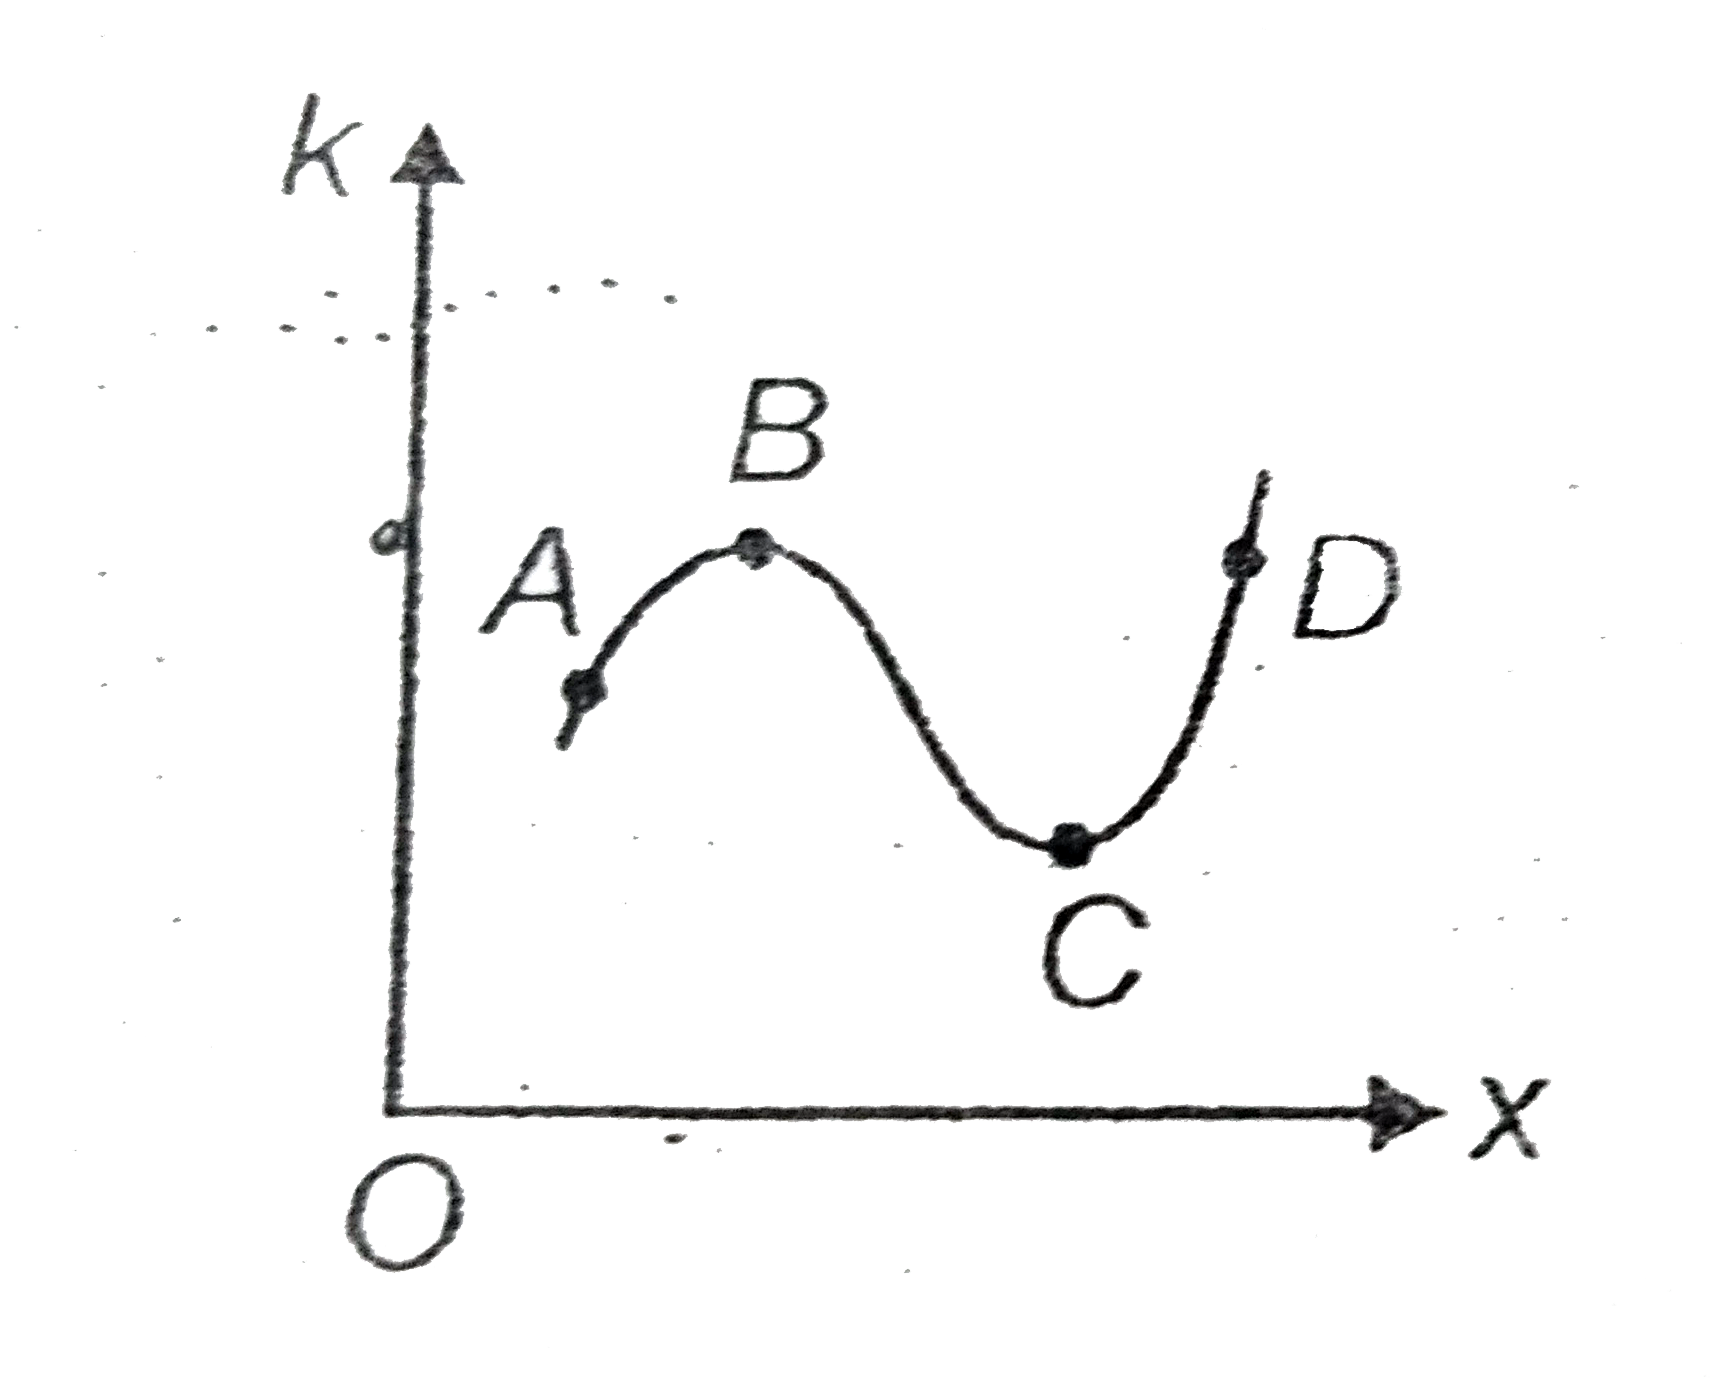
View SolutionFor a particle moving under the action of a variable force, kinetic energy (k) versus position (x) graph is given, then

View SolutionThe figure below shows a graph of potential energy U(s) verses position x for a particle executing on edimensional motion along the x axis. The total mechanical energy of the system is indicated by the dashed line. At t=0 the particle is somewhere between points A and G. For later times choose the correct statement:-

View SolutionAssertion : The graph of potential energy and kinetic energy of a particle in SHM with respect to position is a parabola.
Reason : Potential energy and kinetic energy do not vary linearly with position.
View Solution
