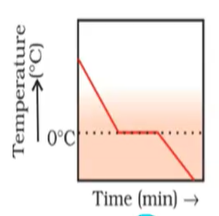
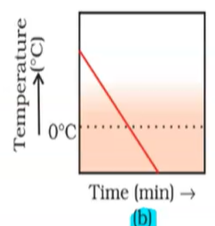
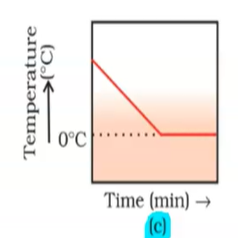
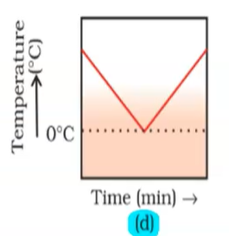
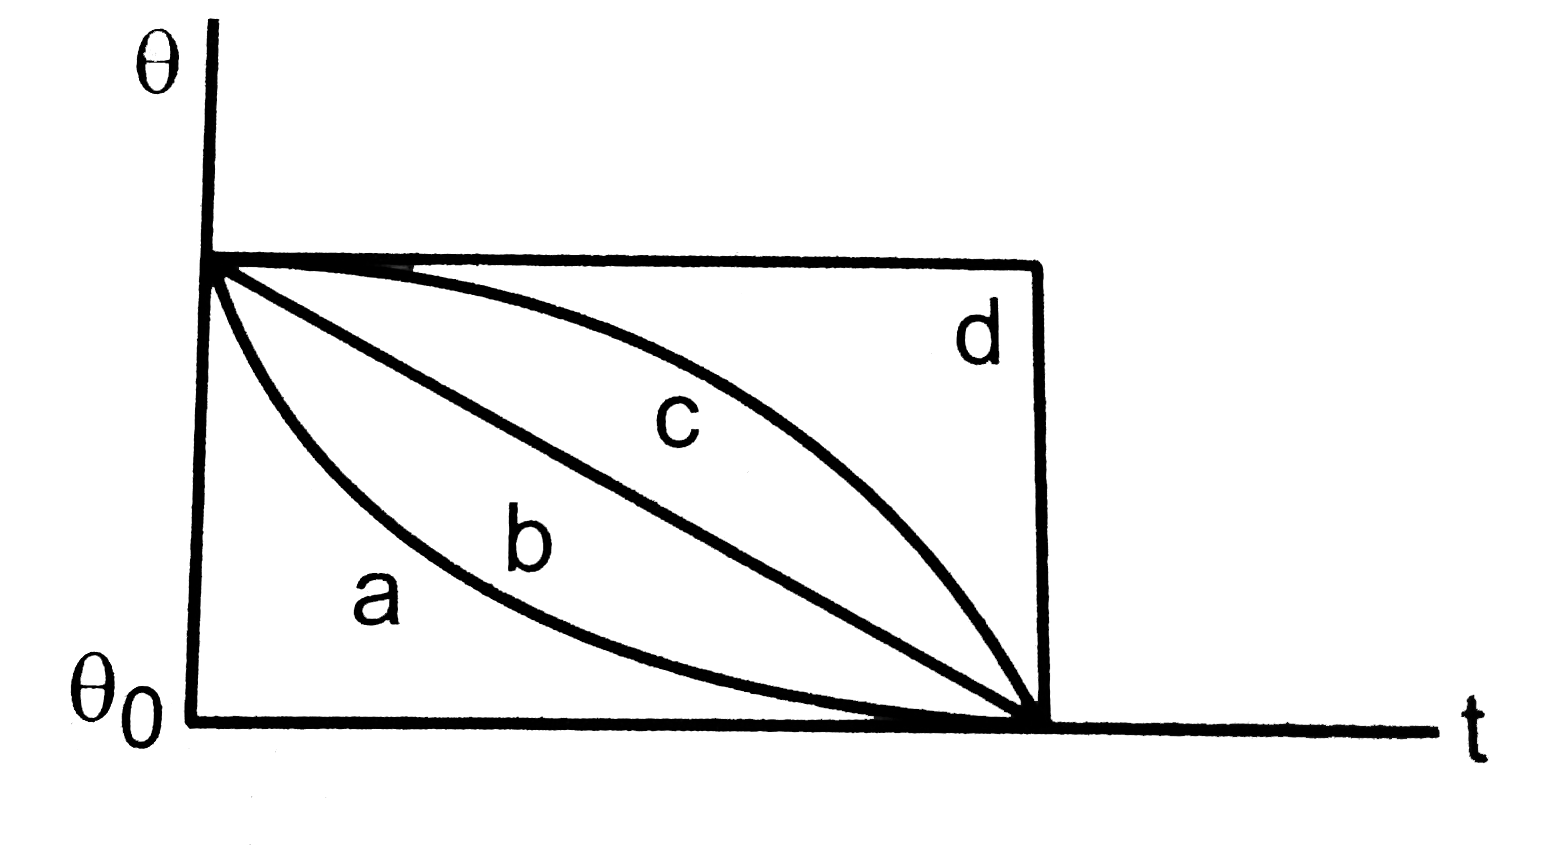
A glass tumbler containing hot water is kept in the freezer compartment of a refrigerator (temperature <0∘C). If you could measure the temperature of the content of the tumbler , which of the following graphs would correctly represent the change in its temperature as a function of time.
The correct Answer is:A
Figure (a) represents the change of temperature with time correctly. The temperature of water first decreases up to zero degree celcius, then remains constant for some time (till the ice is formed), then again starts decreasing.
Similar Questions
A student heats a beaker containing ice and water. He measures the temperature of the content of the beaker as a function of lime. Which of the following would correctly represent the result ? Justify your choice .
 View Solution
A hot liquid is kept in a big room. Its temperature is plotted as a function of time. Which of the following curves may represent the plot?
 View Solution
Knowledge Check
- Question 1 - Select One
A block of ice, initially at −20∘C, is heated a steady rate until the temperature of the sample reaches 120∘C. Which of the following graphs best illustrates the temperature of the sample as a function of time?
A B
B C
C D
D
- Question 2 - Select One
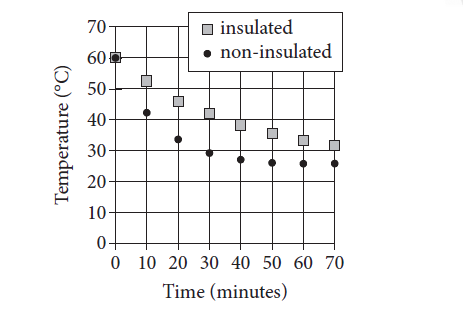
Two samples of water of equal mass are heated to 60 degrees Celsius (°C). One sample is poured into an insulated container, and the other sample is poured into a non-insulated container. The samples are then left for 70 minutes to cool in a room having a temperature of 25°C. The graph above shows the temperature of each sample at 10-minute intervals. Which of the following statements correctly compares the average rates at which the temperatures of the two samples change?AIn every 10-minute interval, the magnitude of the rate of change of temperature of the insulated sample is greater than that of the non-insulated sample.BIn every 10-minute interval, the magnitude of the rate of change of temperature of the non-insulated sample is greater than that of the insulated sample.CIn the intervals from 0 to 10 minutes and from 10 to 20 minutes, the rates of change of temperature of the insulated sample are of greater magnitude, whereas in the intervals from 40 to 50 minutes and from 50 to 60 minutes, the rates of change of temperature of the non-insulated sample are of greater magnitude.DIn the intervals from 0 to 10 minutes and from 10 to 20 minutes, the rates of change of temperature of the non-insulated sample are of greater magnitude, whereas in the intervals from 40 to 50 minutes and from 50 to 60 minutes, the rates of change of temperature of the insulated sample are of greater magnitude.
A given mass of water is cooled from 10∘C to 0∘C. State the volume changes observed. Represent these changes on a temperature volume graph.
View SolutionThe figure given below shows three glass chambers that are connected by valves of negligible volume. At the outset of an experiment, the valves are closed and the chambers contain the gases as detailed in the diagram. All the chambers are at the temperature of 300K and external pressure of 1.0atm.
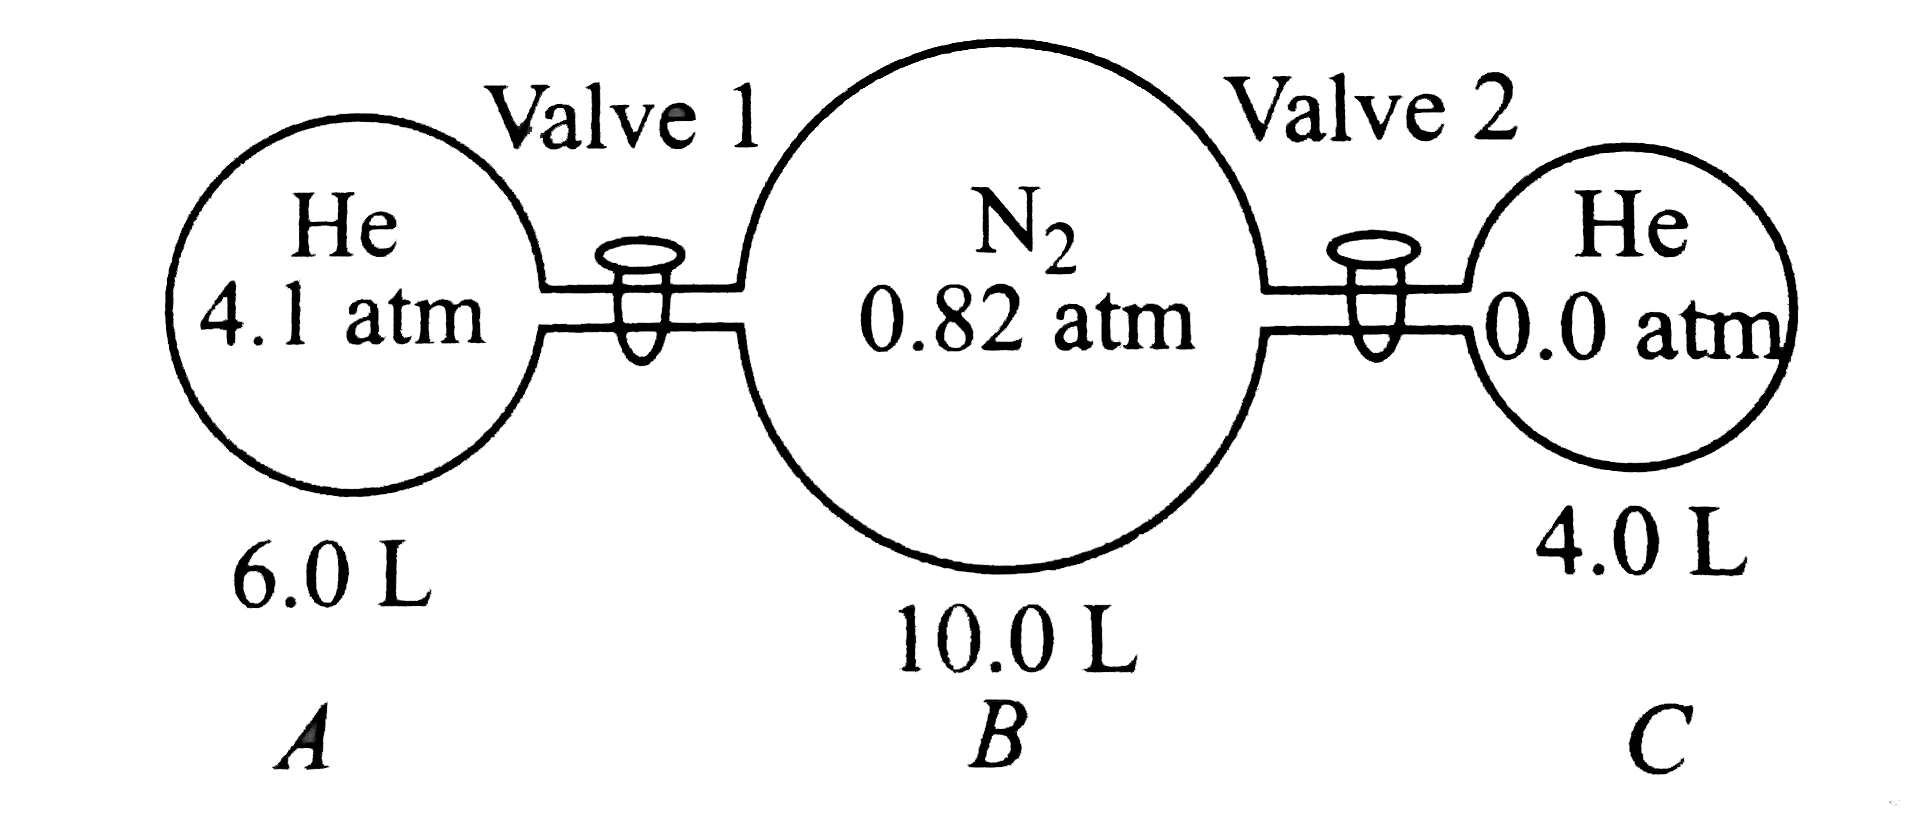
Which of the following represents the total kinetic energy of all the gas molecules after both valves are opened?
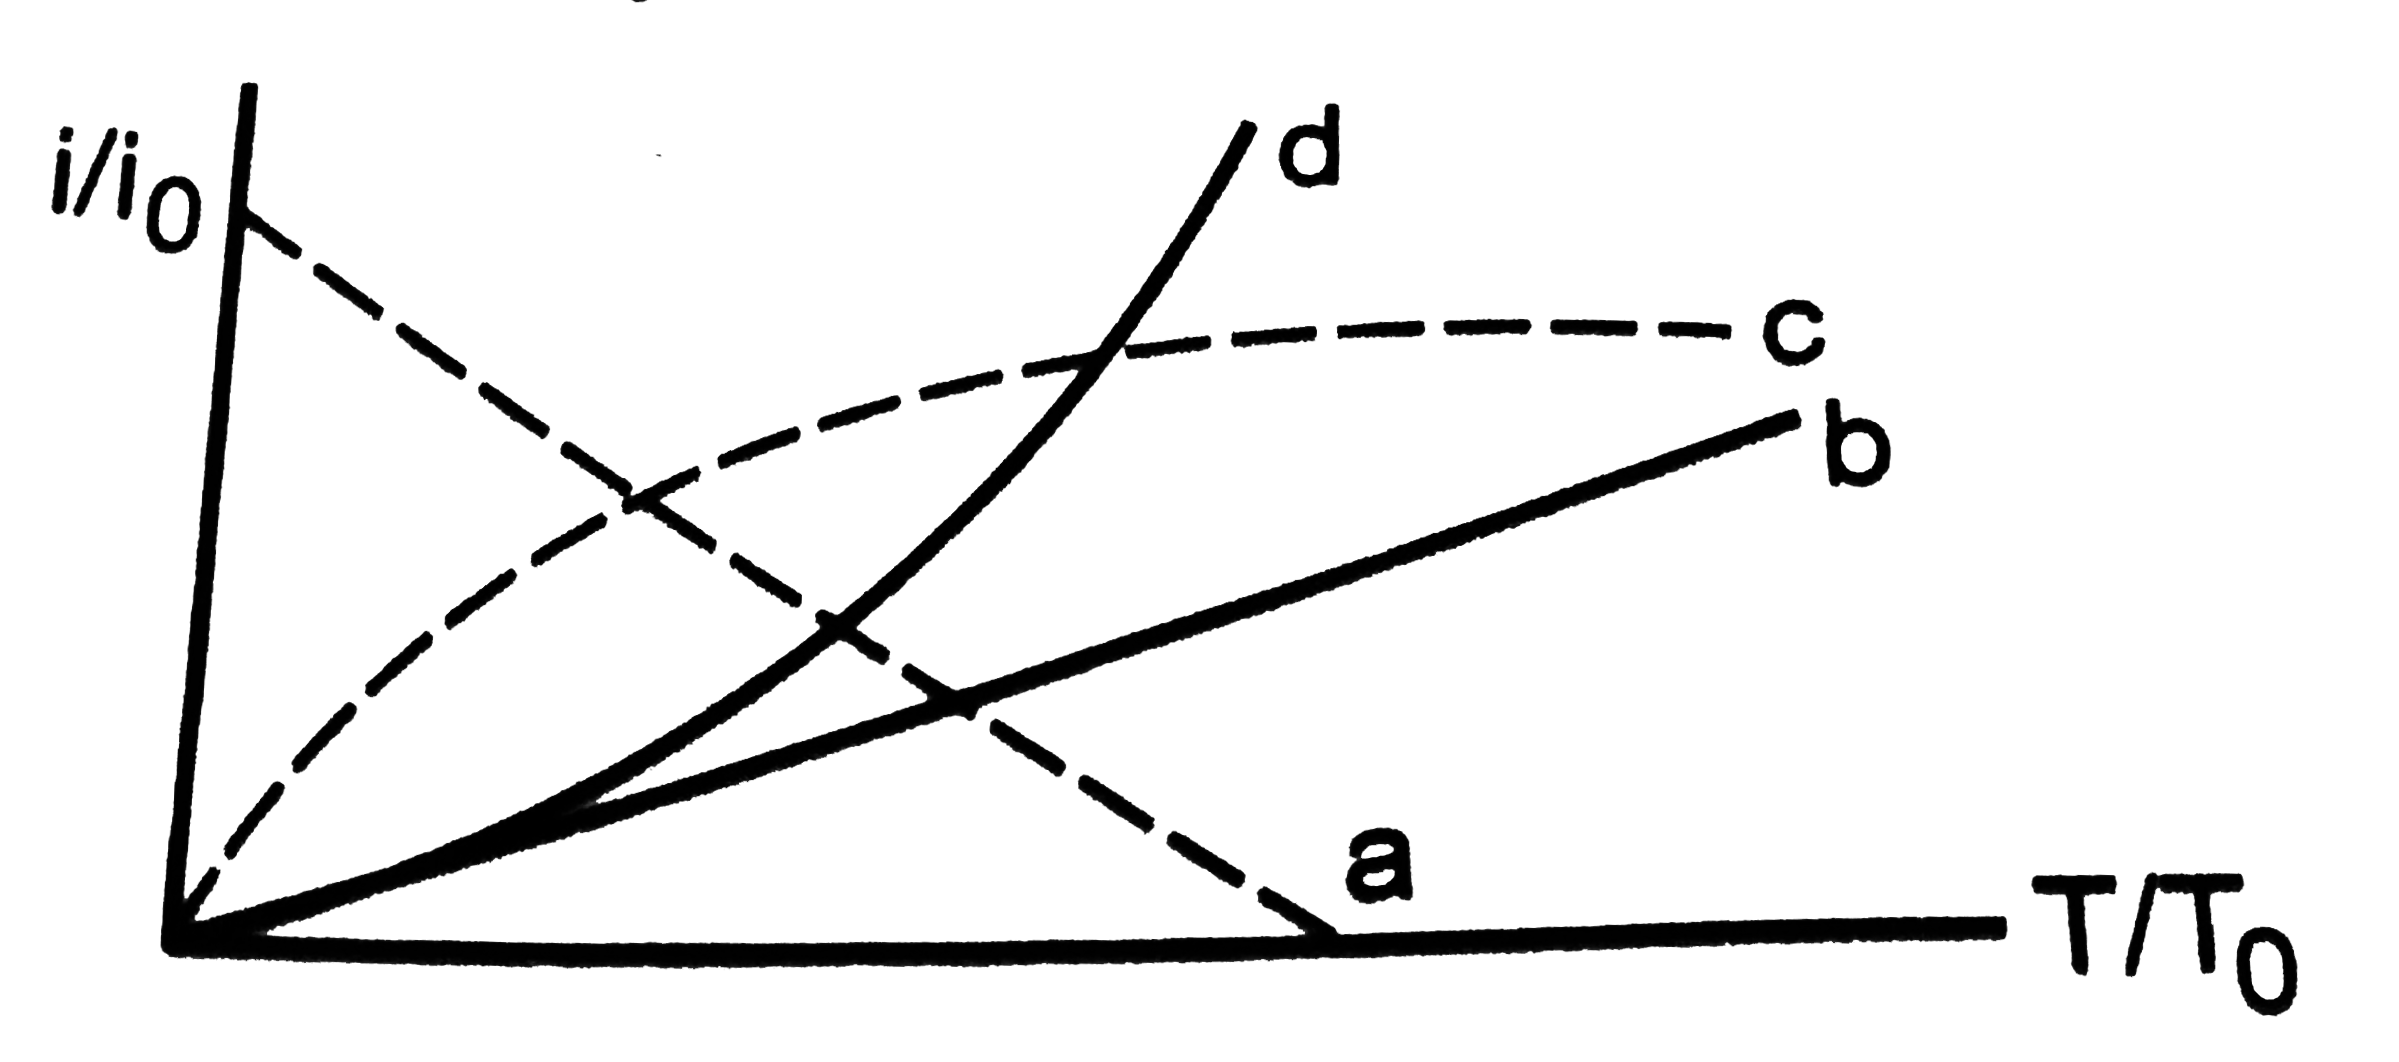
(R=0.082atmLK−1mol−1=8.314JK_1mol−1)View SolutionLet i0 be the thermionic current from a metal surface when the absolute temperature of the surface is T0. The temperature is slowly increased and the thermionic current is measured as a function of temperature. Which of the following plots may represent the variation in (ii0) against (TT0) ?
 View Solution
A hot liquid is kept in a big room. According to Newton's law of cooling rate of cooling liquid (represented as y) is plotted against its temperature T. Which of the following curves may represent the plot?
View SolutionElectrical resistance of certain materials, known as superconductors, changes abruptly from a nonzero value of zero as their temperature is lowered below a critical temperature TC(0). An interesting property of super conductors is that their critical temperature becomes smaller than TC(0) if they are placed in a magnetic field, i.e., the critical temperature TC(B) is a function of the magnetic field strength B. The dependence of TC(B) on B is shown in the figure.
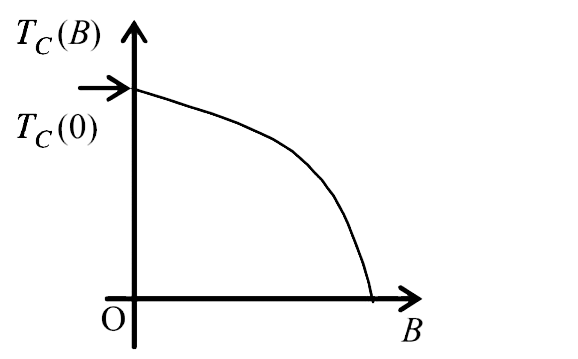 .
.
In the graphs below, the resistance R of a superconductor is shown as a function of its temperature T for two different magnetic fields B1(solid line) and B2 (dashed line). If B2 is larget than B1 which of the following graphs shows the correct variation of R with T in these fields?View SolutionThe rate of reaction increases isgnificantly with increase in temperature. Generally, rate of reactions are doubled for every 10∘C rise in temperature. Temperature coefficient gives us an idea about the change in the rate of a reaction for every 10∘C change in temperature.
Temperature coefficient(μ)=Rate constant of(T+10)∘CRate constant atT∘C
Arrhenius gave an equation which describes aret constant k as a function of temperature
k=Ae−Ea/RT
where k is the rate constant, A is the frequency factor or pre-exponential factor, Ea is the activation energy, T is the temperature in kelvin, R is the universal gas constant.
Equation when expressed in logarithmic form becomes
logk=logA−Ea2.303RT
For a reaction Ea=0 and k=3.2×10⁸s−1 at 325K. The value of k at 335K would beView Solution
