A hot liquid is kept in a big room. According to Newton's law of cooling rate of cooling liquid (represented as y) is plotted against its temperature T. Which of the following curves may represent the plot?


The correct Answer is:B
To solve the problem, we will analyze the situation using Newton's Law of Cooling, which states that the rate of cooling of an object is proportional to the difference in temperature between the object and its surroundings.
1. Understanding Newton's Law of Cooling:
According to Newton's Law of Cooling, the rate of change of temperature of the hot liquid (denoted as y) is given by:
dTdt=−k(T−Ts)
where:
- T is the temperature of the liquid,
- Ts is the surrounding temperature (constant),
- k is a positive constant.
2. Rearranging the Equation:
We can rearrange the equation to express the rate of cooling y in terms of the temperature T:
y=−k(T−Ts)
This can be rewritten as:
y=−kT+kTs
This equation is in the form of a linear equation y=mx+c, where:
- m=−k (the slope),
- c=kTs (the y-intercept).
3. Analyzing the Graph:
- The slope m is negative, indicating that as the temperature T increases, the rate of cooling y decreases.
- The y-intercept c is positive since kTs is positive (assuming Ts is a positive temperature).
4. Identifying the Correct Curve:
- Since the relationship is linear with a negative slope, the graph will be a straight line that slopes downwards from left to right.
- The line will intersect the y-axis at a positive value (the y-intercept) and will extend downwards as T increases.
5. Conclusion:
Based on the analysis, the correct curve that represents the plot of the rate of cooling y against the temperature T is a straight line with a negative slope that intersects the y-axis at a positive value.
According to Newton's Law of Cooling, the rate of change of temperature of the hot liquid (denoted as y) is given by:
dTdt=−k(T−Ts)
where:
- T is the temperature of the liquid,
- Ts is the surrounding temperature (constant),
- k is a positive constant.
We can rearrange the equation to express the rate of cooling y in terms of the temperature T:
y=−k(T−Ts)
This can be rewritten as:
y=−kT+kTs
This equation is in the form of a linear equation y=mx+c, where:
- m=−k (the slope),
- c=kTs (the y-intercept).
- The slope m is negative, indicating that as the temperature T increases, the rate of cooling y decreases.
- The y-intercept c is positive since kTs is positive (assuming Ts is a positive temperature).
- Since the relationship is linear with a negative slope, the graph will be a straight line that slopes downwards from left to right.
- The line will intersect the y-axis at a positive value (the y-intercept) and will extend downwards as T increases.
Based on the analysis, the correct curve that represents the plot of the rate of cooling y against the temperature T is a straight line with a negative slope that intersects the y-axis at a positive value.
Topper's Solved these Questions
- HEAT TRANSFERBOOK - RESONANCE ENGLISHCHAPTER - HEAT TRANSFEREXERCISE - Exercise-2
1 Videos
- HEAT TRANSFERBOOK - RESONANCE ENGLISHCHAPTER - HEAT TRANSFEREXERCISE - Exercise-3
1 Videos
- HEAT TRANSFERBOOK - RESONANCE ENGLISHCHAPTER - HEAT TRANSFEREXERCISE - Exercise-1
1 Videos
- GRAVITATIONBOOK - RESONANCE ENGLISHCHAPTER - GRAVITATIONEXERCISE - Exercise
21 Videos
- KINEMATICSBOOK - RESONANCE ENGLISHCHAPTER - KINEMATICSEXERCISE - Exercise
65 Videos
Similar Questions
Knowledge Check
A hot liquid is kept in a bog room. Accoding to Newton's law of cooling rate of cooling liquid (represented as y) is plotted against its temperature T. Which of the following curves may represent the plot?
A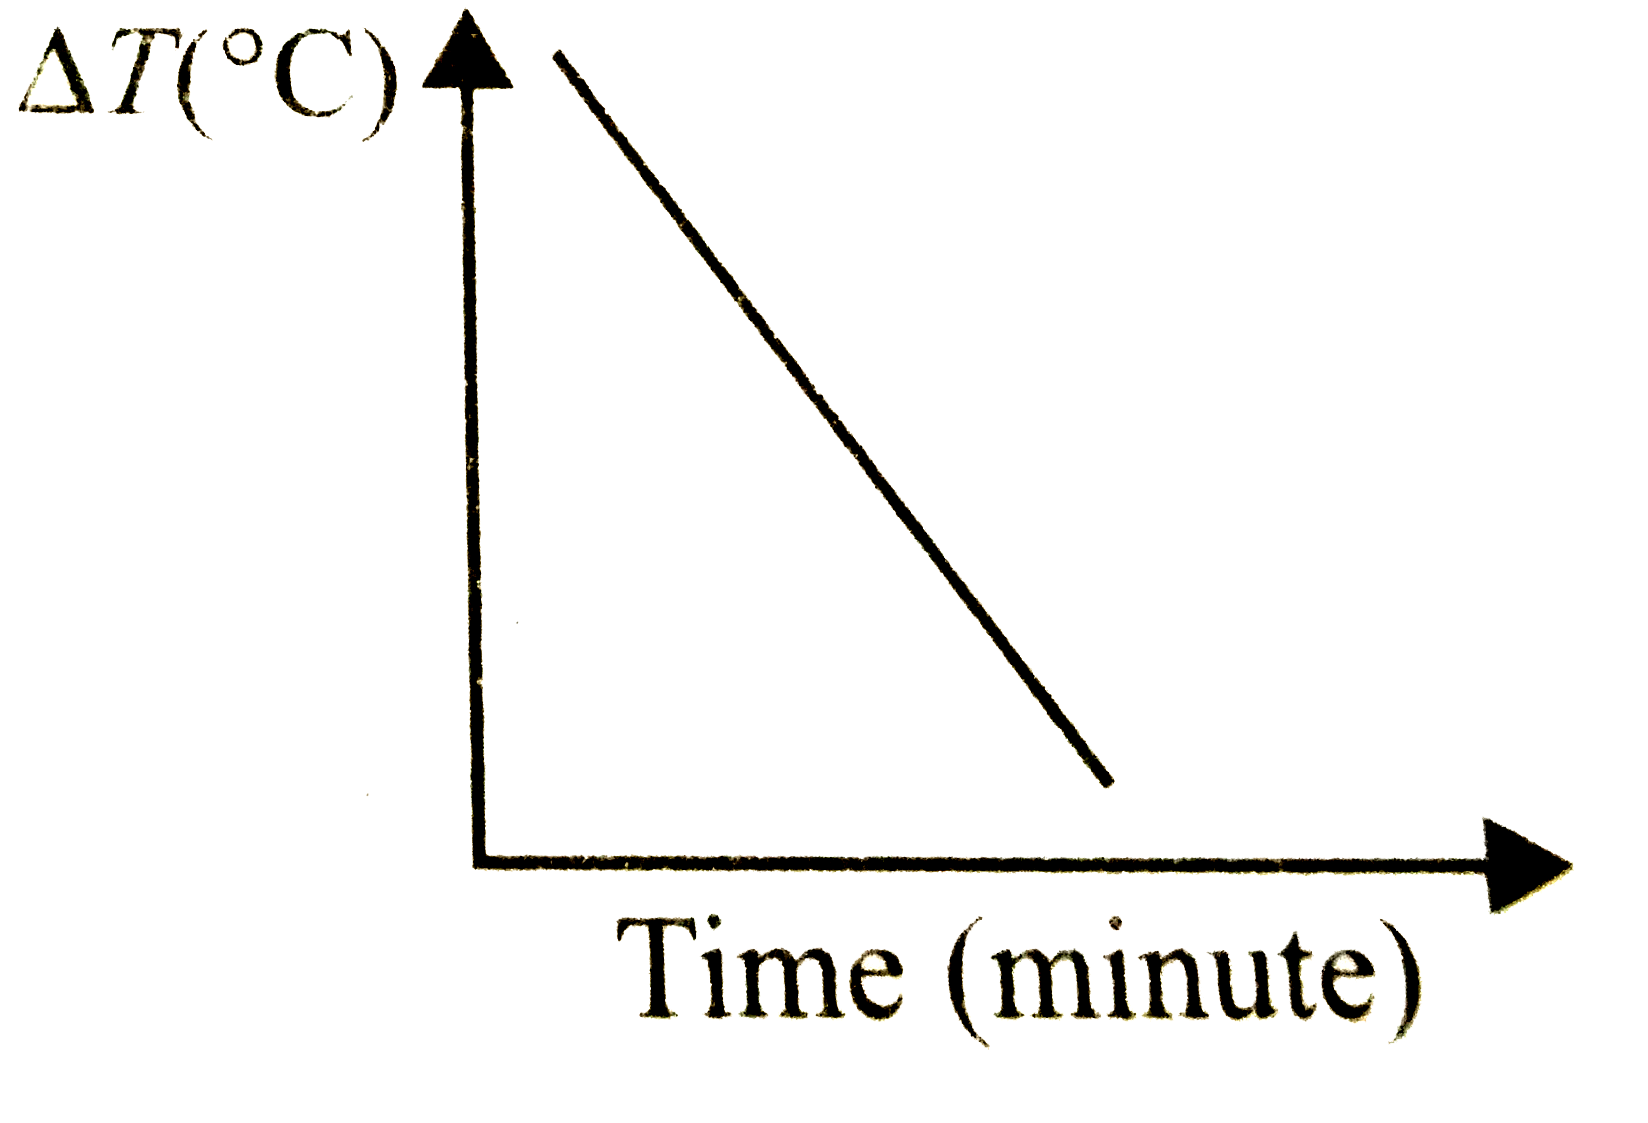 B
B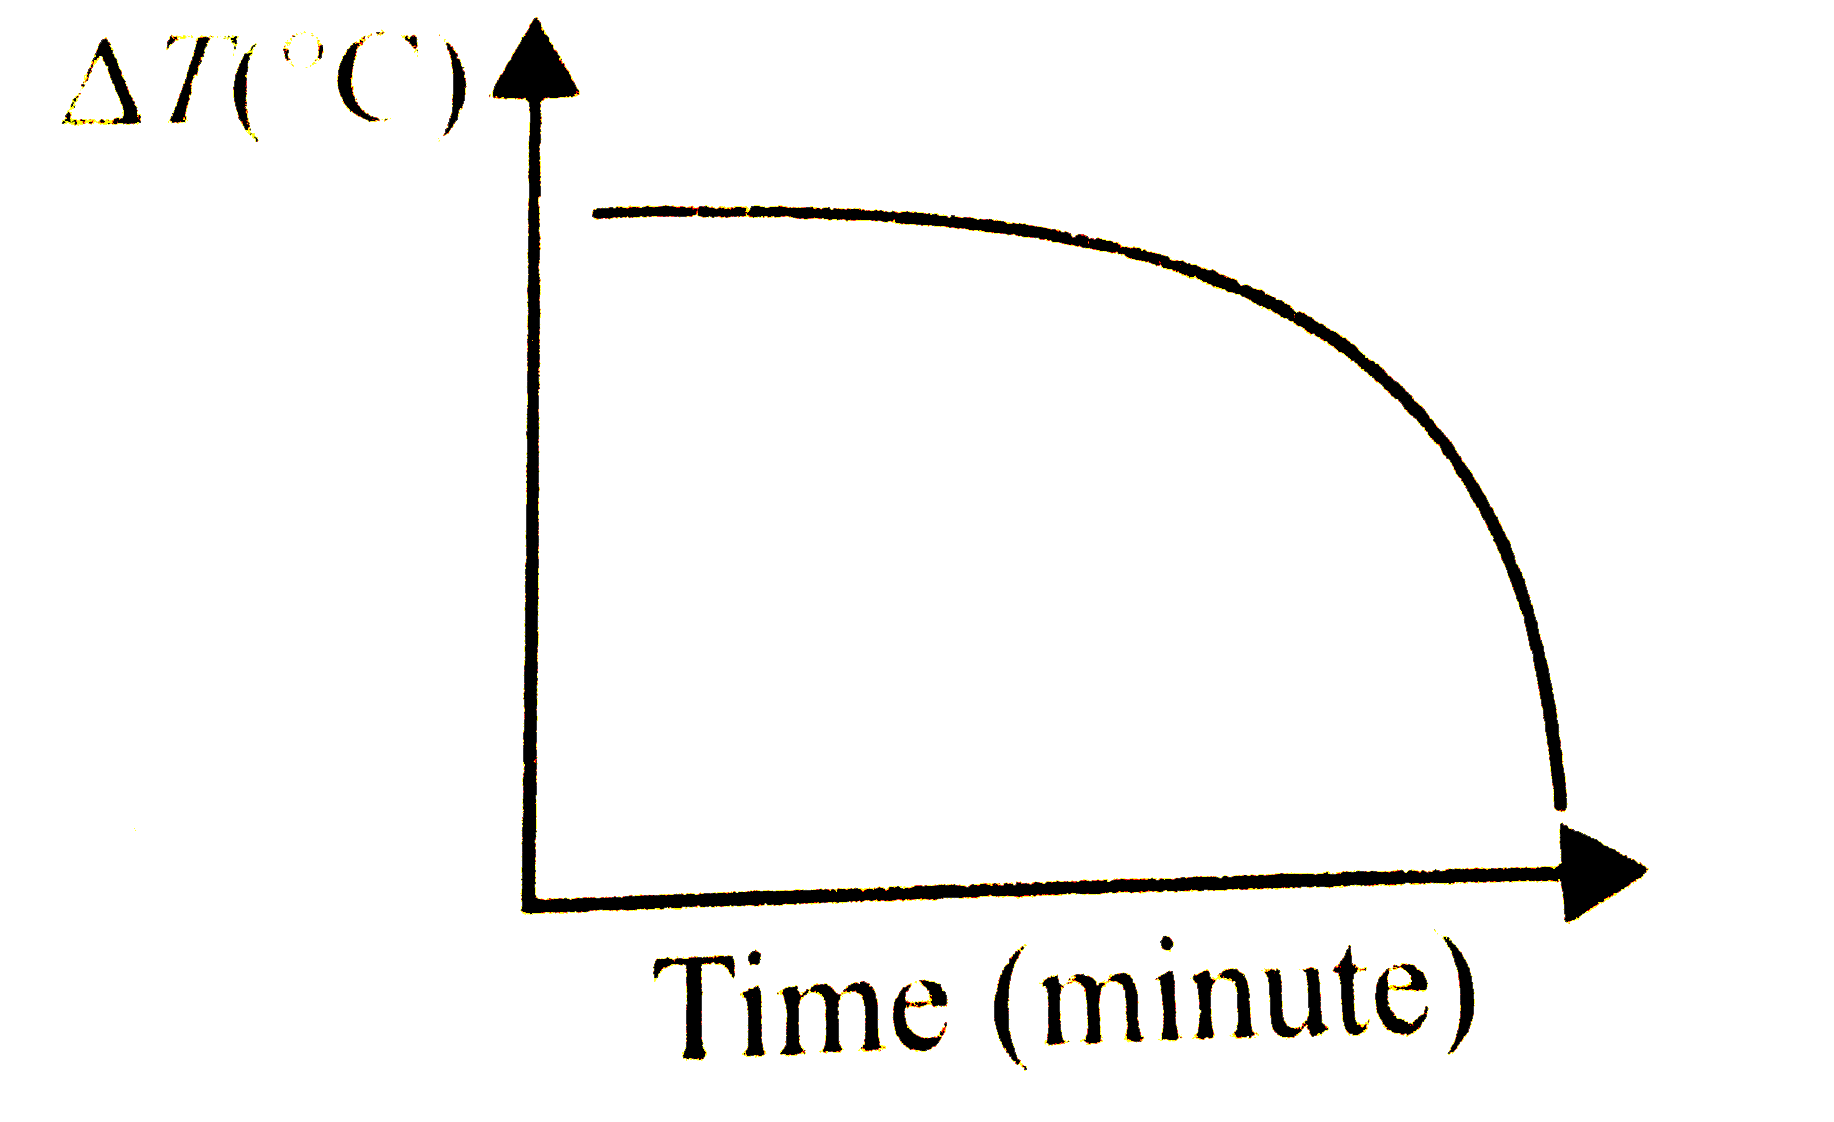 C
C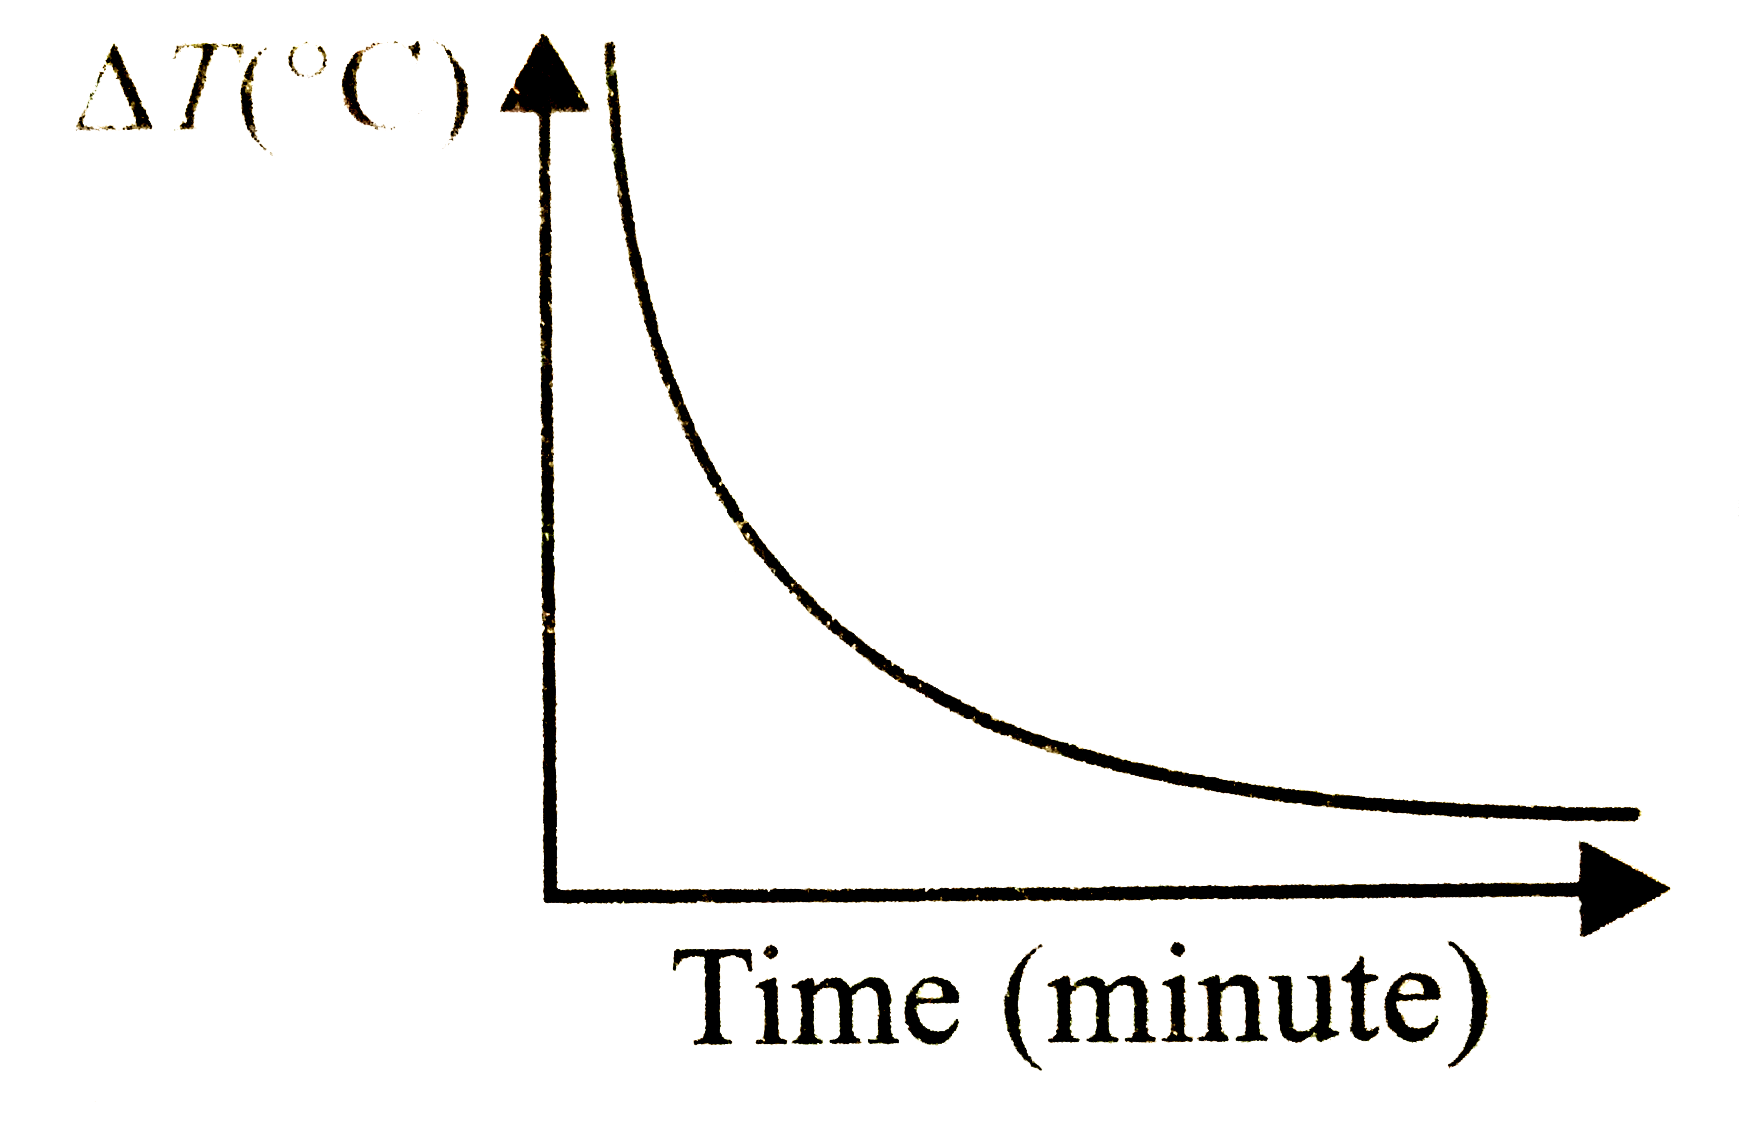 D
D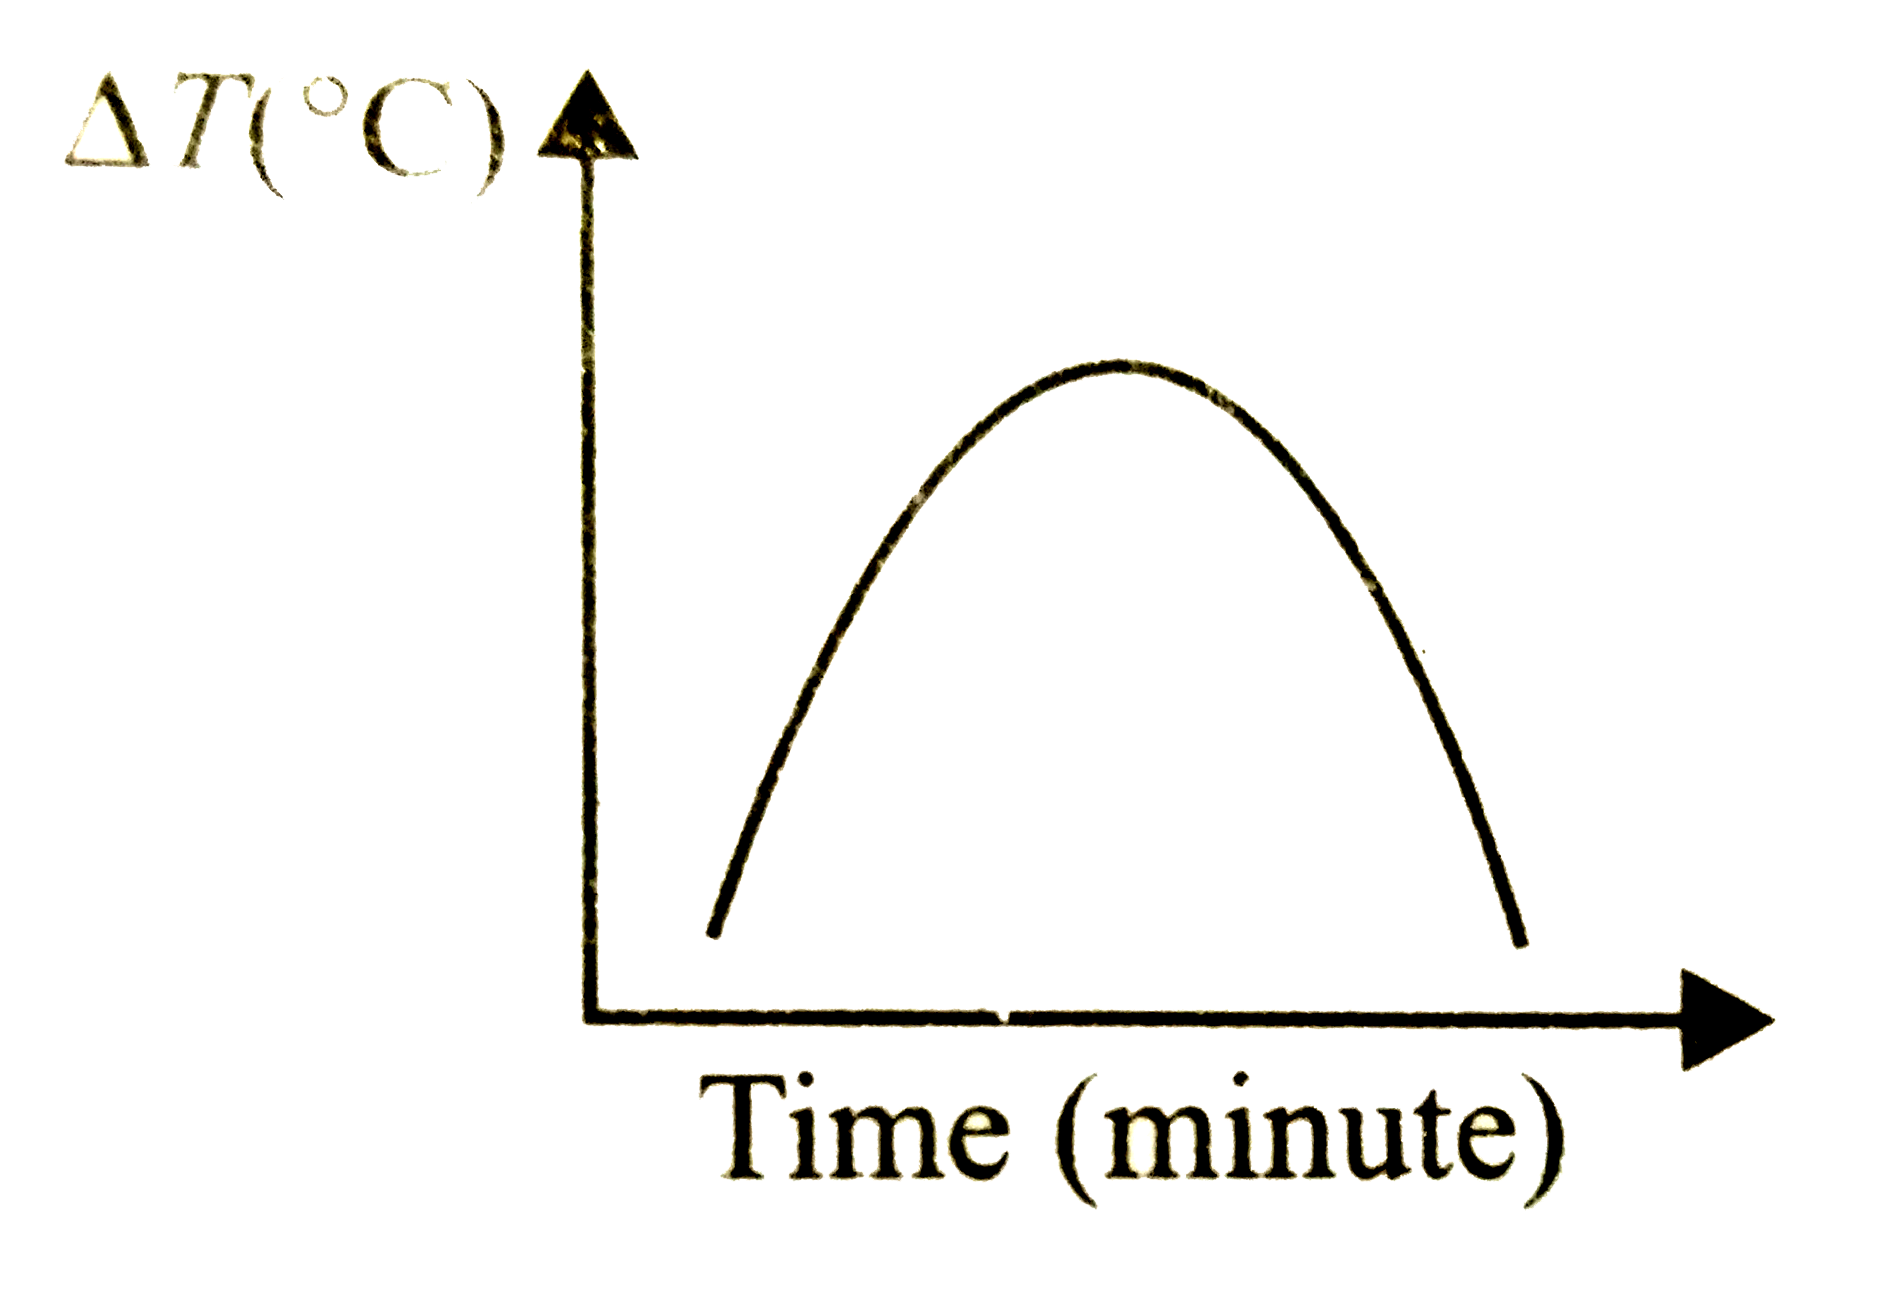
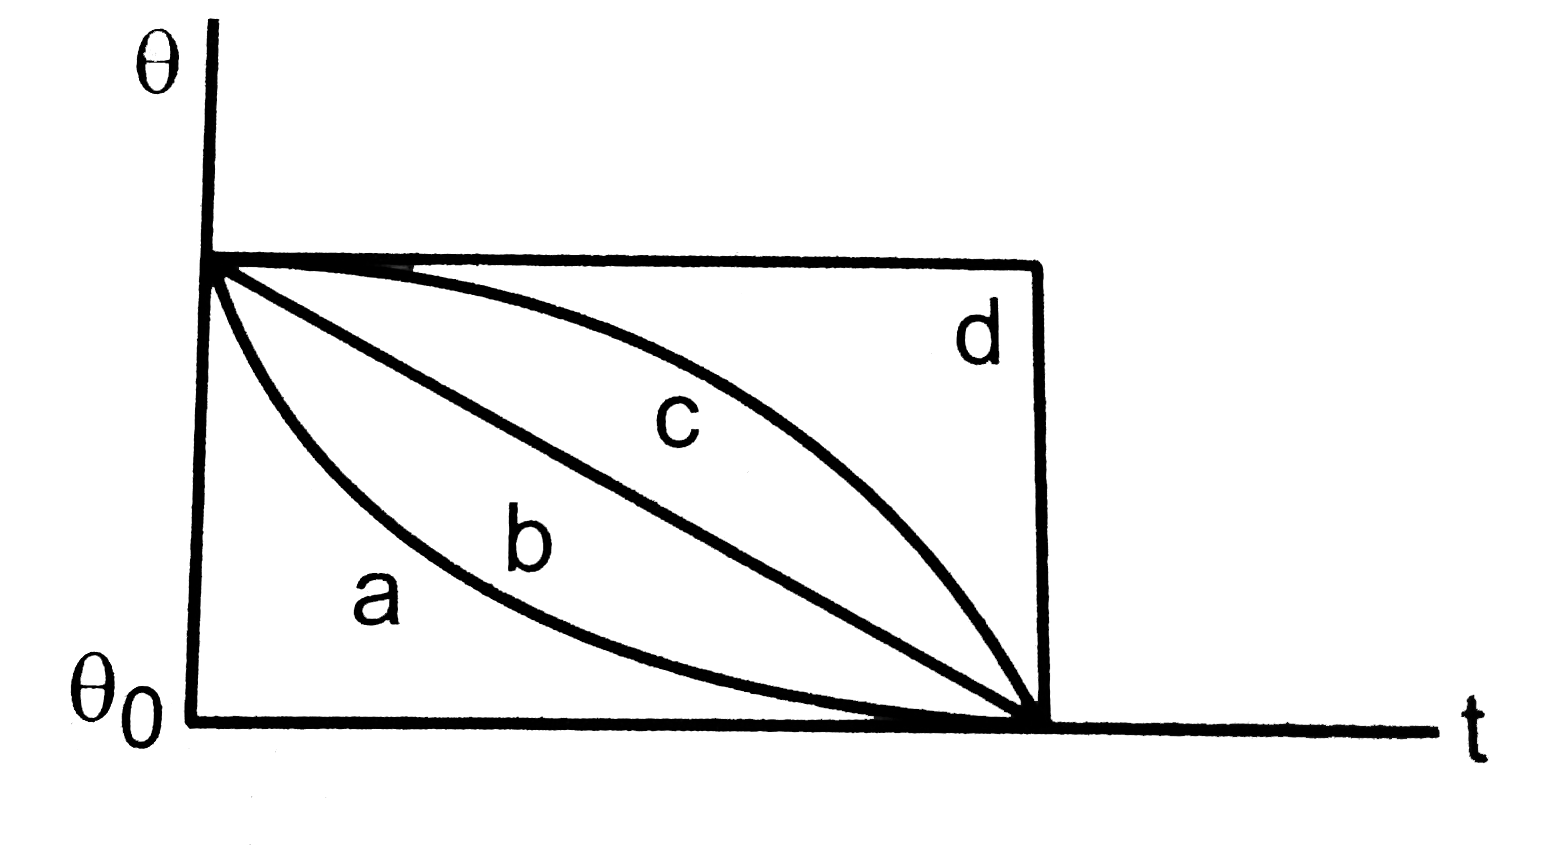
A hot liquid is kept in a big room. Its temperature is plotted as a function of time. Which of the following curves may represent the plot?
View SolutionRate of reaction (r ) is plotted against temperature (T) for an enzyme catalysed reaction. Which of the following is correct representation ?
View SolutionA cooling curve is plotted between the temperature of a hot body and time. Which of the following is not true for the cooling curve?
View SolutionA hot liquid is kept in a big room. The logarithm of the numerical value of the temperature difference between the liquid and the room is plotted against time. the plot will be very nearly
View SolutionA piece of cork starts from rest at the bottom of a lake and floats up. Its velocity v is plotted against time t. Which of the following best represents the resulting curve?
_S01_061_Q01.png)
View SolutionA piece of cork starts from rest at the bottom of a lake and floats up. Its velocity v is plotted against time t. Which of the following best represents the resulting curve?
_S01_061_Q01.png)
View SolutionA hot body placed in air is cooled down according to Newton's law of cooling, the rate of decrease of temperature being k times the temperature difference from the surrounding. Starting from t=0 , find the time in which the body will loss half the maximum heat it can lose.
View Solution
