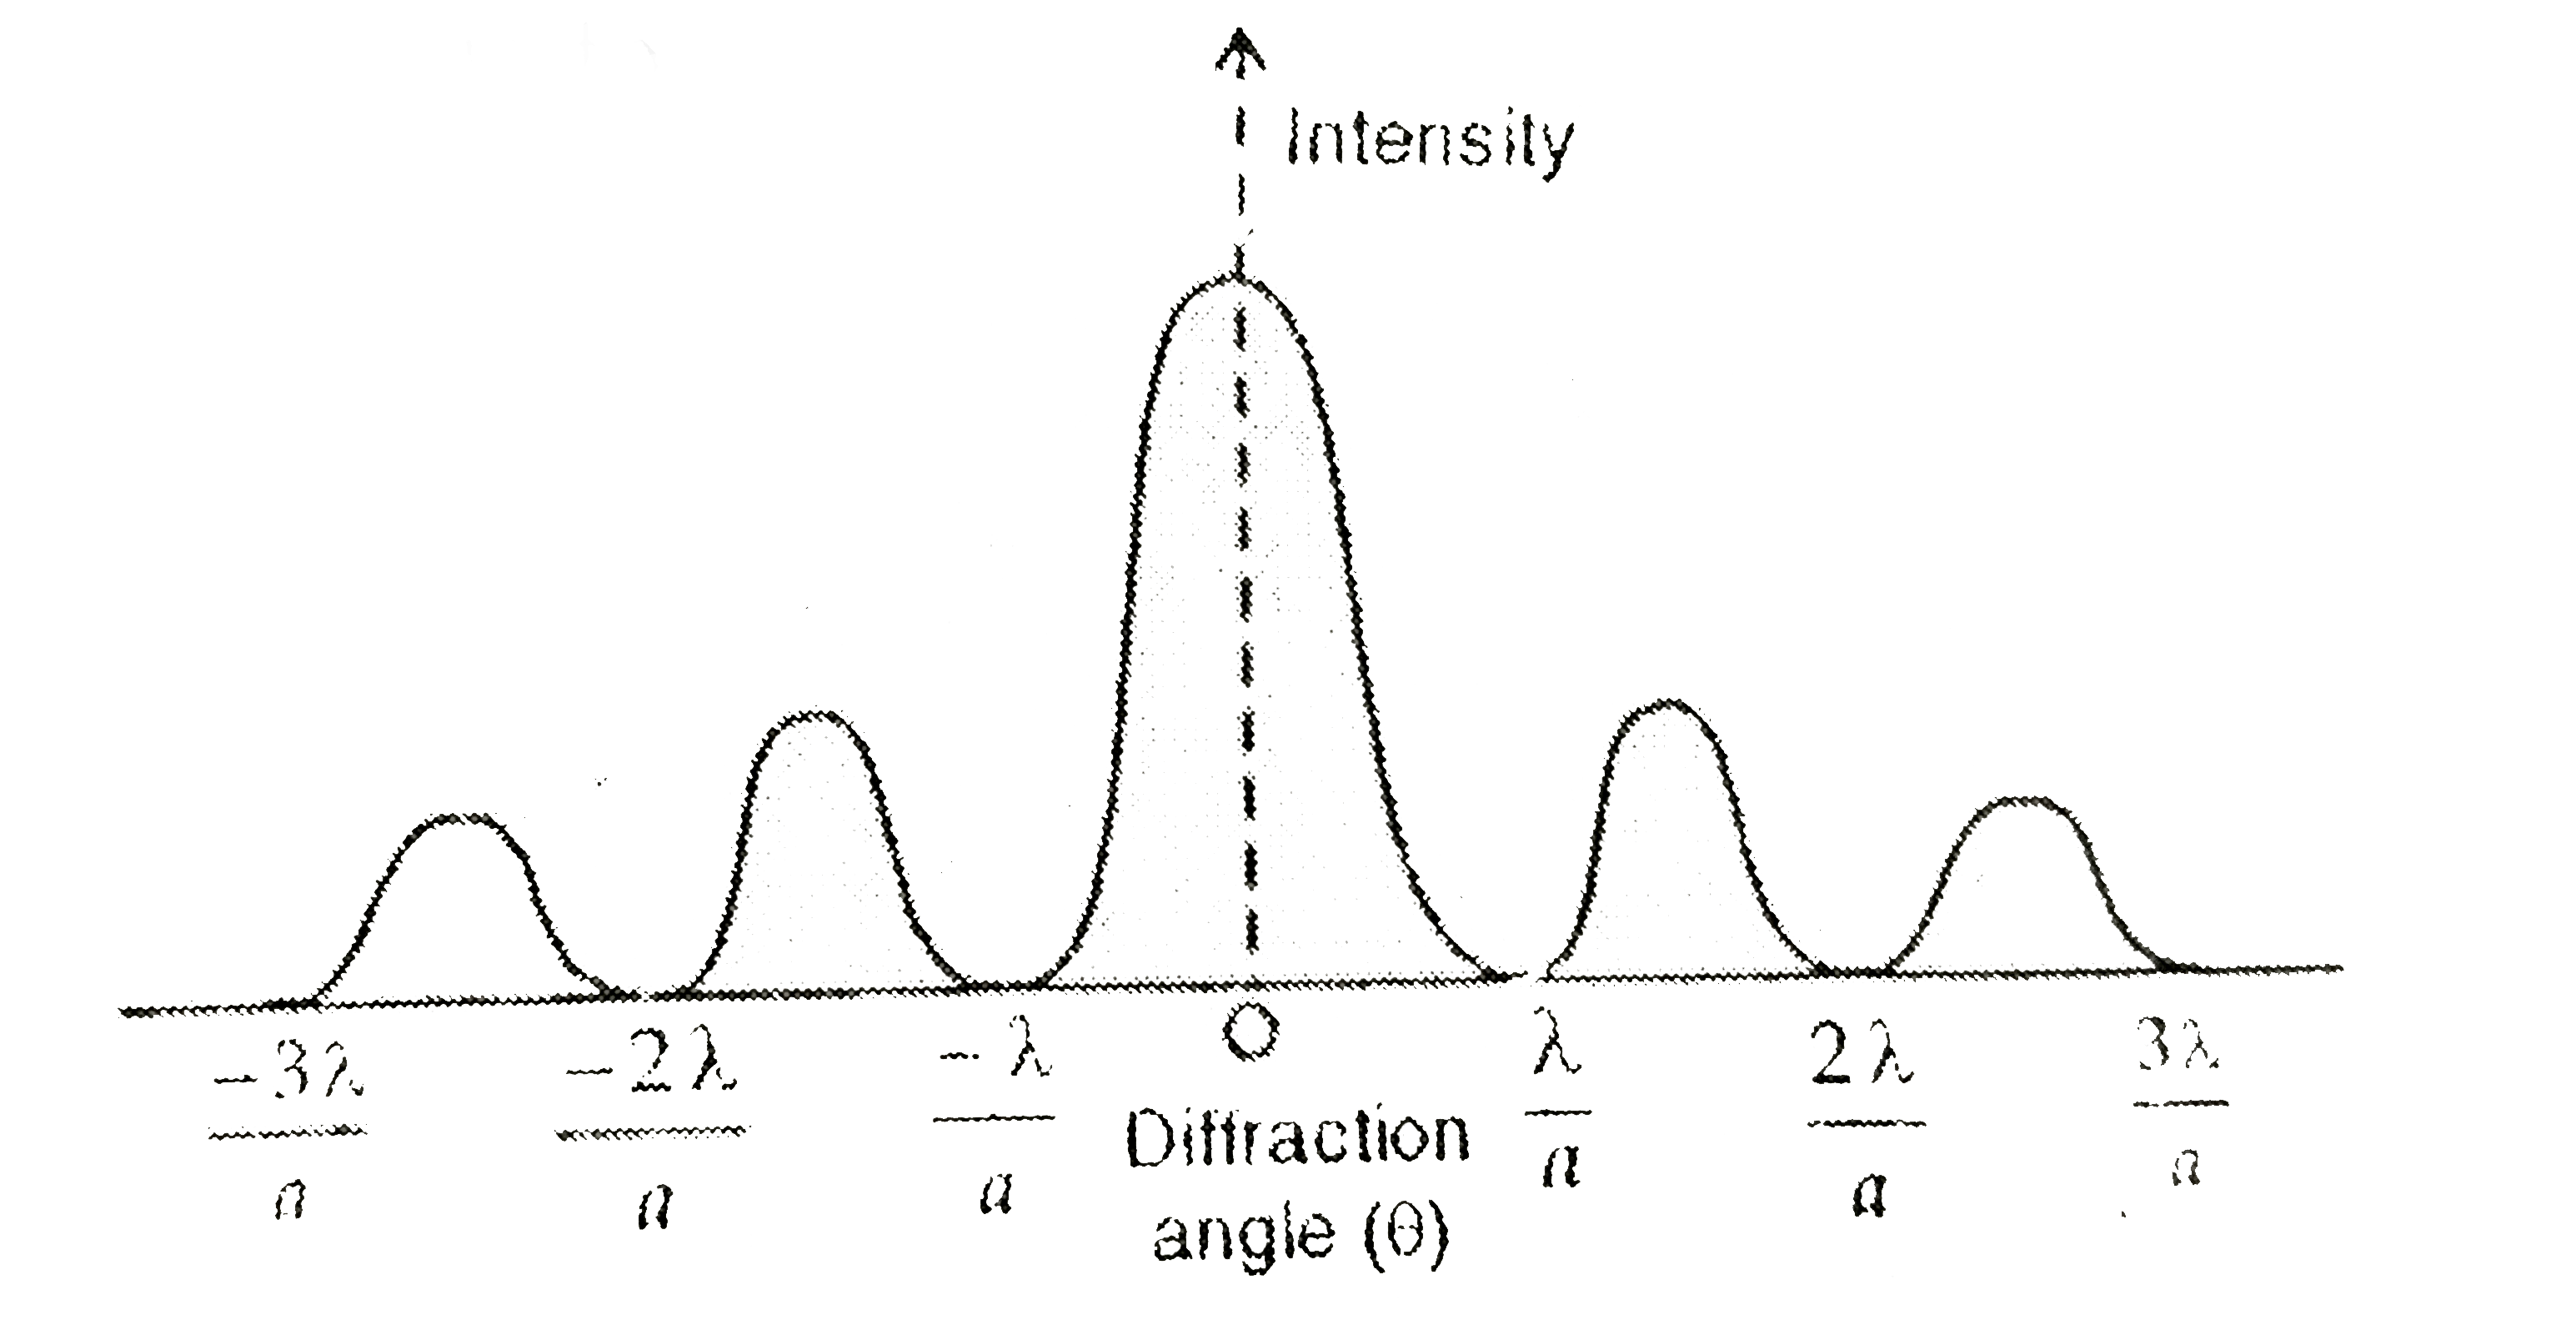
Draw a labelled graph to show variation in intensity of diffracted light with angular position, in a single slit diffraction experiment.
Graph showing the intensity distribution of fringes due to diffraction at single slit.

Similar Questions
In a single slit diffraction pattern
View SolutionDraw a labelled graph of intensity of diffracted light (I) versus angle (θ) in the Fraunhofer diffraction experiment for a single slit diffraction.
View SolutionShow graphically the intensity distribution in Fraunhofer.s single slit diffraction experiment. Label the axes.
View SolutionShow graphically the intensity distribution in Fraunhofer.s single slit diffraction experiment. Label the axes.
View SolutionDraw a labelled graph showing variation of impedance of a series LCR circuit with frequency of the a.c. supply.
View SolutionDraw a labelled graph showing variation of relative intensity of X-rays versus their wavelength λ. Mark of λmin on the graph.
(ii) State how the value of λmin can be varied.View SolutionThe ratio of intensities of consecutive maxima in the diffraction pattern due to a single slit is
View SolutionDraw a labelled graph showing the variation of inductive reactance (XL) verses frequency (f)
View SolutionConsider Fraunhoffer diffraction pattern obtained with a single slit illuminated at normal incidence. At the angular position of the first diffraction minimum the phase difference (in radians) between the wavelets from the opposite edges of the slit is
View SolutionRed light is generally used to observe diffraction pattern from single slit. If blue light is used instead of red light, then diffraction pattern.
View Solution

