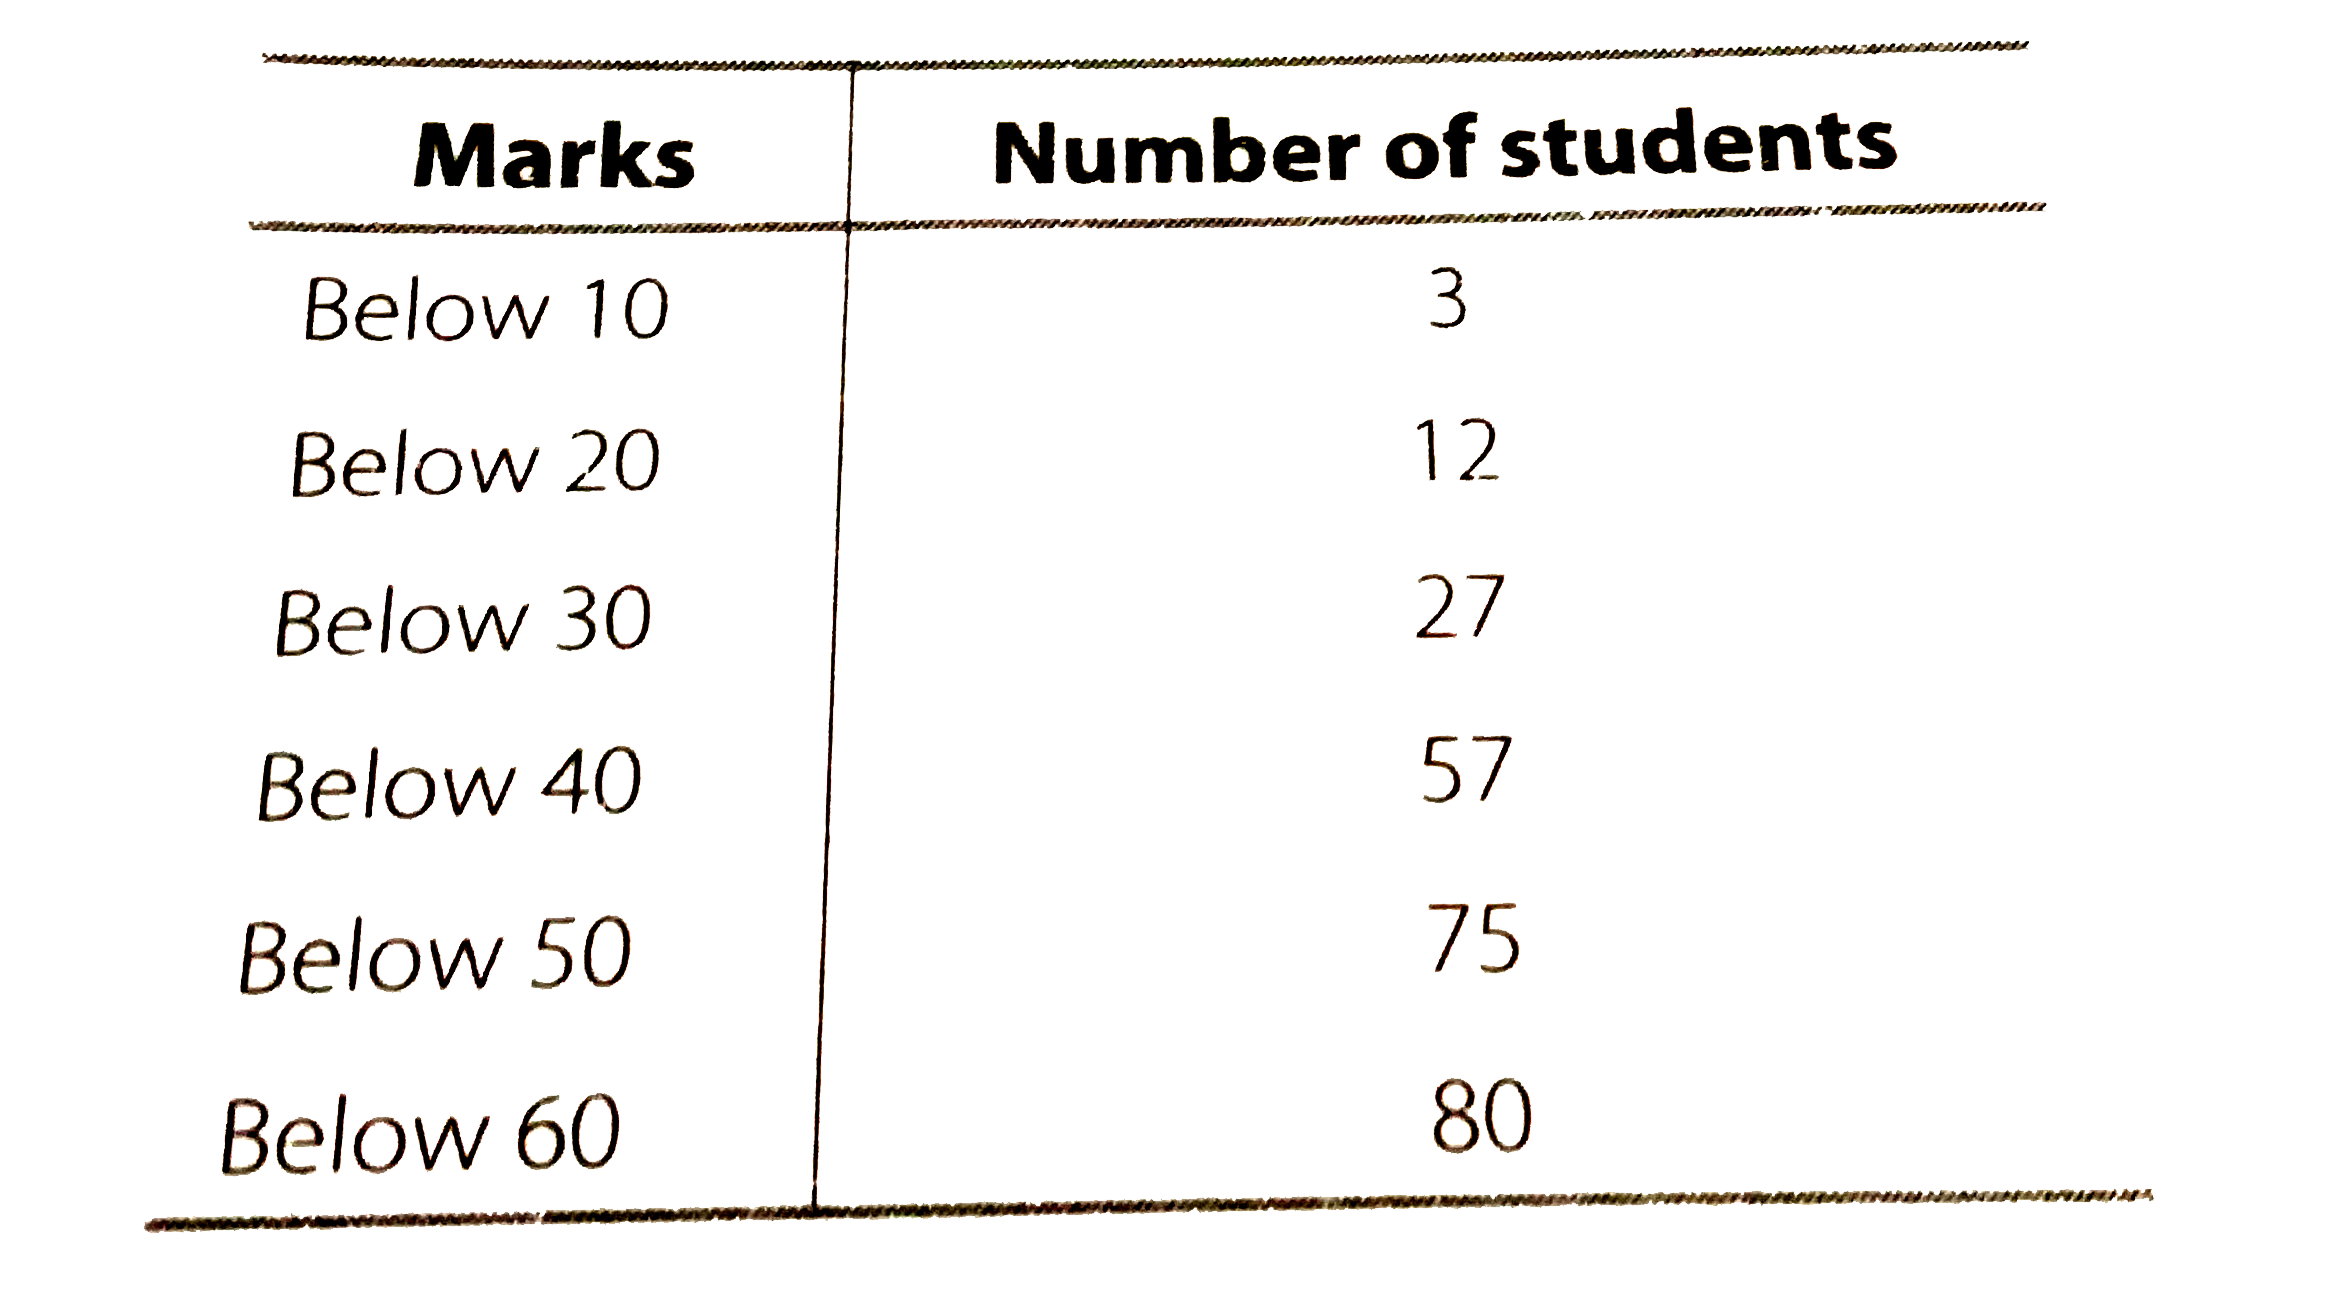
The following distribution shows the transport expenditure of 100 empolyess :

Step by step video & image solution for The following distribution shows the transport expenditure of 100 empolyess : by Maths experts to help you in doubts & scoring excellent marks in Class 10 exams.
Updated on:21/07/2023Topper's Solved these Questions
- CBSE BOARDS 2020BOOK - X BOARD PREVIOUS YEAR PAPER ENGLISHCHAPTER - CBSE BOARDS 2020EXERCISE - SECTION C
33 Videos
- CBSE BOARDS 2020BOOK - X BOARD PREVIOUS YEAR PAPER ENGLISHCHAPTER - CBSE BOARDS 2020EXERCISE - SECTION D
25 Videos
- CBSE BOARDS 2020BOOK - X BOARD PREVIOUS YEAR PAPER ENGLISHCHAPTER - CBSE BOARDS 2020EXERCISE - QUESTION
41 Videos
- SAMPLE PAPER 2019BOOK - X BOARD PREVIOUS YEAR PAPER ENGLISHCHAPTER - SAMPLE PAPER 2019EXERCISE - SECTION-C
5 Videos
Similar Questions
The following distribution shows the transport expenditure of 100 employees:
View SolutionThe following distribution shows the transport expenditure of 100 exployees :

Find the mode of the distribution.
View SolutionMode of the following distribution is

View SolutionFor the following distribution

the modal class is
View SolutionThe following table shows the expenditure of 60 boys on books. Find the mode of their expenditure:
View SolutionThe following data gives the distribution of total household expendilture ( in Rs.) of workers is a city :

Find the average expenditure which is being done by maximum number of manual workers.
View SolutionThe following data gives the distribution of total household expenditure (in rupees) of manual workers in a city: Expenditure (Rs.) Frequency Expenditure ( Rs.) Frequency 1000-1500 24 3000-3500 30 1500-2000 40 3500-4000 22 2000-2500 33 4000-4500 16 2500-3000 28 4500-5000 7 Find the average expenditure which is being done by the maximum number of manual workers.
View SolutionThe following data gives the distribution of total monthly household expenditure of 200 families of a village. Find the modal monthly expenditure of the families. Also, find the mean monthly expenditure:
View SolutionThe following table shows the sales and advertisement expenditure of a firm

Correlation coefficient = 0.9 , estimate the likely sales for a proposed expenditure of ₹ 10 crores.
View SolutionThe following table gives the distribution of total household expenditure (in rupees) of manual workers in a city. Expenditure: (in Rs.) 100-150 150-200 200-250 250-300 300-350 350-400 400-450 450-500 Frequency: 24 40 33 28 30 22 16 7 Find the average expenditure (in Rs.) per household.
View Solution
