Following are the marks obtained by 9 student in a mathematics test
50,69,20,33,53,39,40,65,59,
The mean deviation from the median is
9
10.5
12.67
14.76
The correct Answer is:C
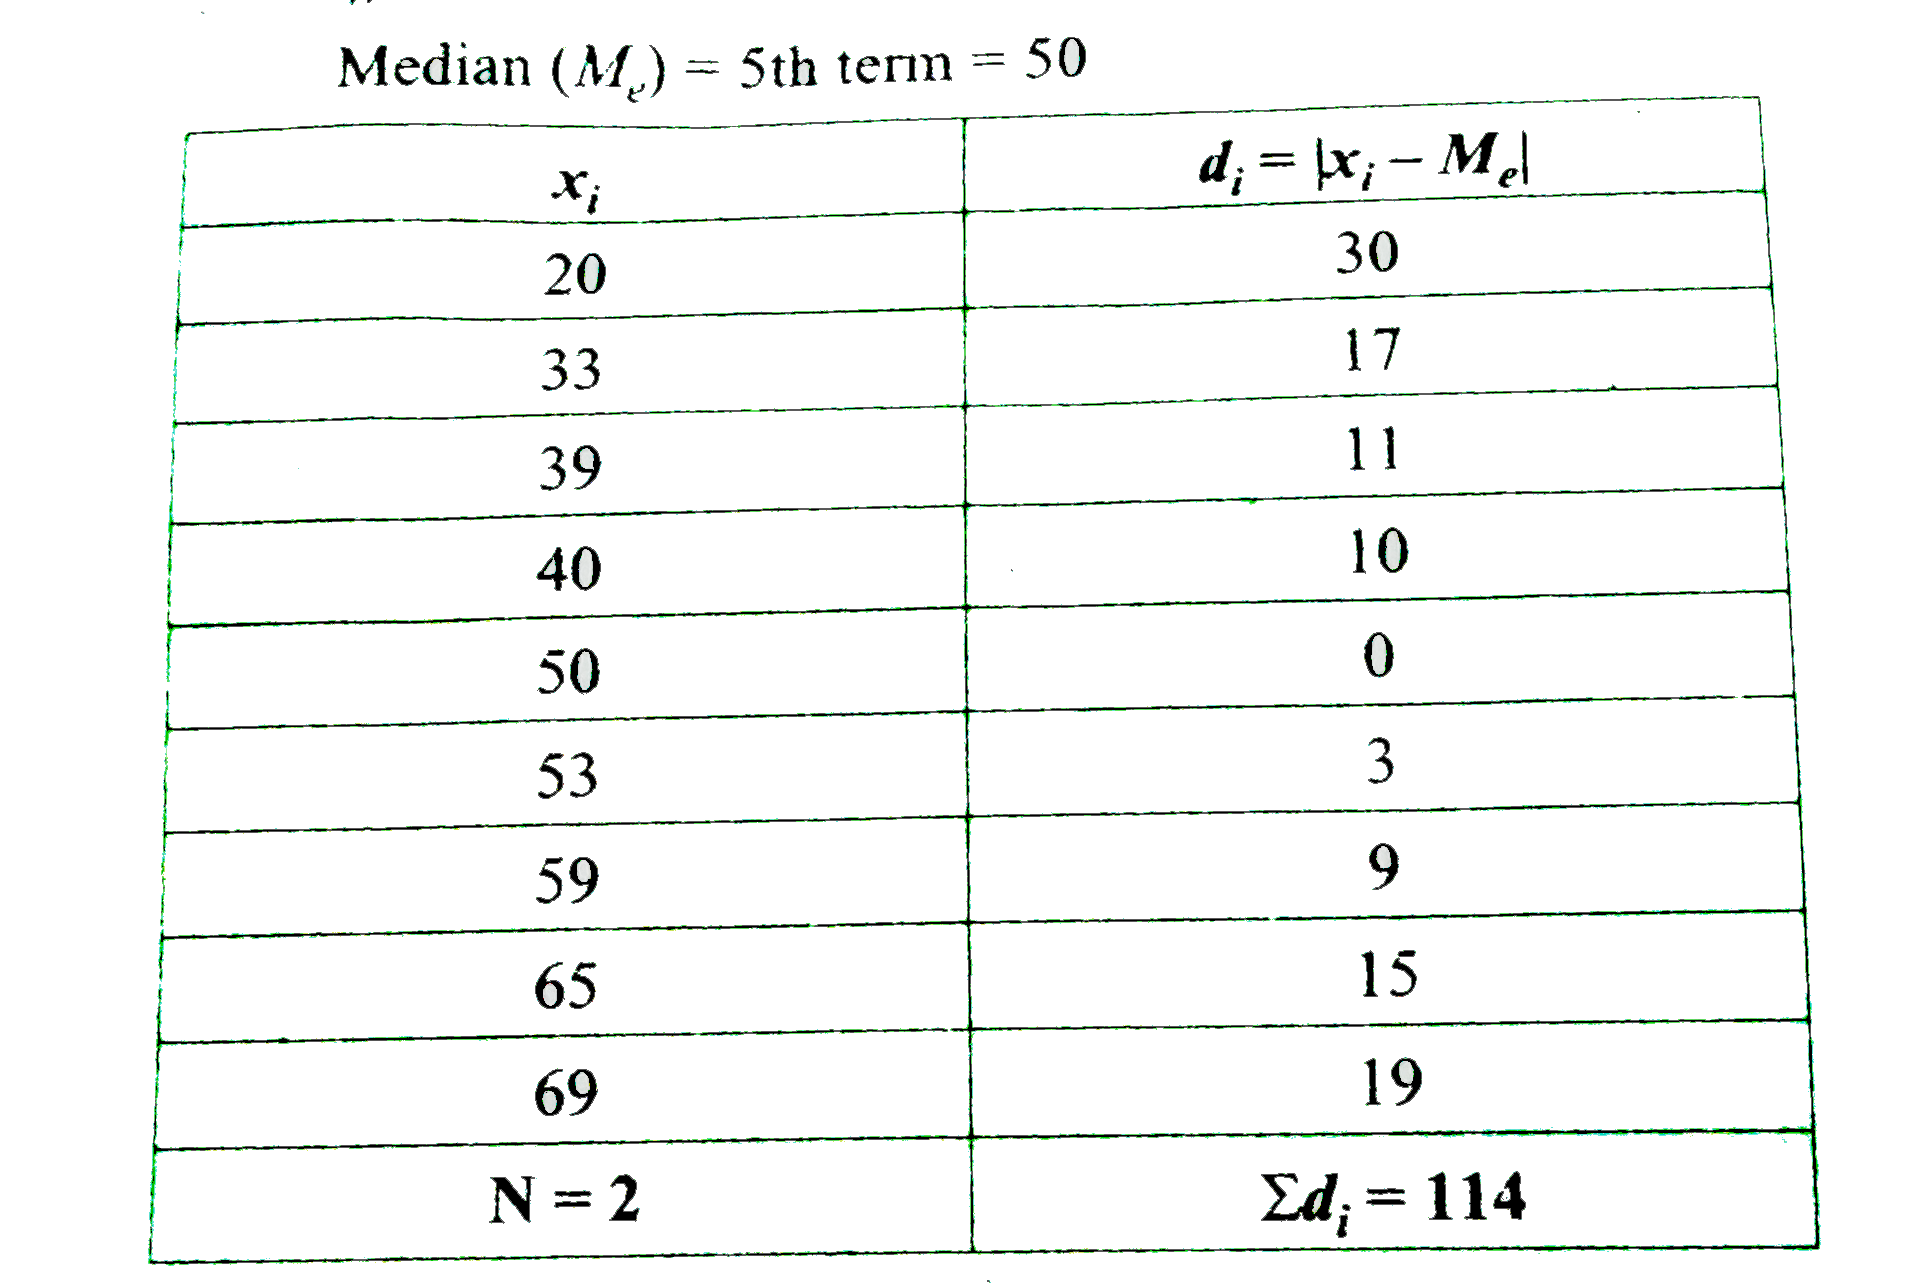
Marks obtained by 9 students in Mathematics are : 50, 69, 20, 33, 53, 39, 40, 65, 59
Let us reqrite the given data in ascending order.
20, 33, 39, 40, 50, 53, 59, 65, 69,
Here, n=9
Median (Me)=5th term =50

M.D.=1149=12.67
Topper's Solved these Questions
- STATISTICSBOOK - CENGAGE ENGLISHCHAPTER - STATISTICSEXERCISE - Archives
10 Videos
- STATISTICSBOOK - CENGAGE ENGLISHCHAPTER - STATISTICSEXERCISE - Exercise 11.2
6 Videos
- SOLUTIONS AND PROPERTIES OF TRIANGLE BOOK - CENGAGE ENGLISHCHAPTER - SOLUTIONS AND PROPERTIES OF TRIANGLE EXERCISE - Comprehension Type
6 Videos
- STRAIGHT LINEBOOK - CENGAGE ENGLISHCHAPTER - STRAIGHT LINEEXERCISE - Multiple Correct Answers Type
8 Videos
Similar Questions
Following are the marks obtained by 30 students in a examination

Taking class intervals 0−10,10−20,…..40−50 construct a frequency table.
View SolutionFollowing table shows the marks obtained by 8 students in English and Mathematics.

A candidate scored 85 marks in Y but was absent from the X test. Estimate his probable score for other test.
View SolutionFind the mean, median and mode of the following marks obtained by 16 students in a class test marked out of 10 marks:
0,0,2,2,3,3,3,4,5,5,5,5,6,6,7 and 8
View SolutionThe marks of 9 students in a test were 13,17,20,3,5,3,20,15 and 18. Find quartile deviation.
View SolutionFollowing is the distribution fo marks obtained by 50 students in a test.
Marks more than01020304050No. of Students50464020103
If 60% of the students pass the test, find the minimum marks obtained by a pass students.
View SolutionFollowing table shows the marks scored by a group of 90 students in a mathematics test of 100 marks. Marks 0-20 20-30 30-40 40-50 50-60 60-70 70-100 No. of Students: 7 10 10 20 20 15 8 Find the probability that marks scored by a student in the class is: at most 60 marks (ii) at least 60 marks (iii)not more than 50 marks
View SolutionThe marks (out of 100) obtained by a group of students in a science test are 85, 76,90, 85, 39, 48, 56, 95, 81 and 75. Find the:(i) Highest and the lowest marks obtained by the students.(ii) Range of the marks obtained.(iii) Mean marks obtained by the group.
View SolutionThe marks (out of 100) obtained by a group of students in a science test are 85, 76, 90, 85, 39, 48, 56, 95, 81 and 75. Find the: (i) Highest and the lowest marks obtained by the students. (ii) Range of the marks obtained. (iii) Mean marks obtain
View SolutionThe marks obtained by 100 students in a Mathematics test are given below :

Draw an ogive for the given distribution on a graph sheet.
(Use a scale of 2 cm = 10 units on both axis).
Use the ogive to estimate the :
(i) median.
View SolutionThe marks obtained by 120 students in a Mathematics test are given below:

Using the informations, given above, draw an ogive on a graph sheet. Take a suitable scale for your ogive. Use the ogive drawn to estimate :
(i) the median.
(ii) the number of students who obtained more than 75% marks in the test.
(iii) the number of students who did not pass in the test if the pass percentage was 40.
View Solution
