Which one of following best represents the graph of y=xlogxπ
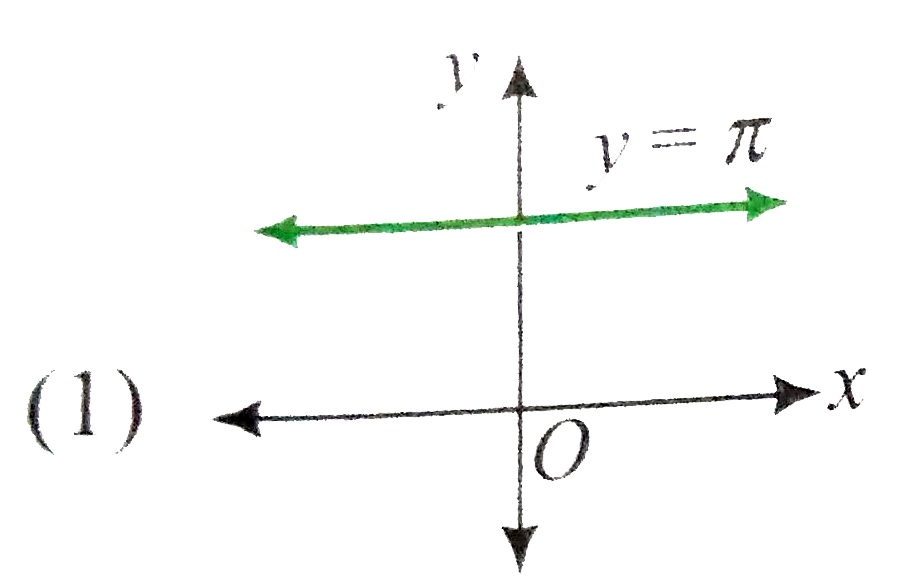
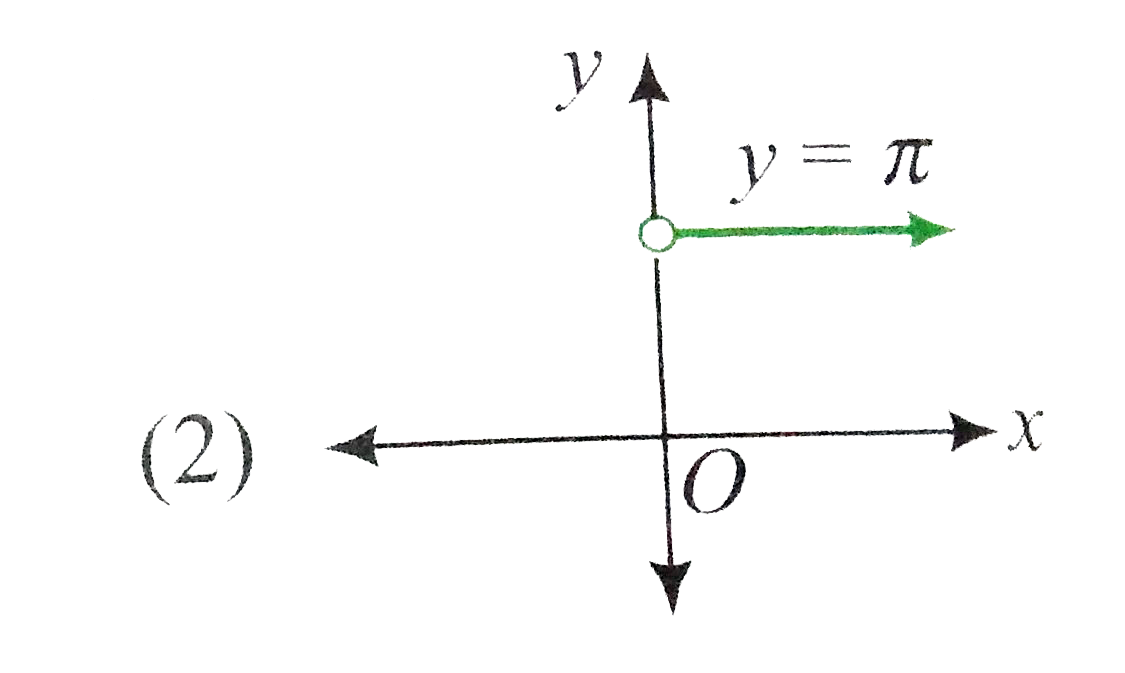
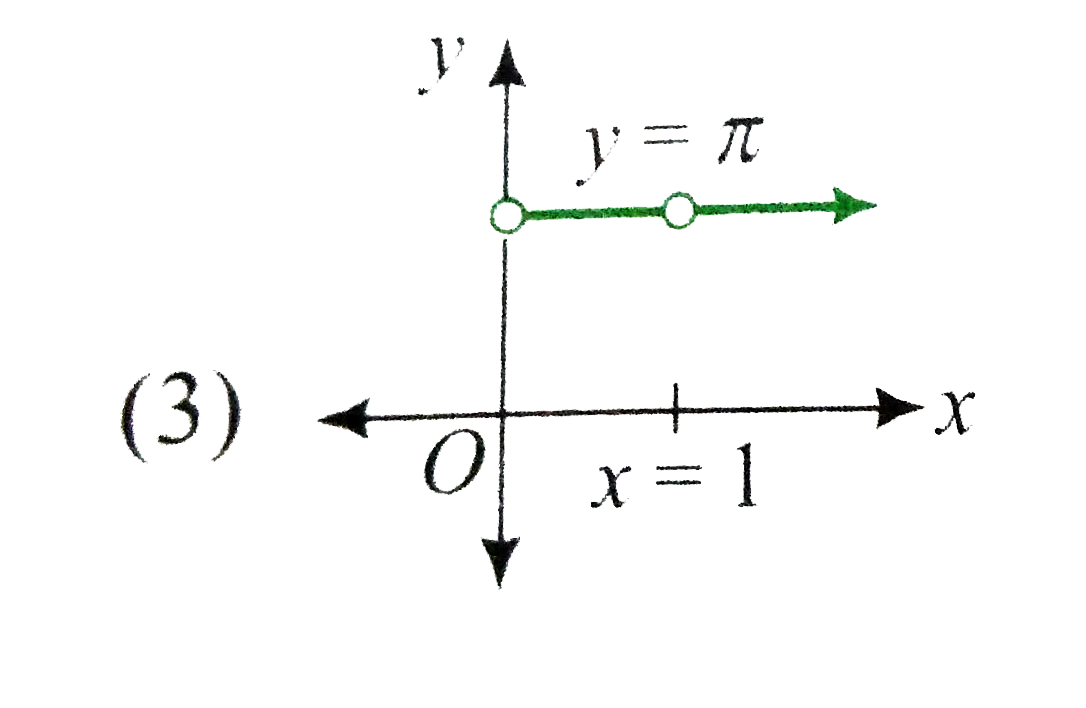
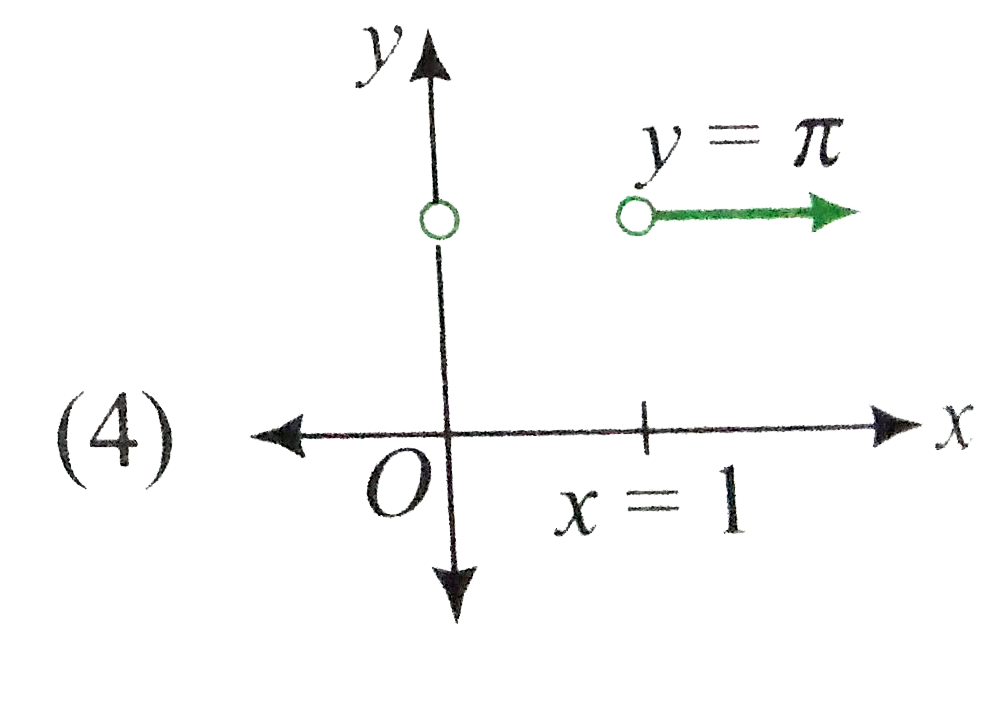
The correct Answer is:C
To solve the problem of determining which graph best represents the equation y=xlogxπ, we can follow these steps:
Step 1: Rewrite the Expression
We start with the equation:
y=xlogxπ
Using the logarithmic identity alogbc=clogba, we can rewrite the equation as:
y=πlogxx
Step 2: Simplify the Logarithm
Since logxx=1 (because any logarithm of a number to its own base is 1), we can simplify further:
y=π1=π
Step 3: Determine the Domain
Next, we need to consider the domain of the function. The logarithm logxπ is defined only when:
1. x>0 (the base of the logarithm must be positive)
2. x≠1 (the base cannot be 1)
Thus, the domain of x is:
x∈(0,1)∪(1,∞)
Step 4: Identify the Range
From our simplification, we see that y is constant and equal to π for all valid x in the domain. Therefore, the range of y is:
y=π
Step 5: Graph the Function
The graph of the function y=π is a horizontal line at y=π. However, we must note that this line does not include the points where x=1 and x=0.
Conclusion
The graph of y=xlogxπ is a horizontal line at y=π, extending from x=0 to x=1 (not including 0 and 1) and from x=1 to x=∞.
Final Answer
The best representation of the graph of y=xlogxπ is a horizontal line at y=π for x∈(0,1)∪(1,∞).
---
We start with the equation:
y=xlogxπ
Using the logarithmic identity alogbc=clogba, we can rewrite the equation as:
y=πlogxx
Since logxx=1 (because any logarithm of a number to its own base is 1), we can simplify further:
y=π1=π
Next, we need to consider the domain of the function. The logarithm logxπ is defined only when:
1. x>0 (the base of the logarithm must be positive)
2. x≠1 (the base cannot be 1)
x∈(0,1)∪(1,∞)
From our simplification, we see that y is constant and equal to π for all valid x in the domain. Therefore, the range of y is:
y=π
The graph of the function y=π is a horizontal line at y=π. However, we must note that this line does not include the points where x=1 and x=0.
The graph of y=xlogxπ is a horizontal line at y=π, extending from x=0 to x=1 (not including 0 and 1) and from x=1 to x=∞.
The best representation of the graph of y=xlogxπ is a horizontal line at y=π for x∈(0,1)∪(1,∞).
Topper's Solved these Questions
- BOOK - CENGAGE ENGLISHCHAPTER - RELATIONS AND FUNCTIONSEXERCISE - Multiple Correct Answer Type27videos
RELATIONS AND FUNCTIONS
- BOOK - CENGAGE ENGLISHCHAPTER - RELATIONS AND FUNCTIONSEXERCISE - Linked Comprehension Type32videos
RELATIONS AND FUNCTIONS
- BOOK - CENGAGE ENGLISHCHAPTER - RELATIONS AND FUNCTIONSEXERCISE - CONCEPT APPLICATION EXERCISE 1.158videos
RELATIONS AND FUNCTIONS
- BOOK - CENGAGE ENGLISHCHAPTER - PROPERTIES AND SOLUTIONS OF TRIANGLEEXERCISE - Archives (Numerical Value Type)3videos
PROPERTIES AND SOLUTIONS OF TRIANGLE
- BOOK - CENGAGE ENGLISHCHAPTER - SCALER TRIPLE PRODUCTS EXERCISE - DPP 2.311videos
SCALER TRIPLE PRODUCTS
Similar Questions
Knowledge Check
- Question 1 - Select One
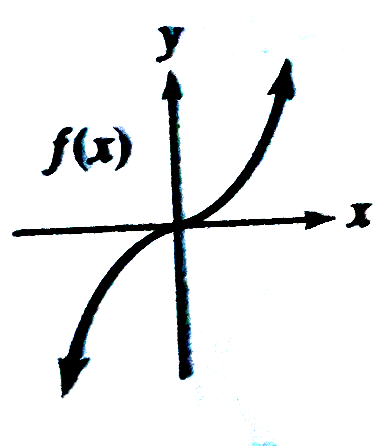
The graph of f(x) is shown above , Which of the following represents the graph of f(x-3) ?A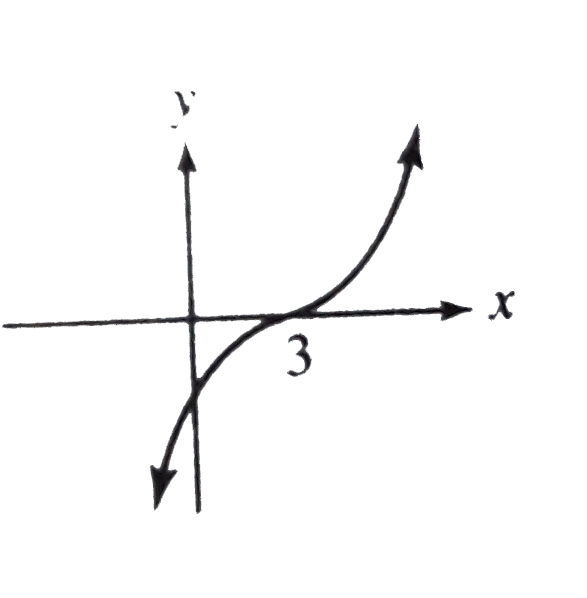 B
B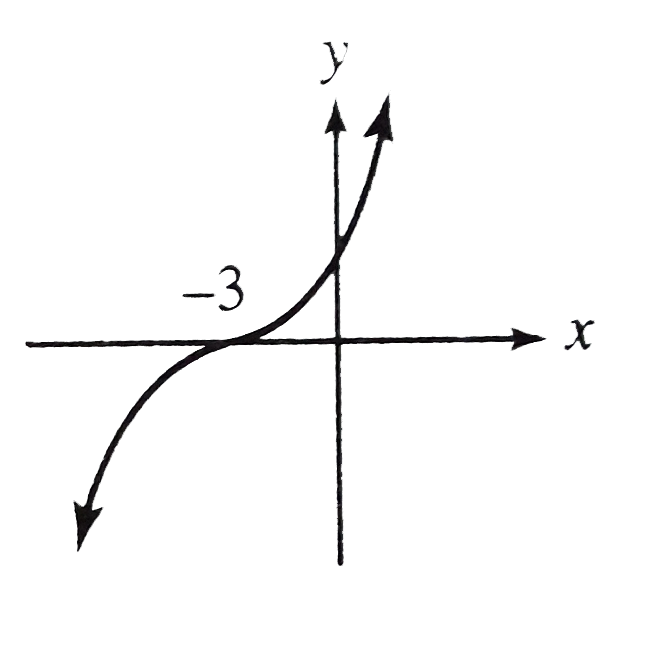 C
C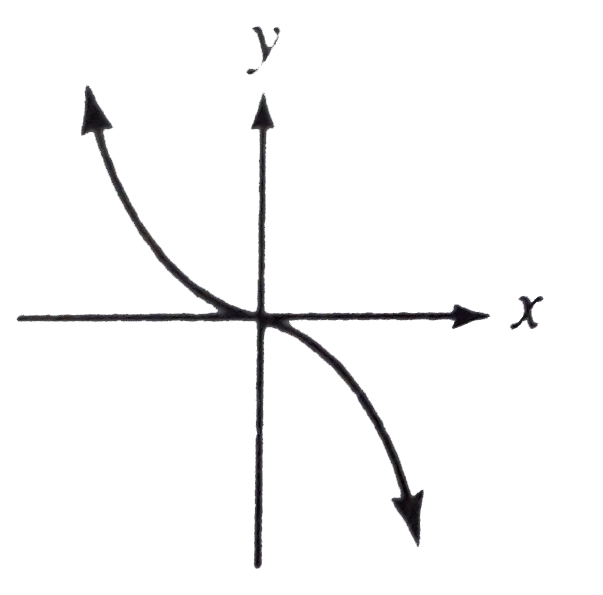 D
D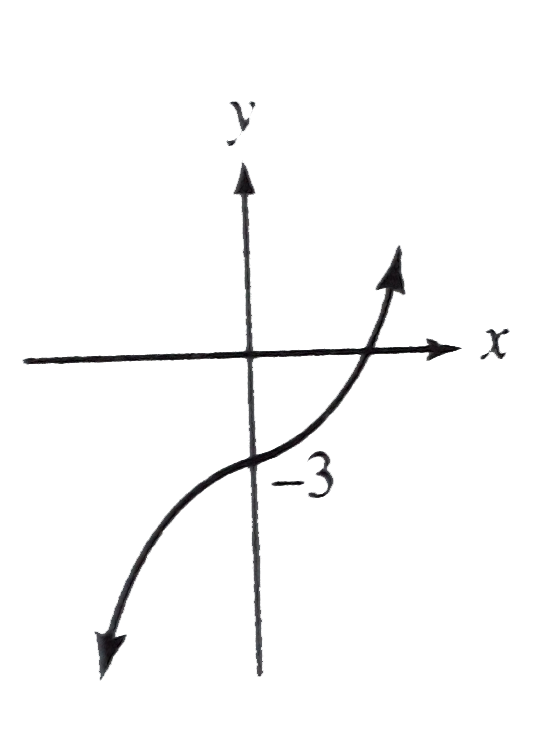
- Question 2 - Select One
The graph of y=f(x) is shown below.
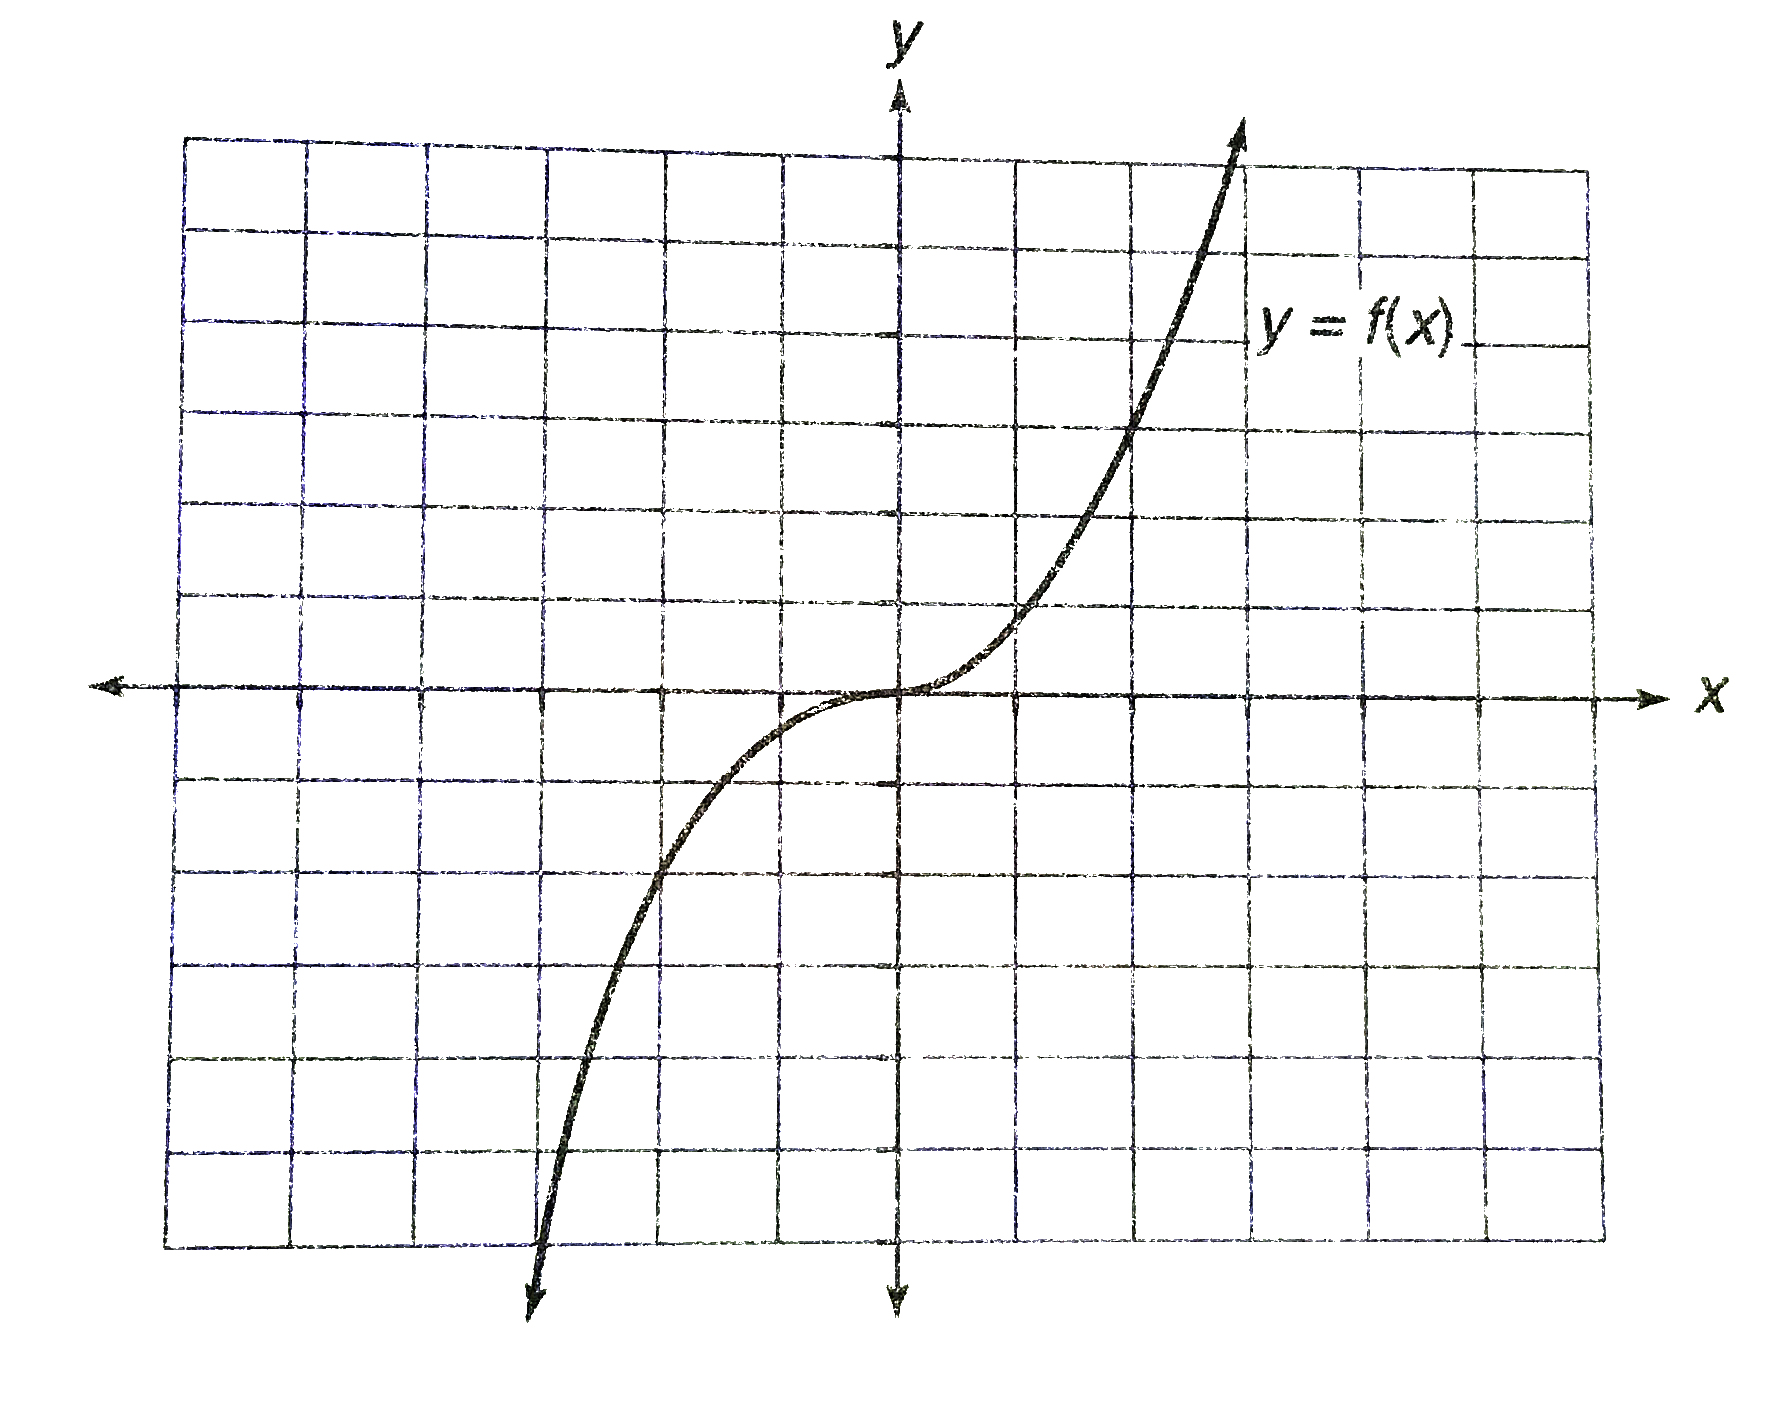
Which of the following could represents the graph of y=f(x−2)+1?A B
B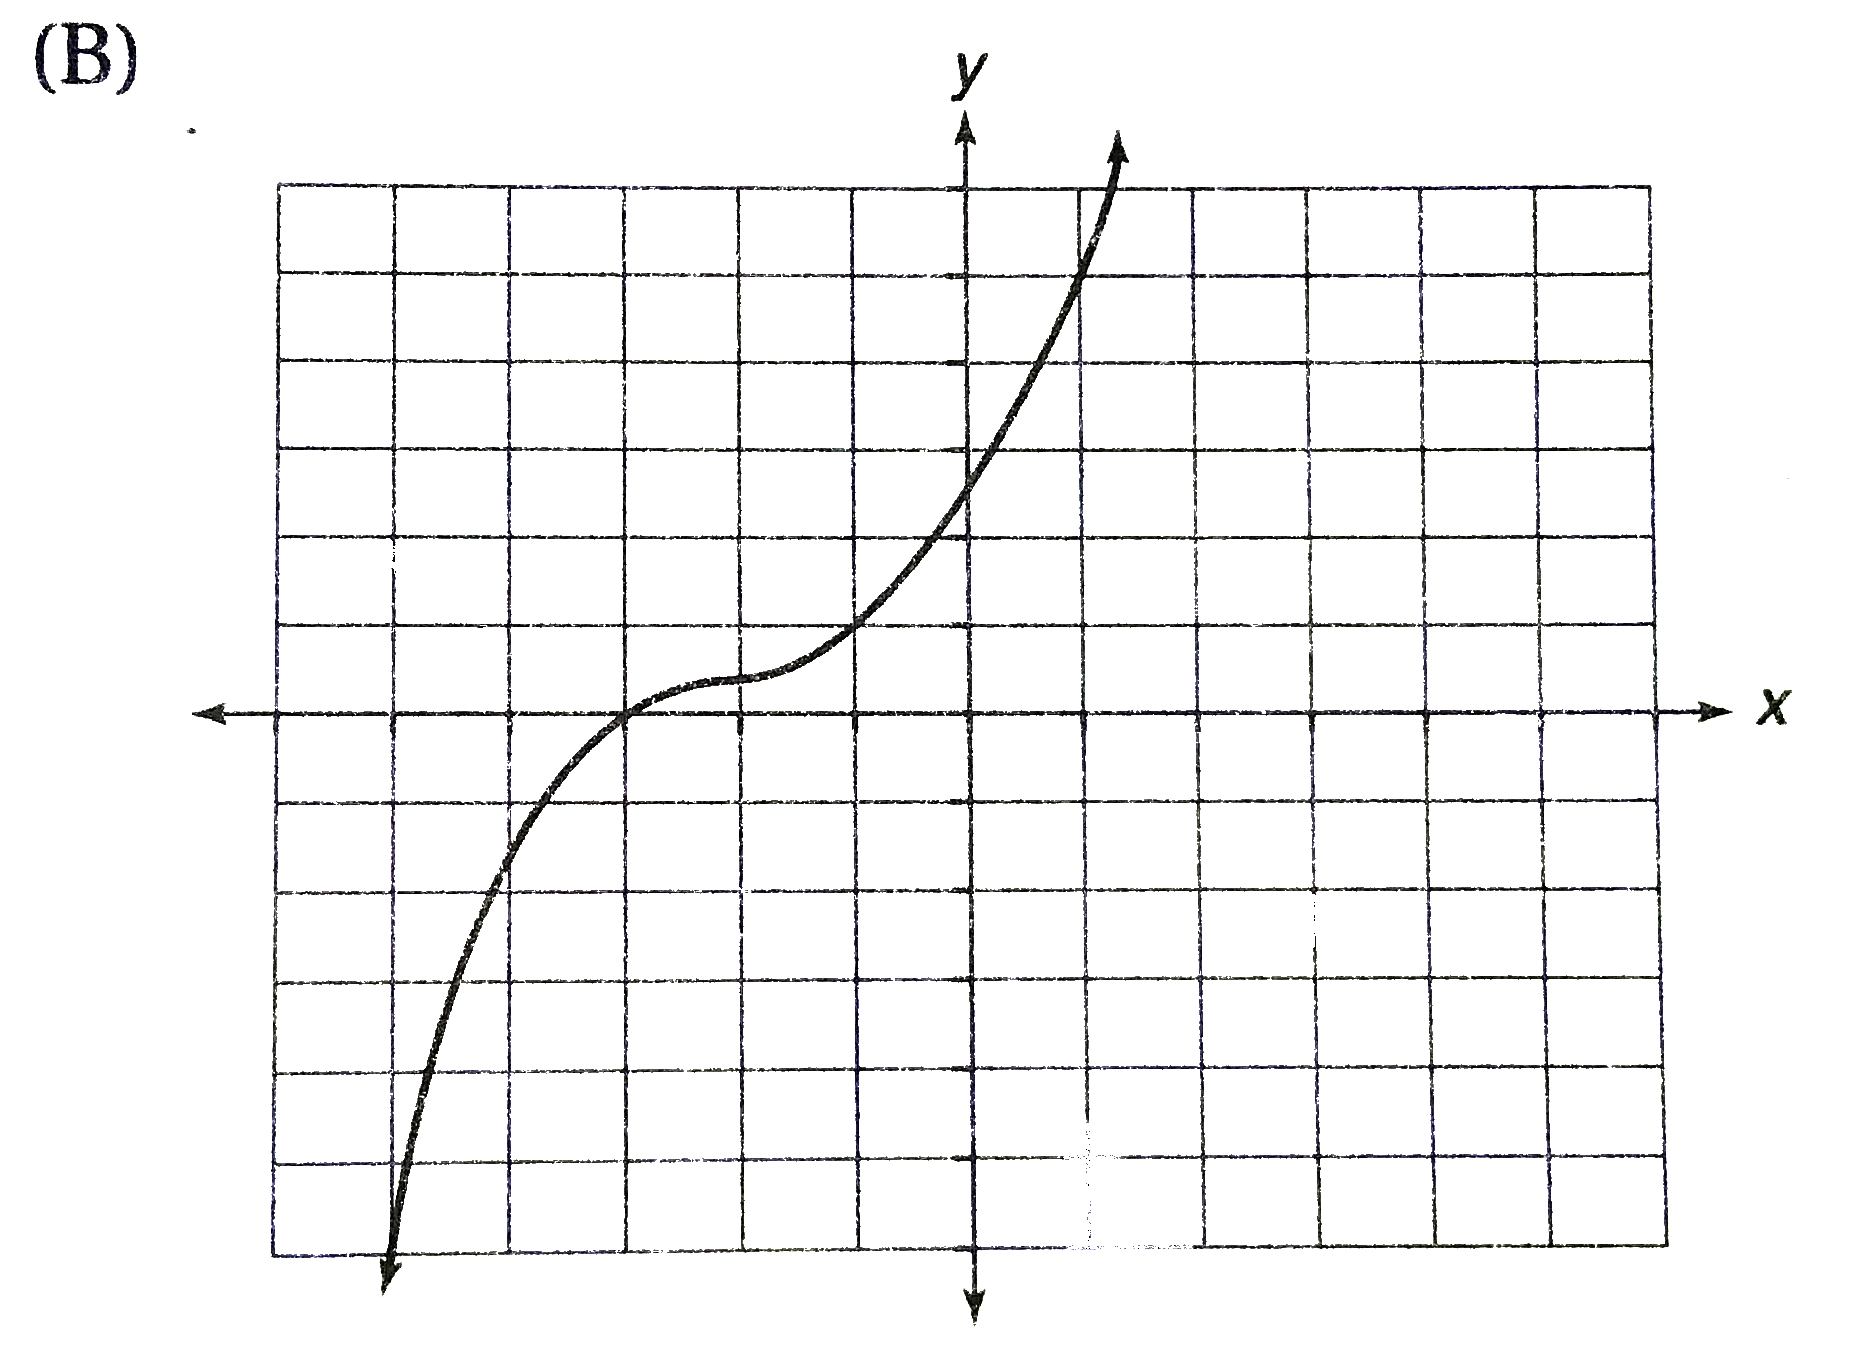 C
C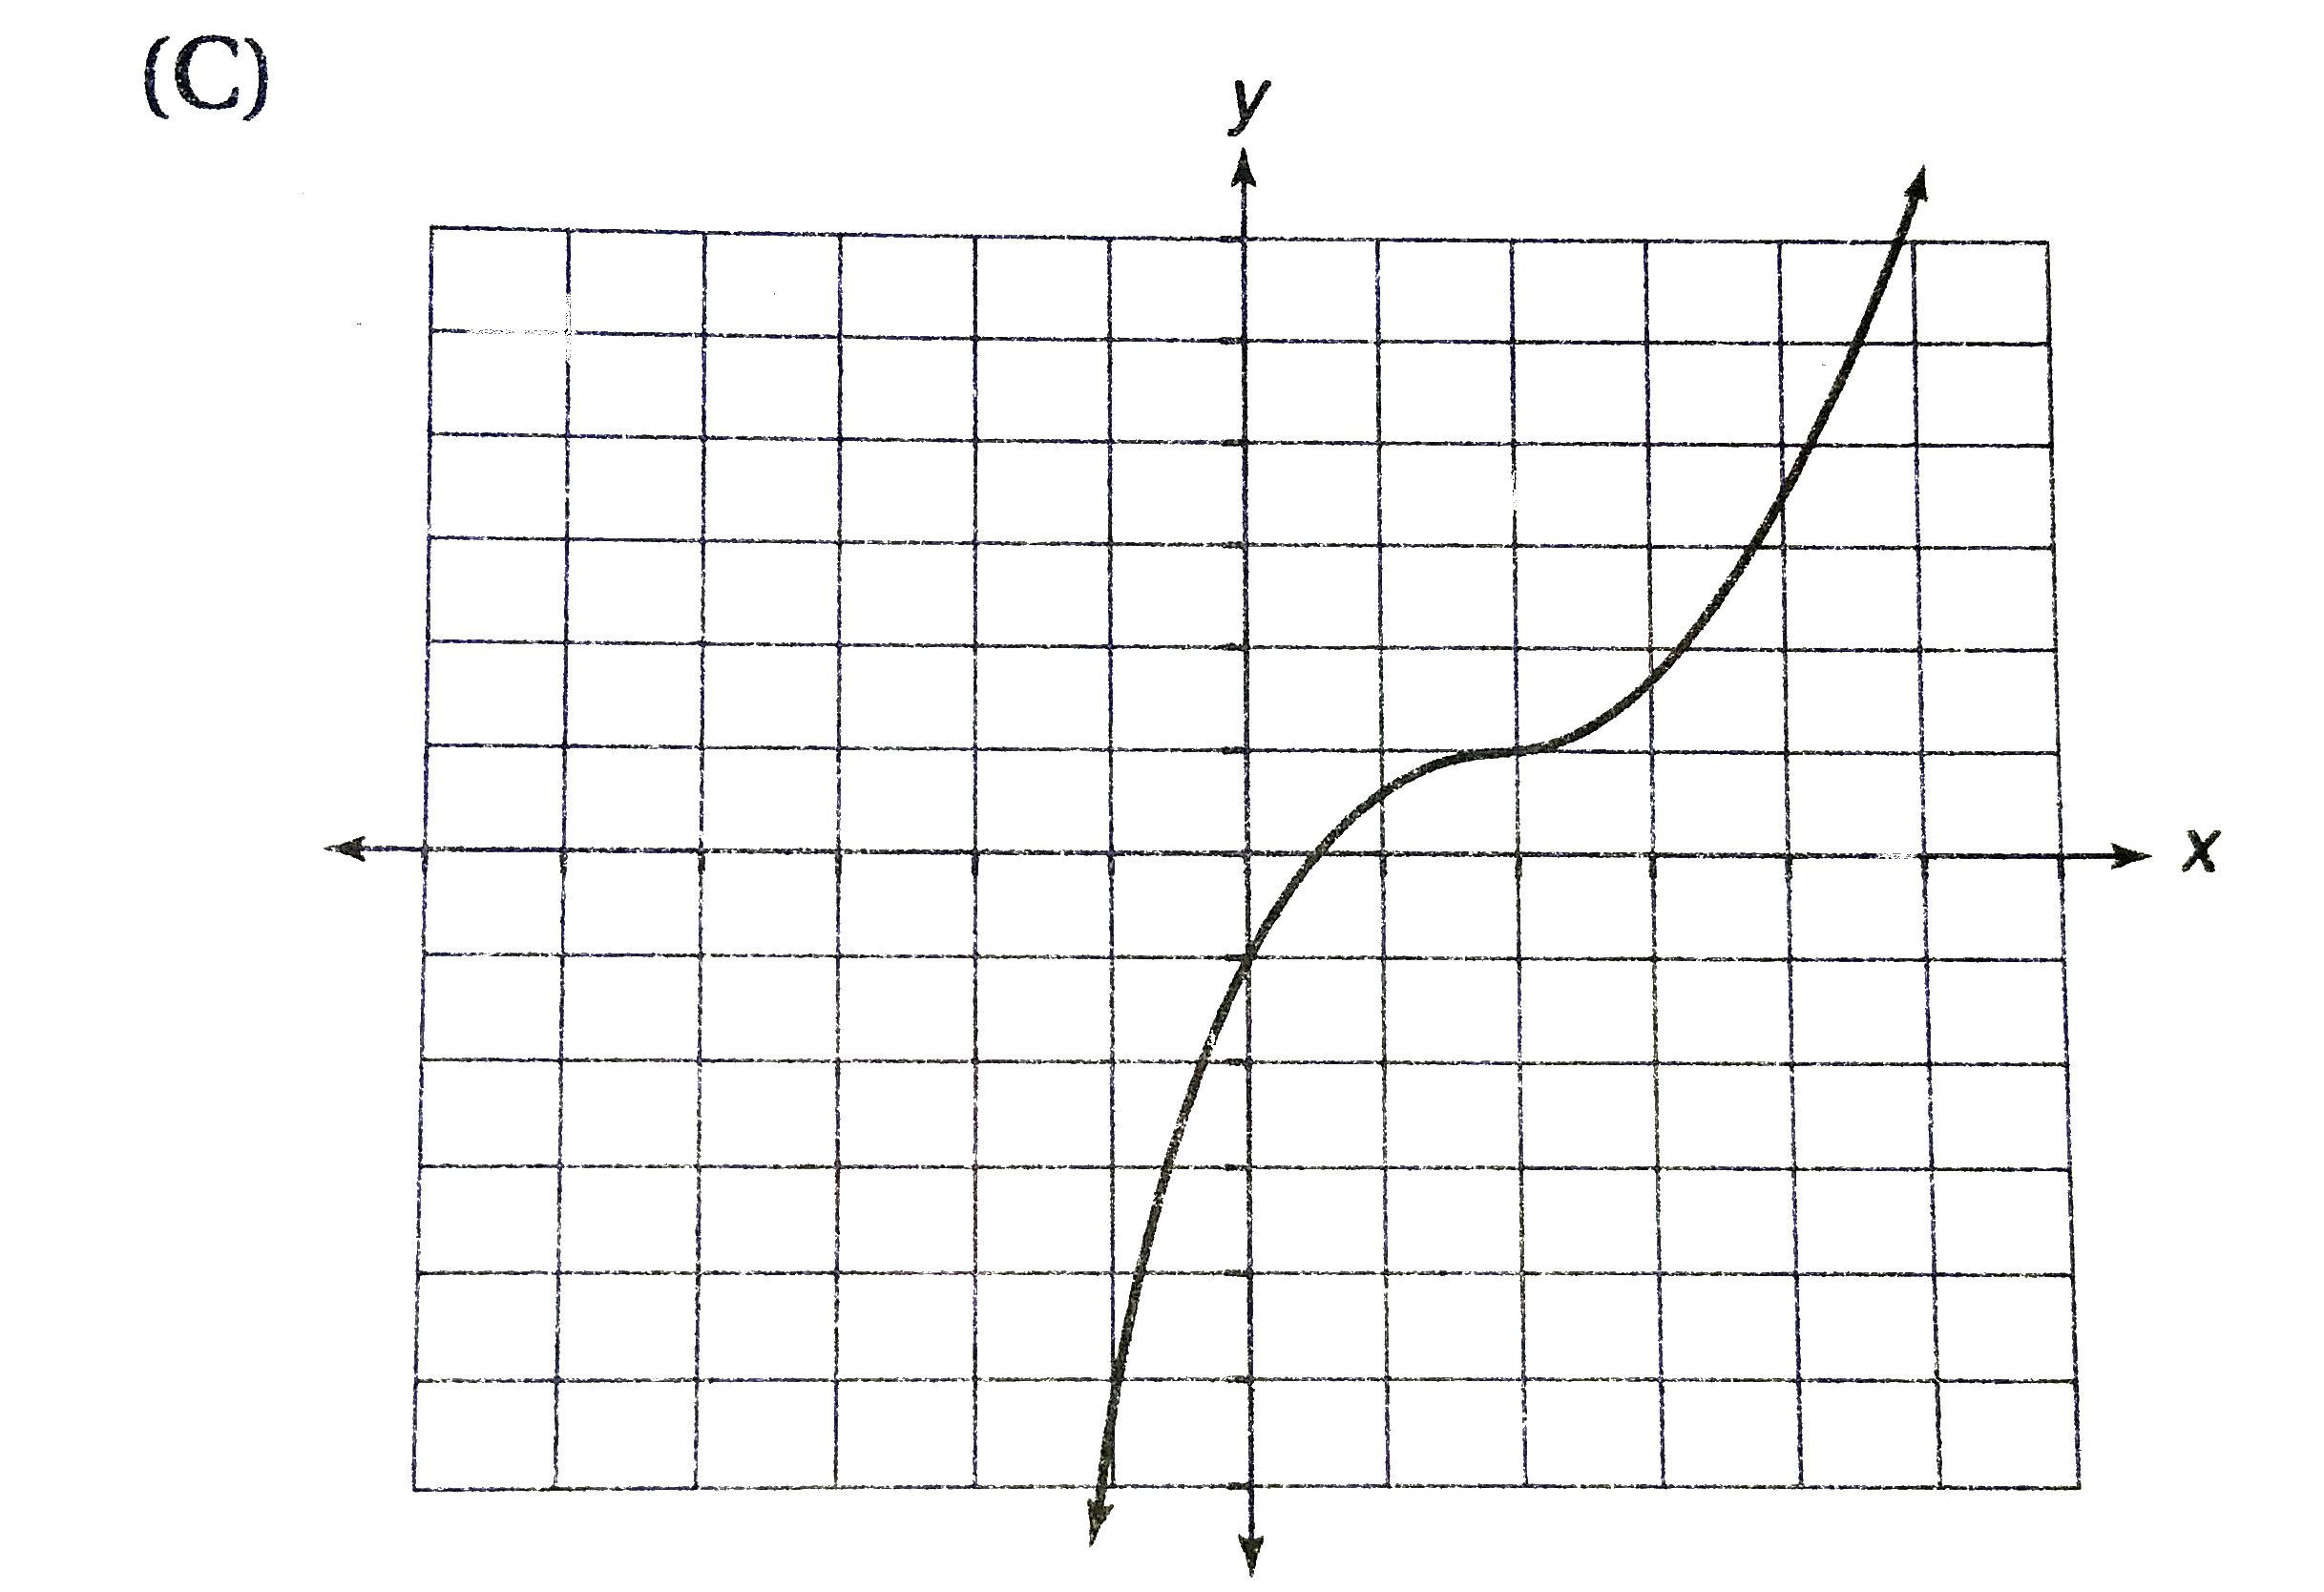 D
D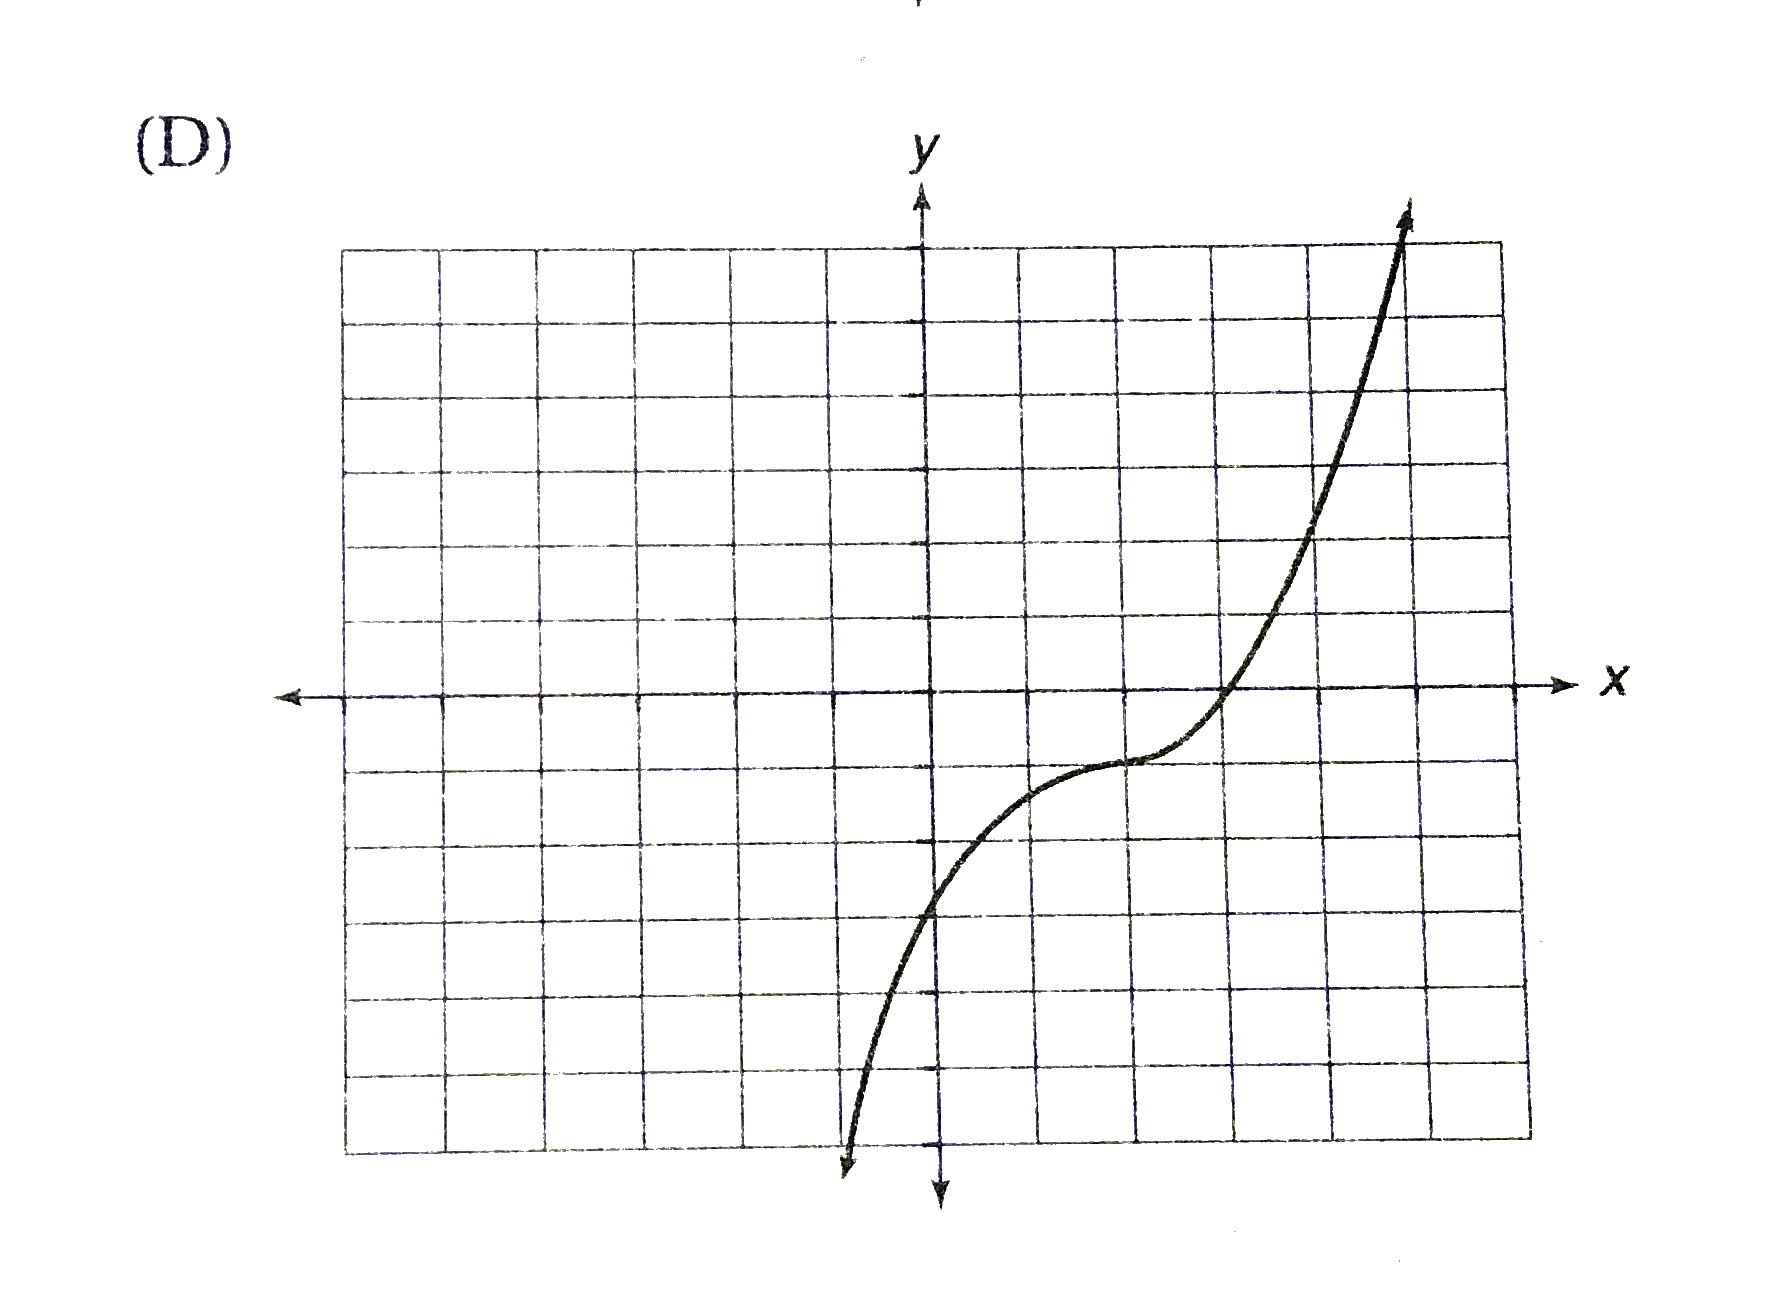
- Question 3 - Select One
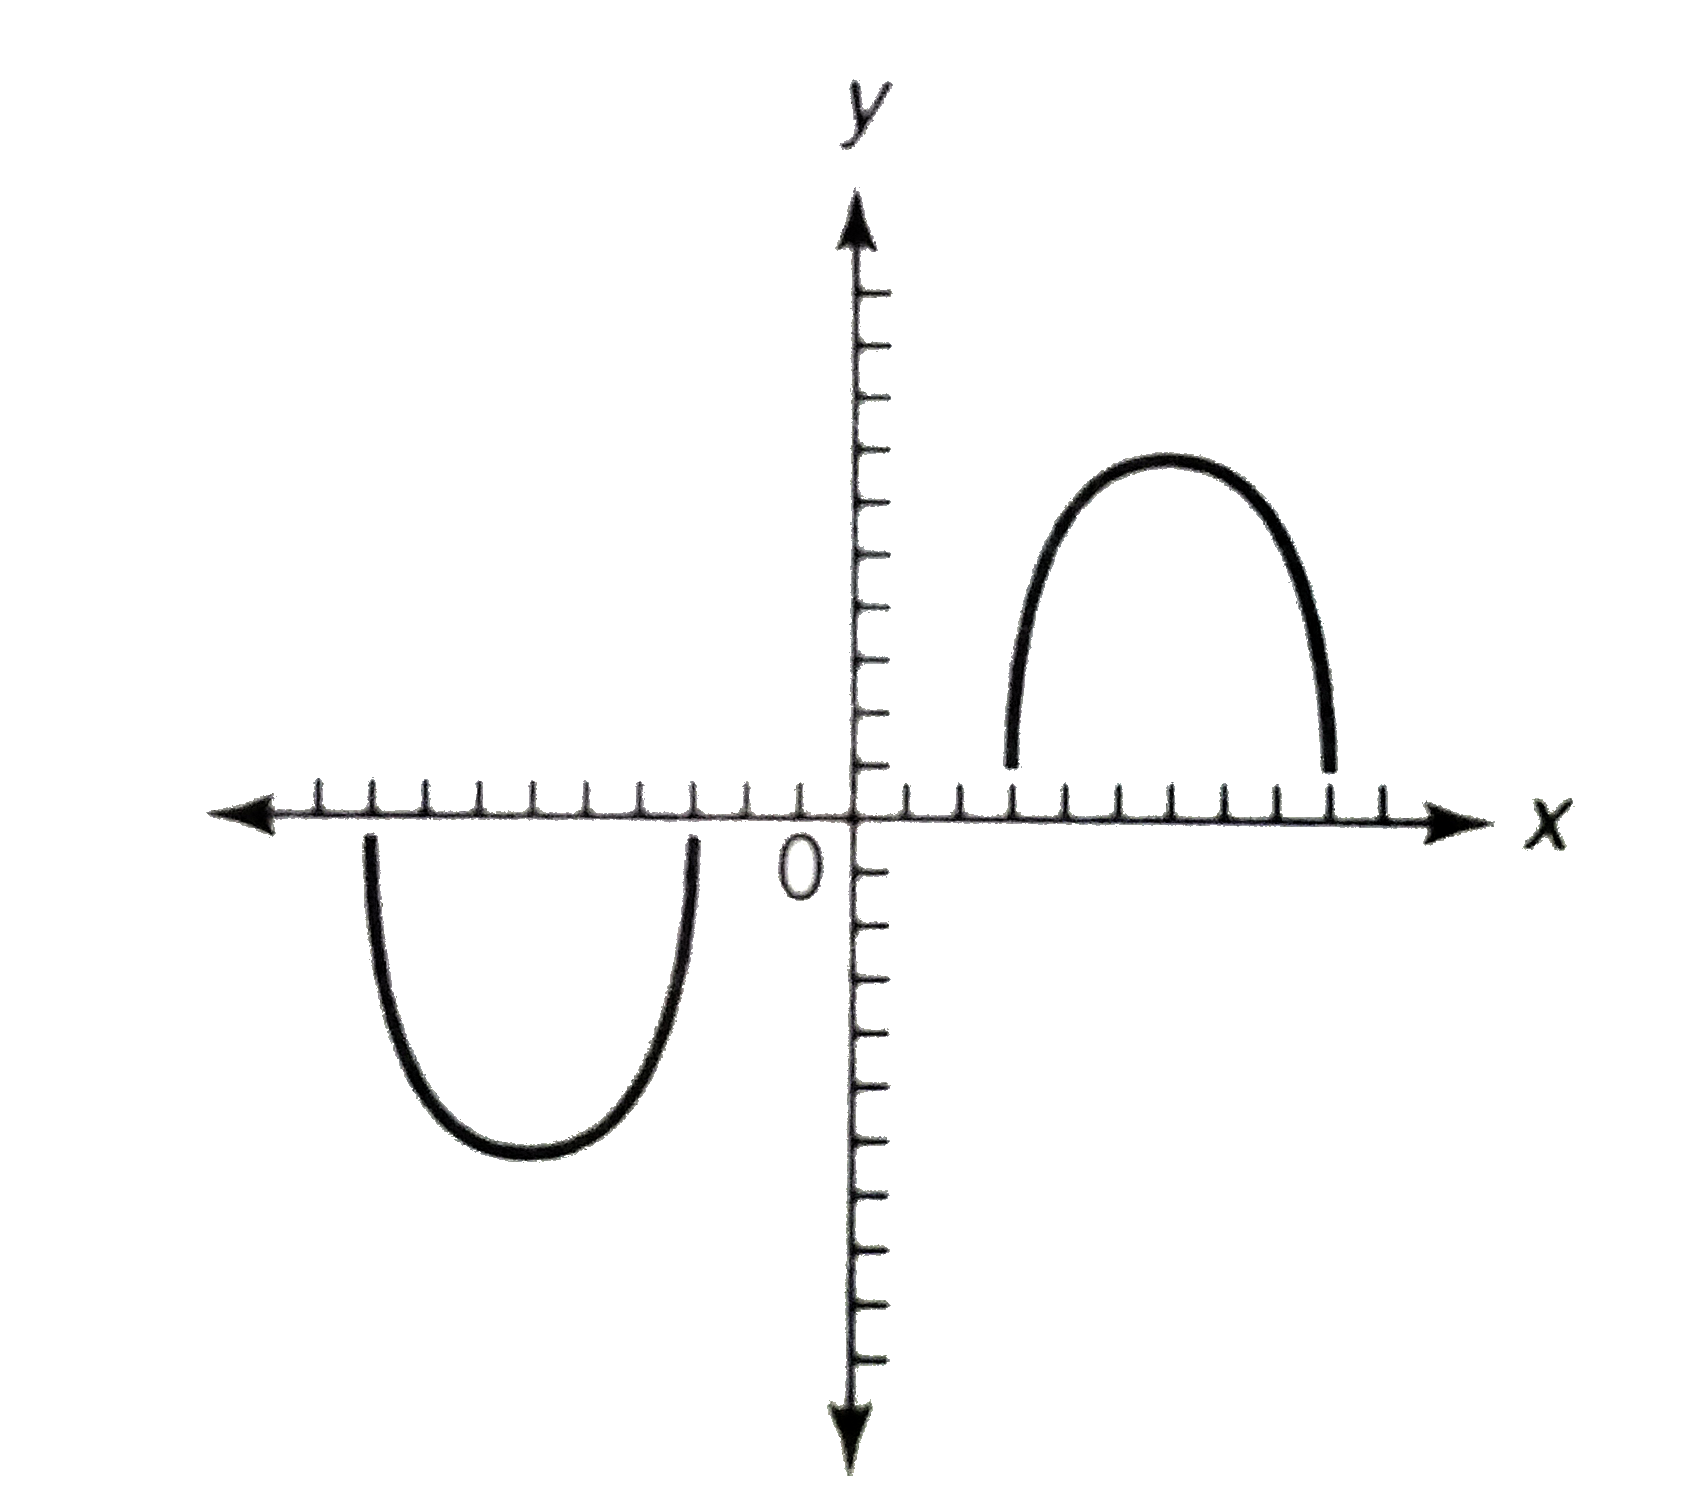
The graph of the function f is shown above. Which of the following could represent the graph of y=|f(x)|?A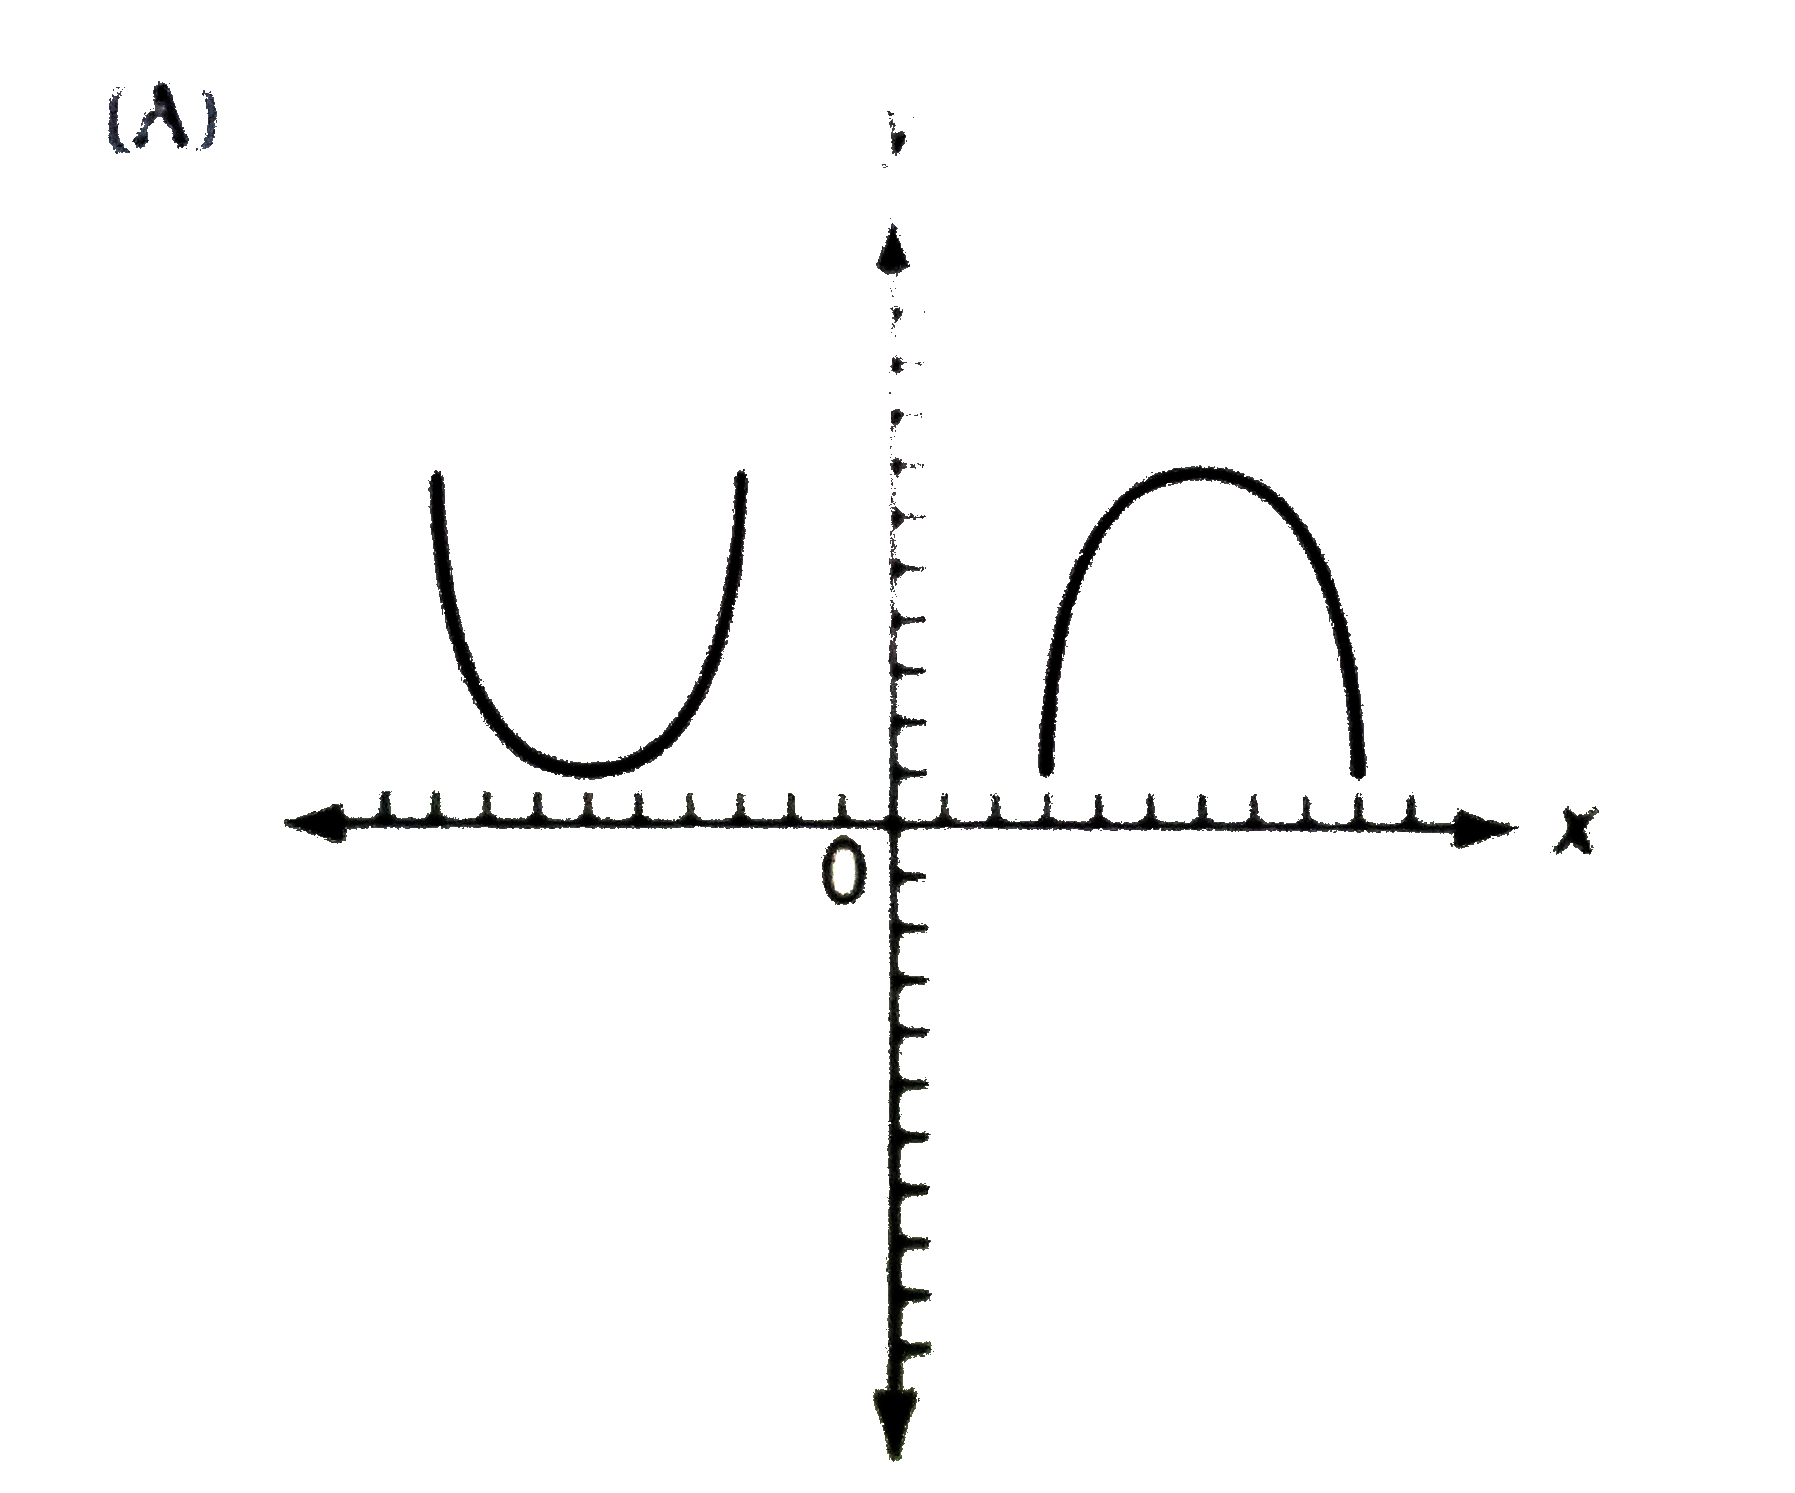 B
B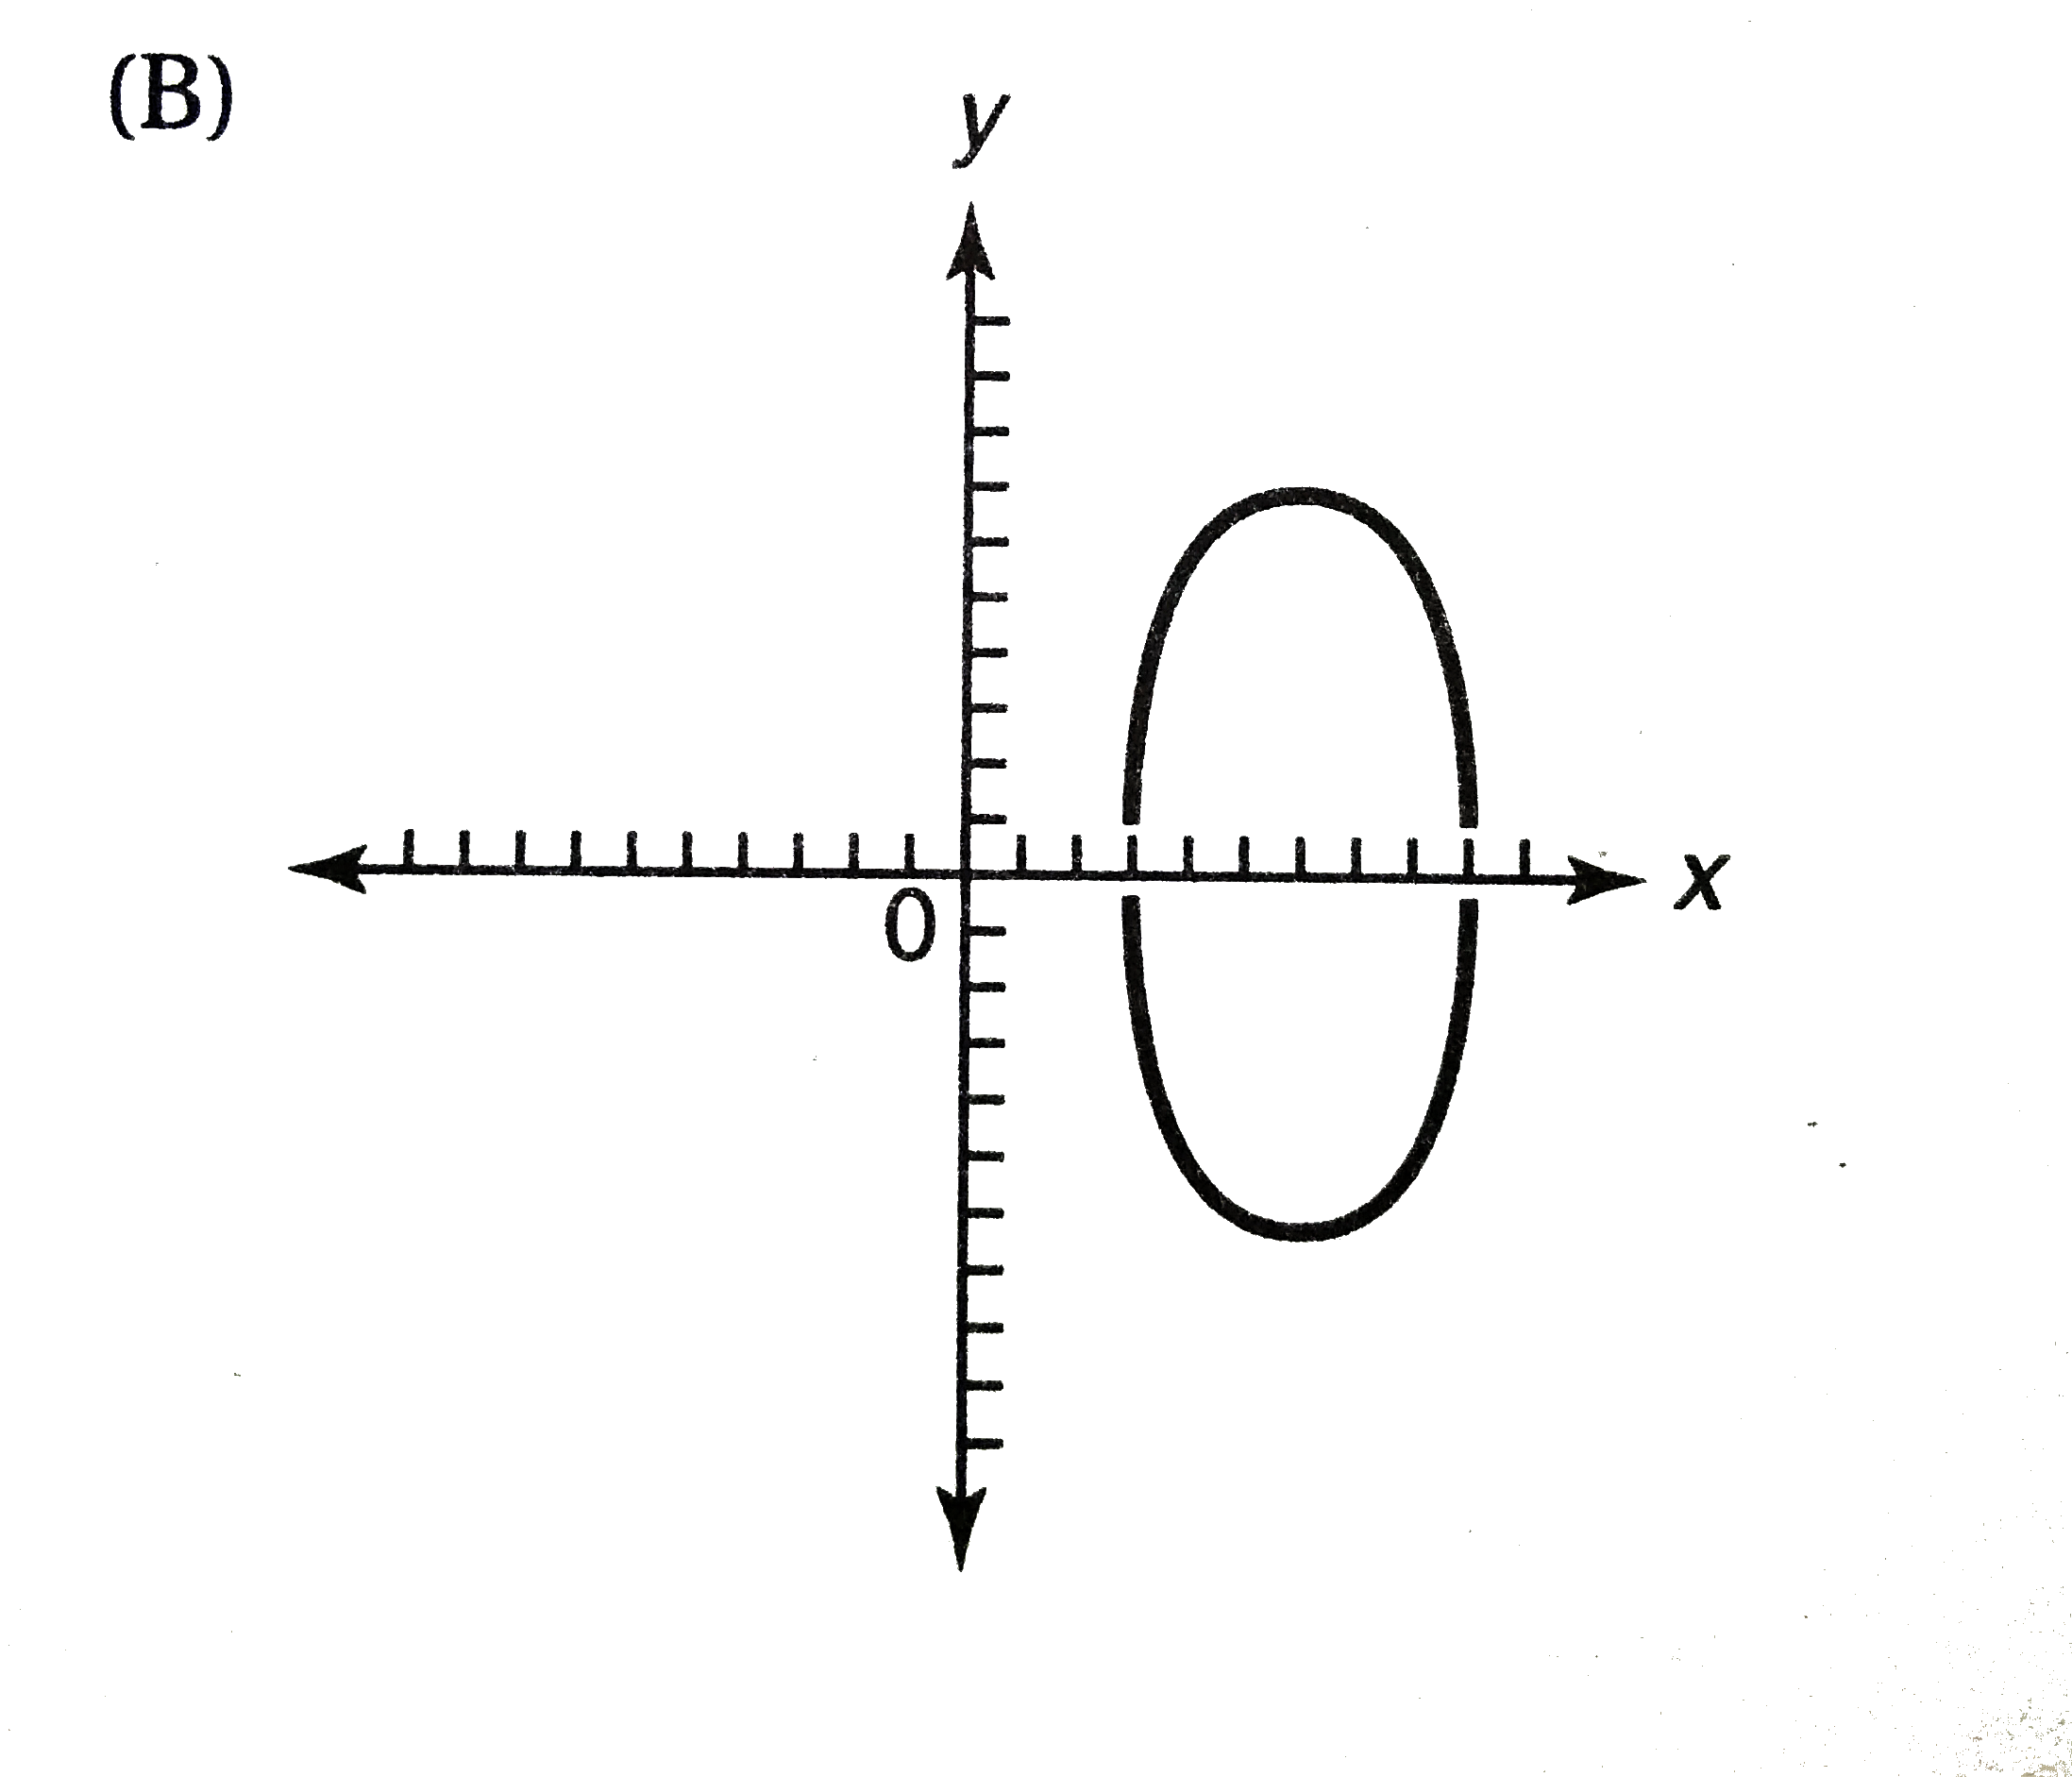 C
C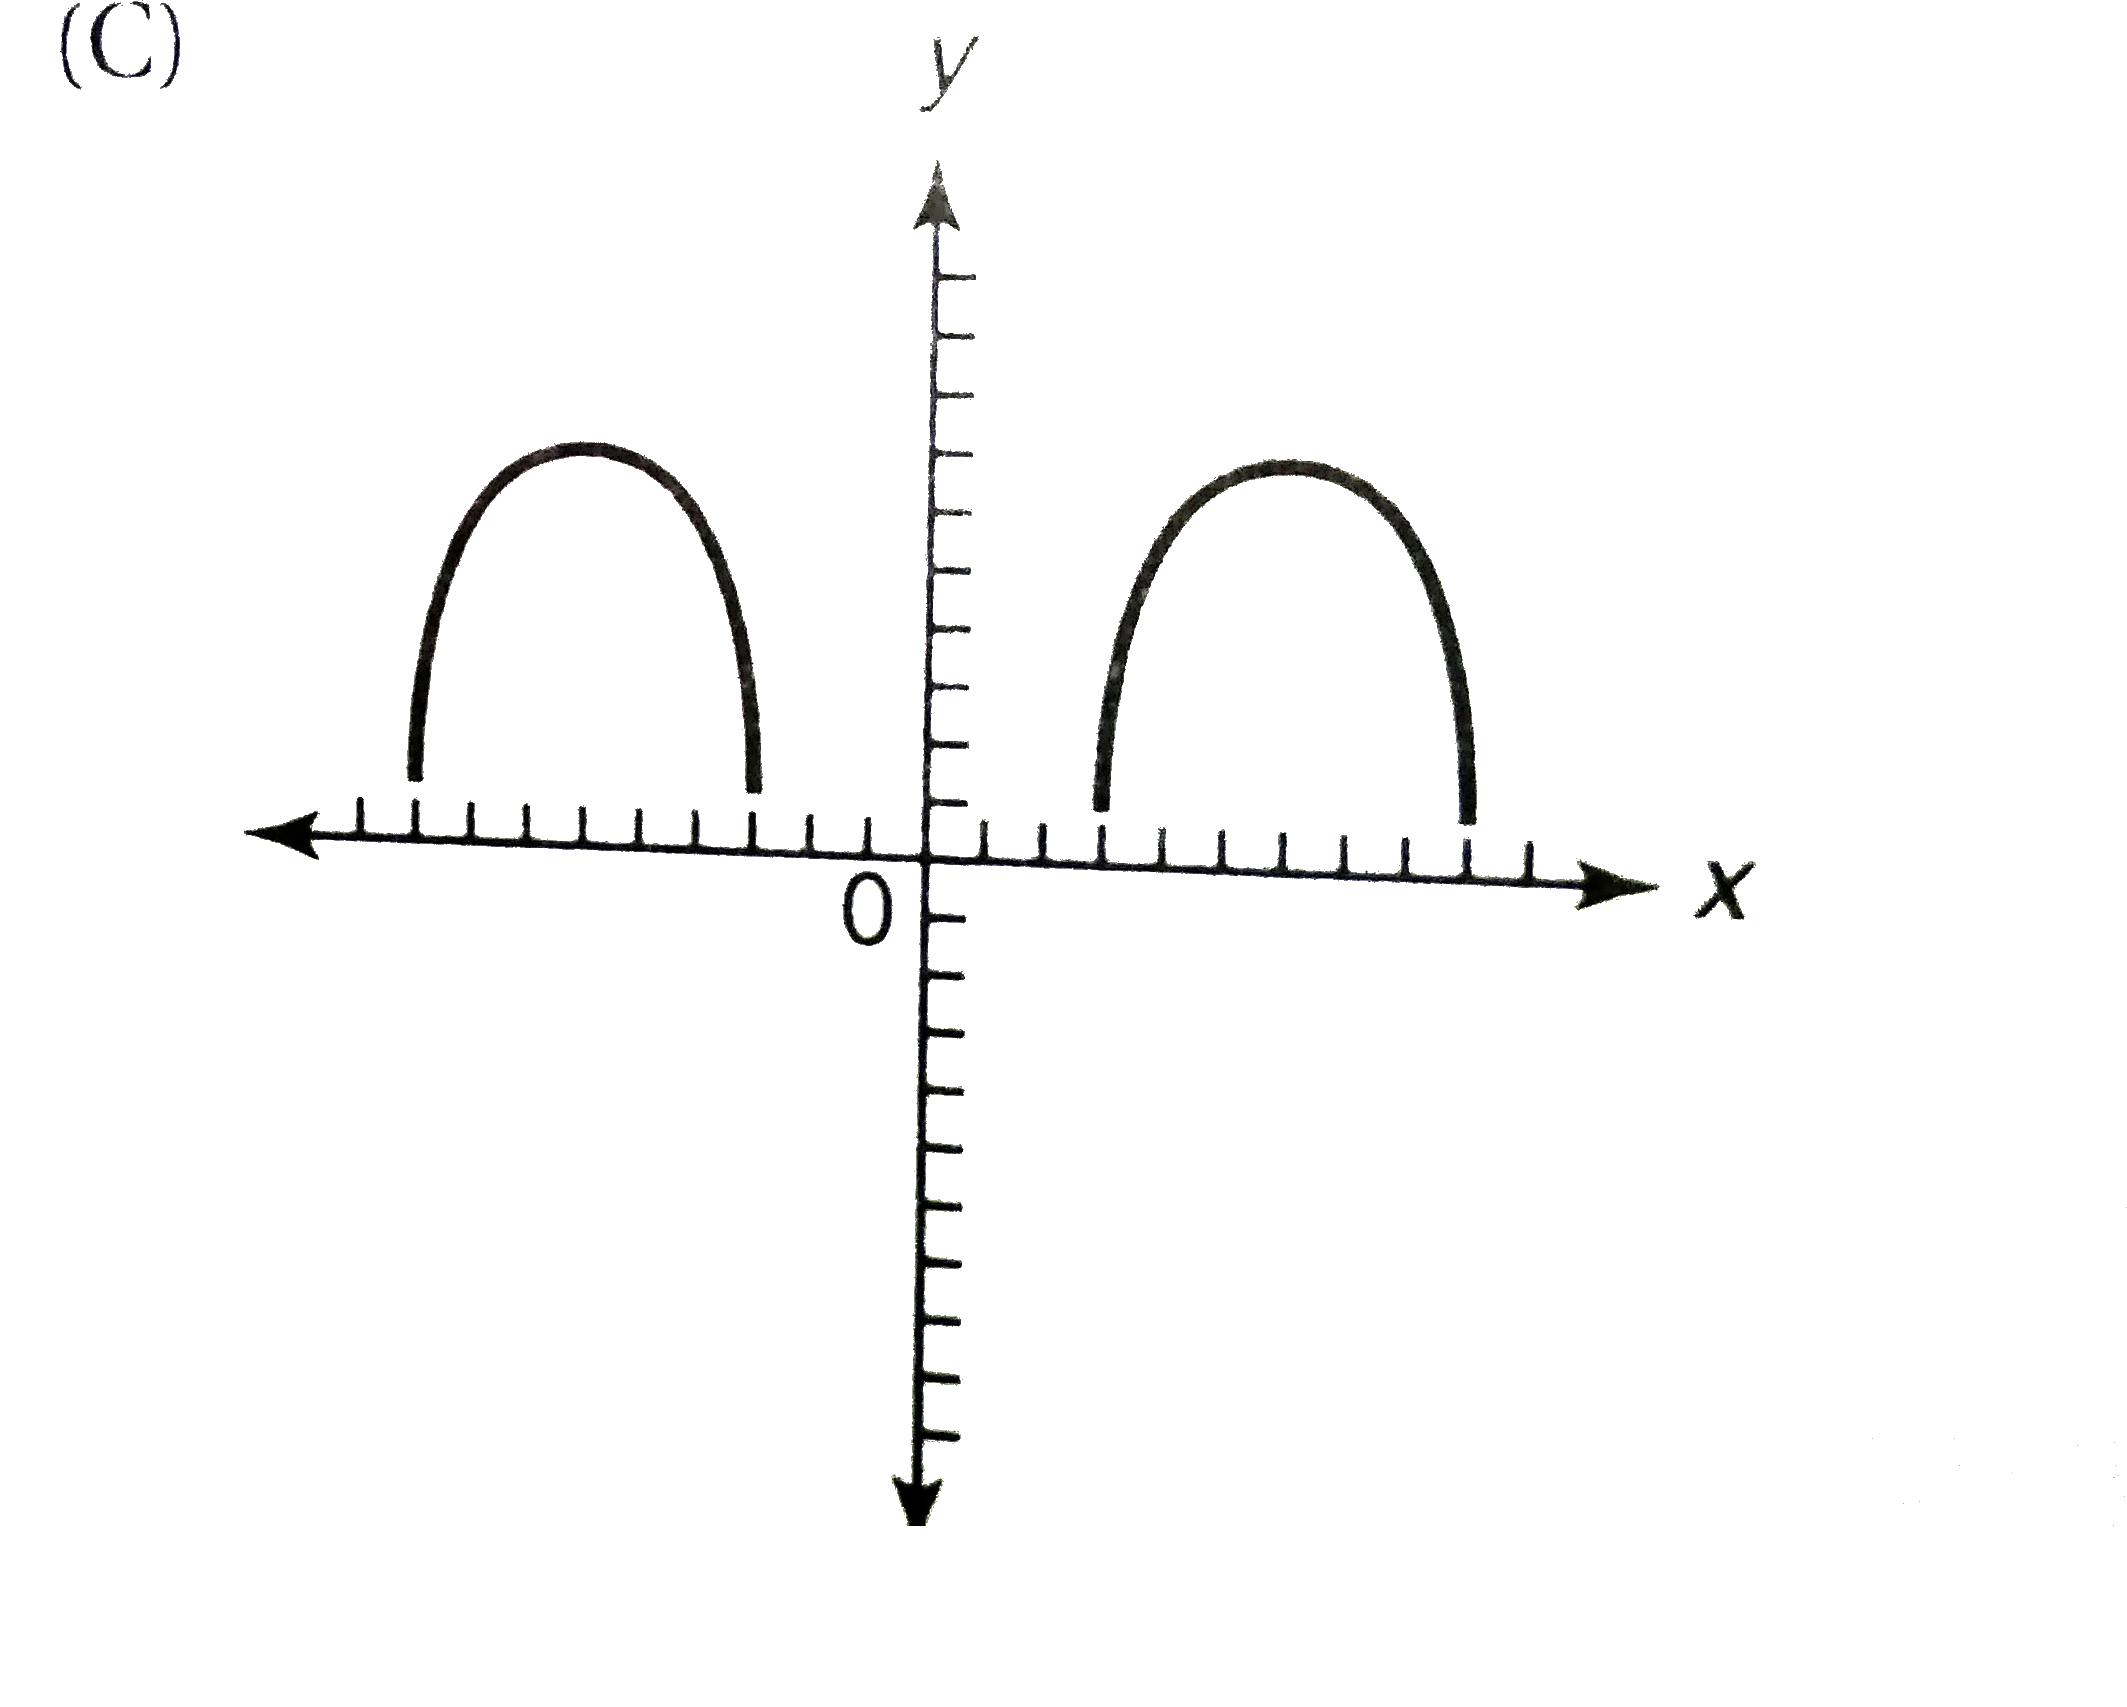 D
D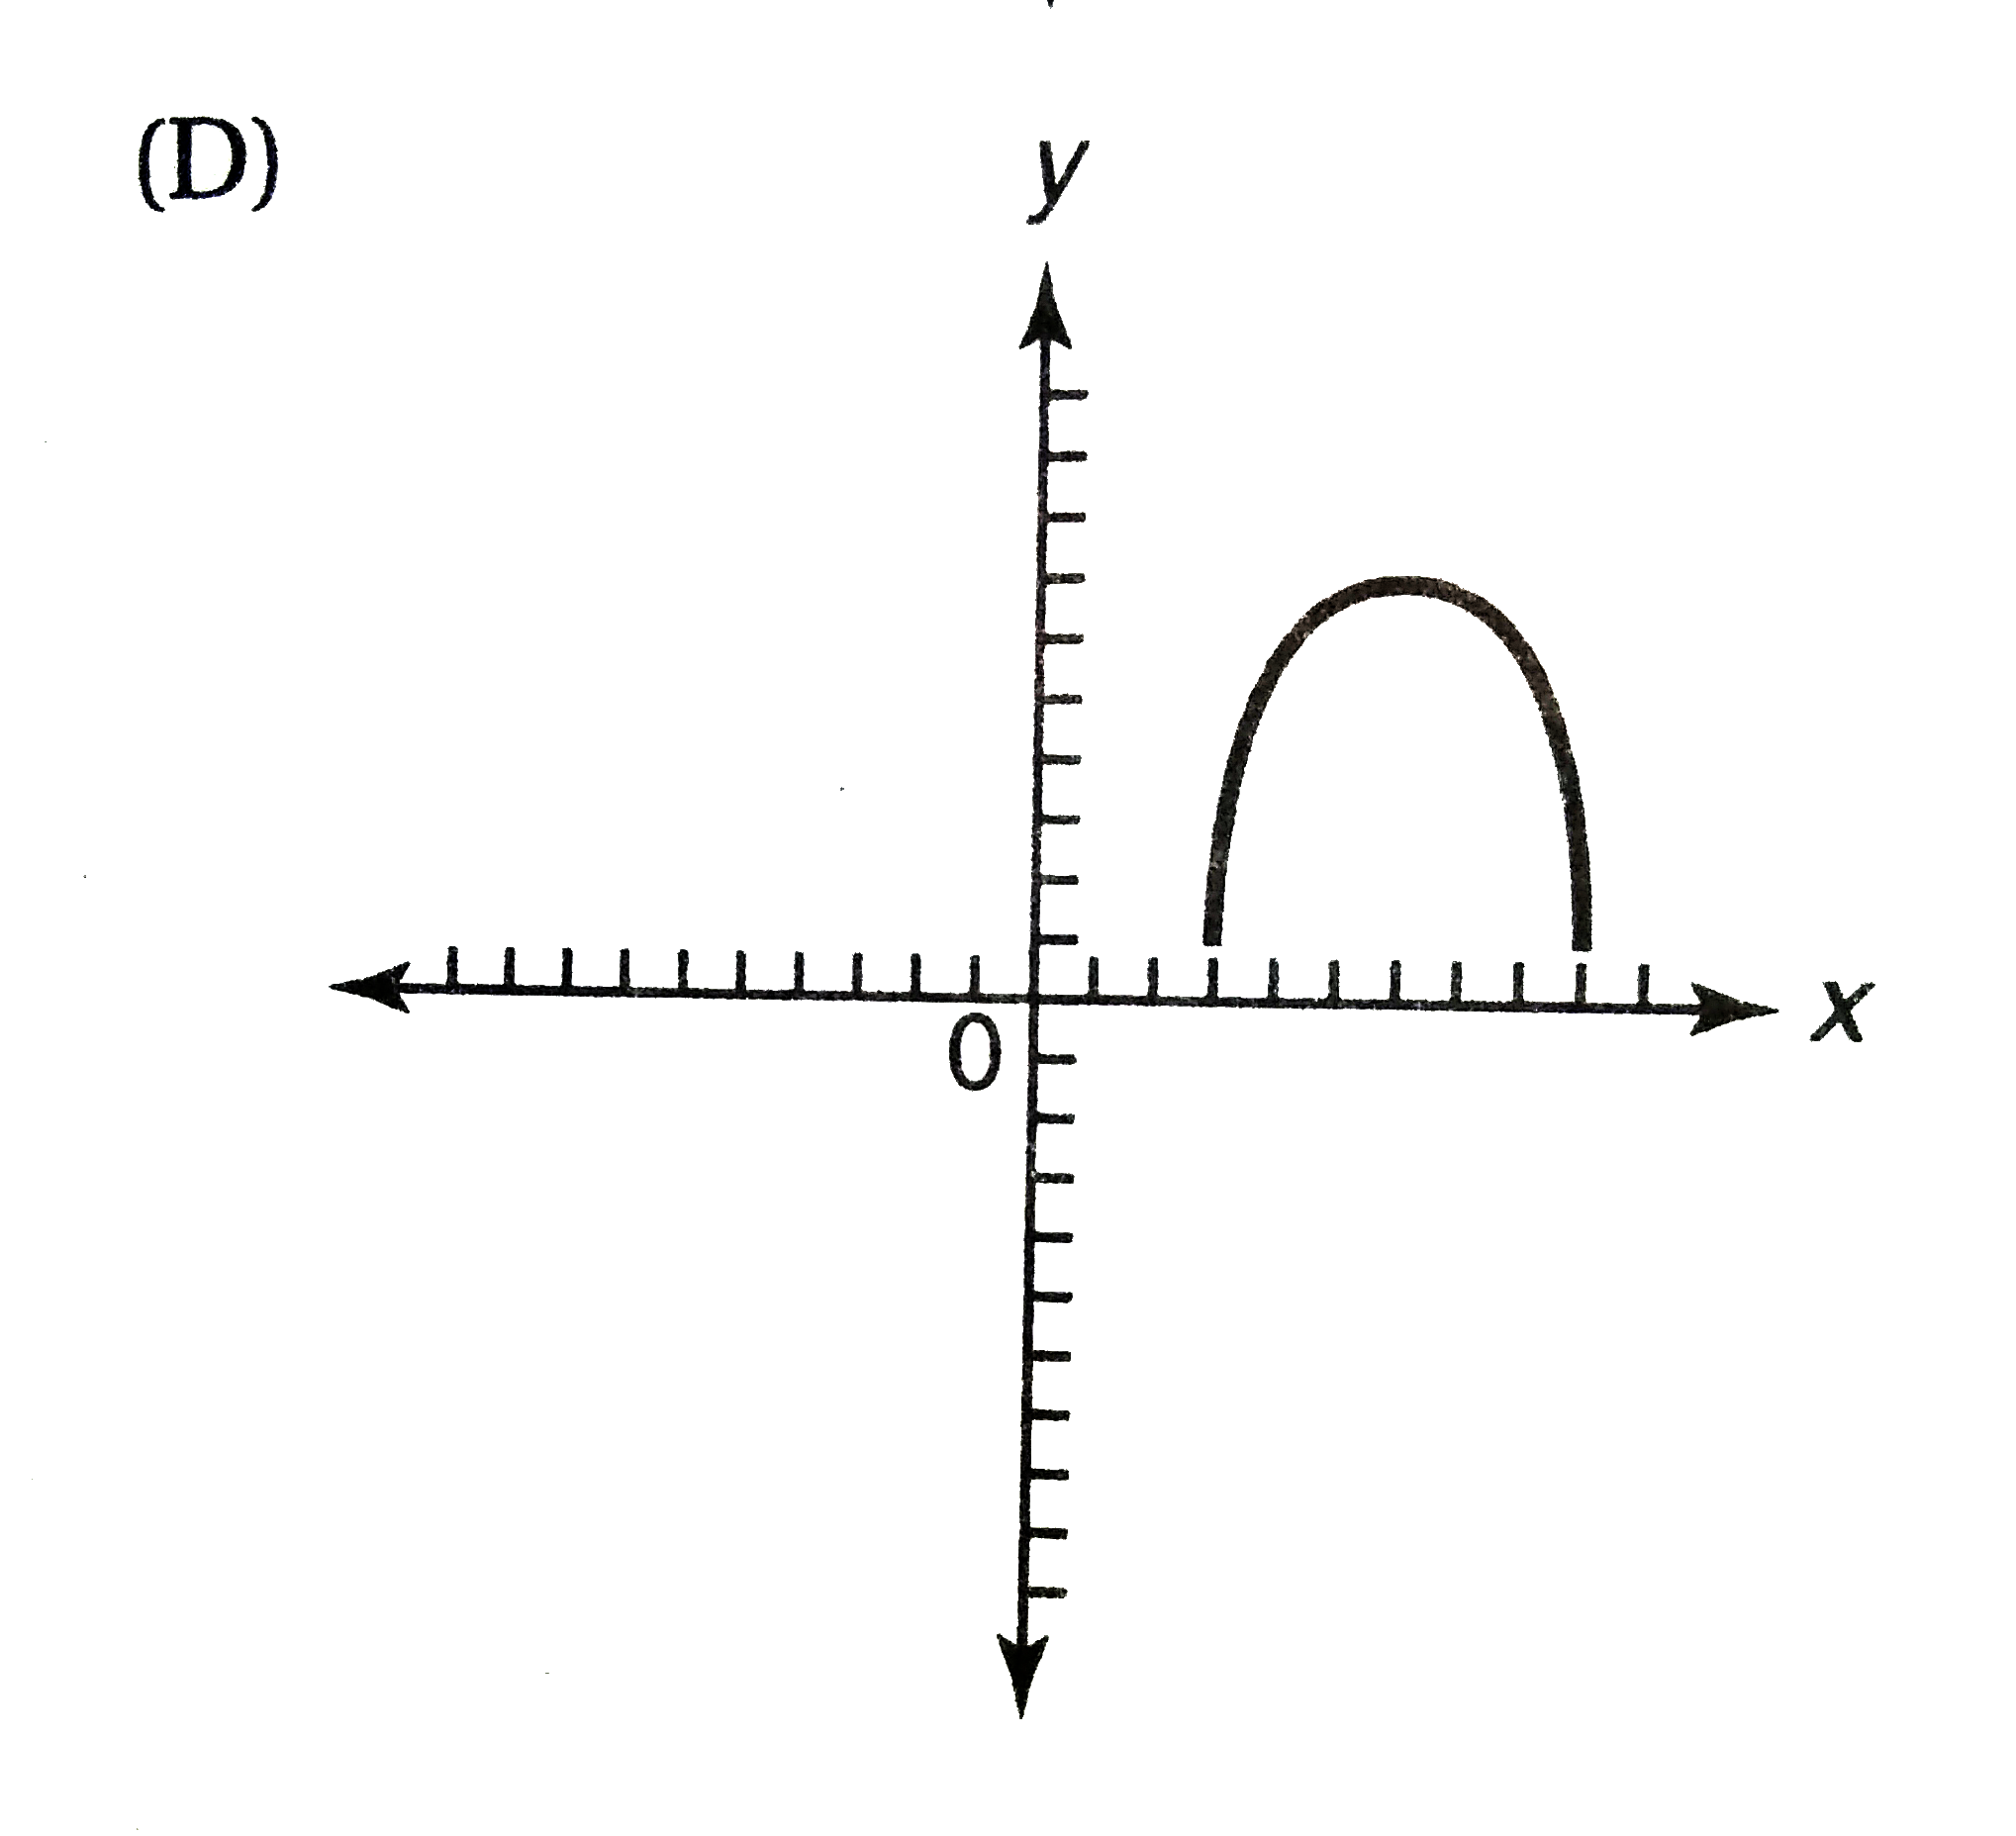
Draw the graph of y=log2x.
View SolutionDraw the graph of y=1logex
View SolutionThe graph shown the variation with times t of the velocity v of an object . Which one of the following graphs best represents the variation of acceleration a of the object with time t?
 View Solution
Draw the graph of y=−logex.
View Solution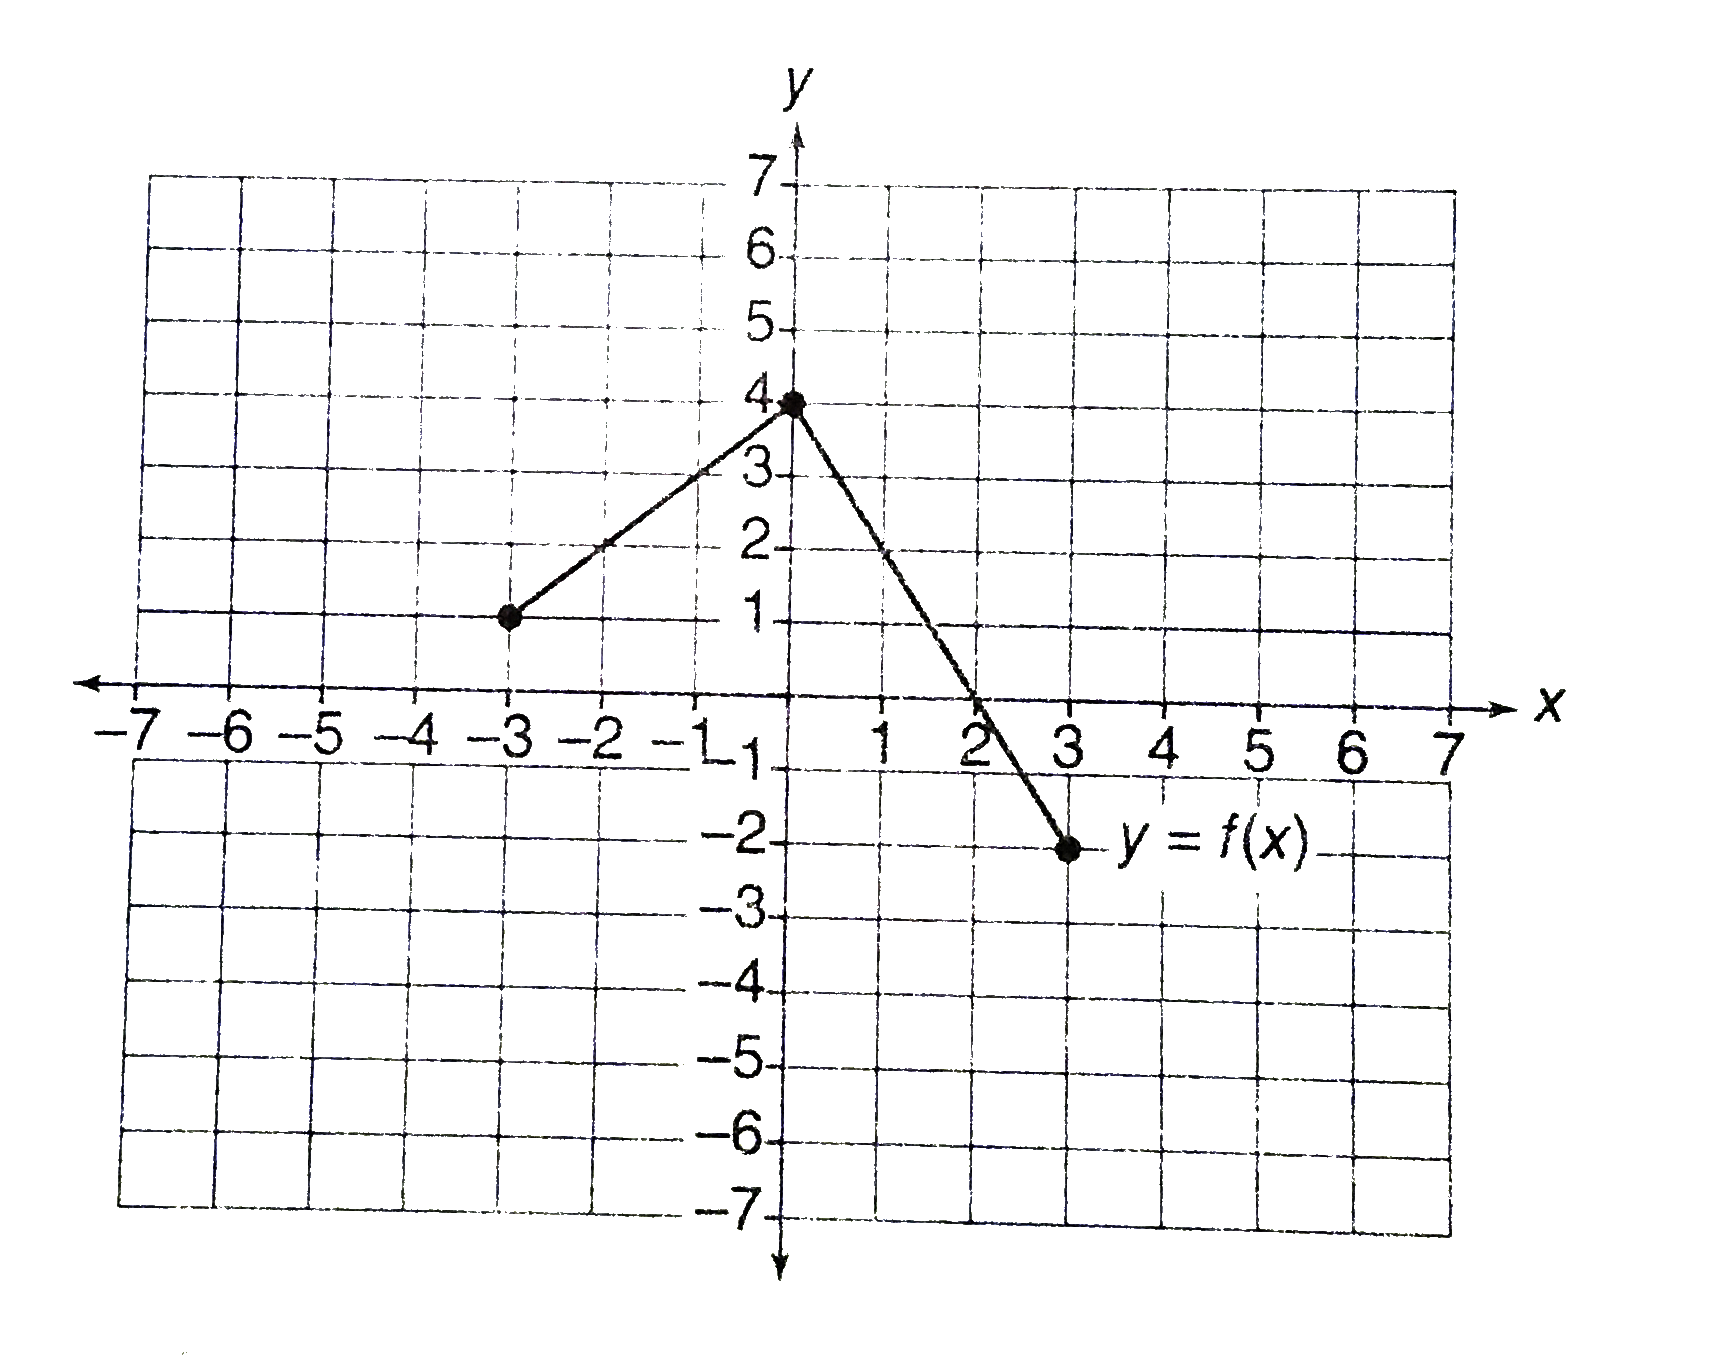
If the accomanying figure above shows the graph of function f, which of the following could represent the graph of y=f(x+1)?View Solution


