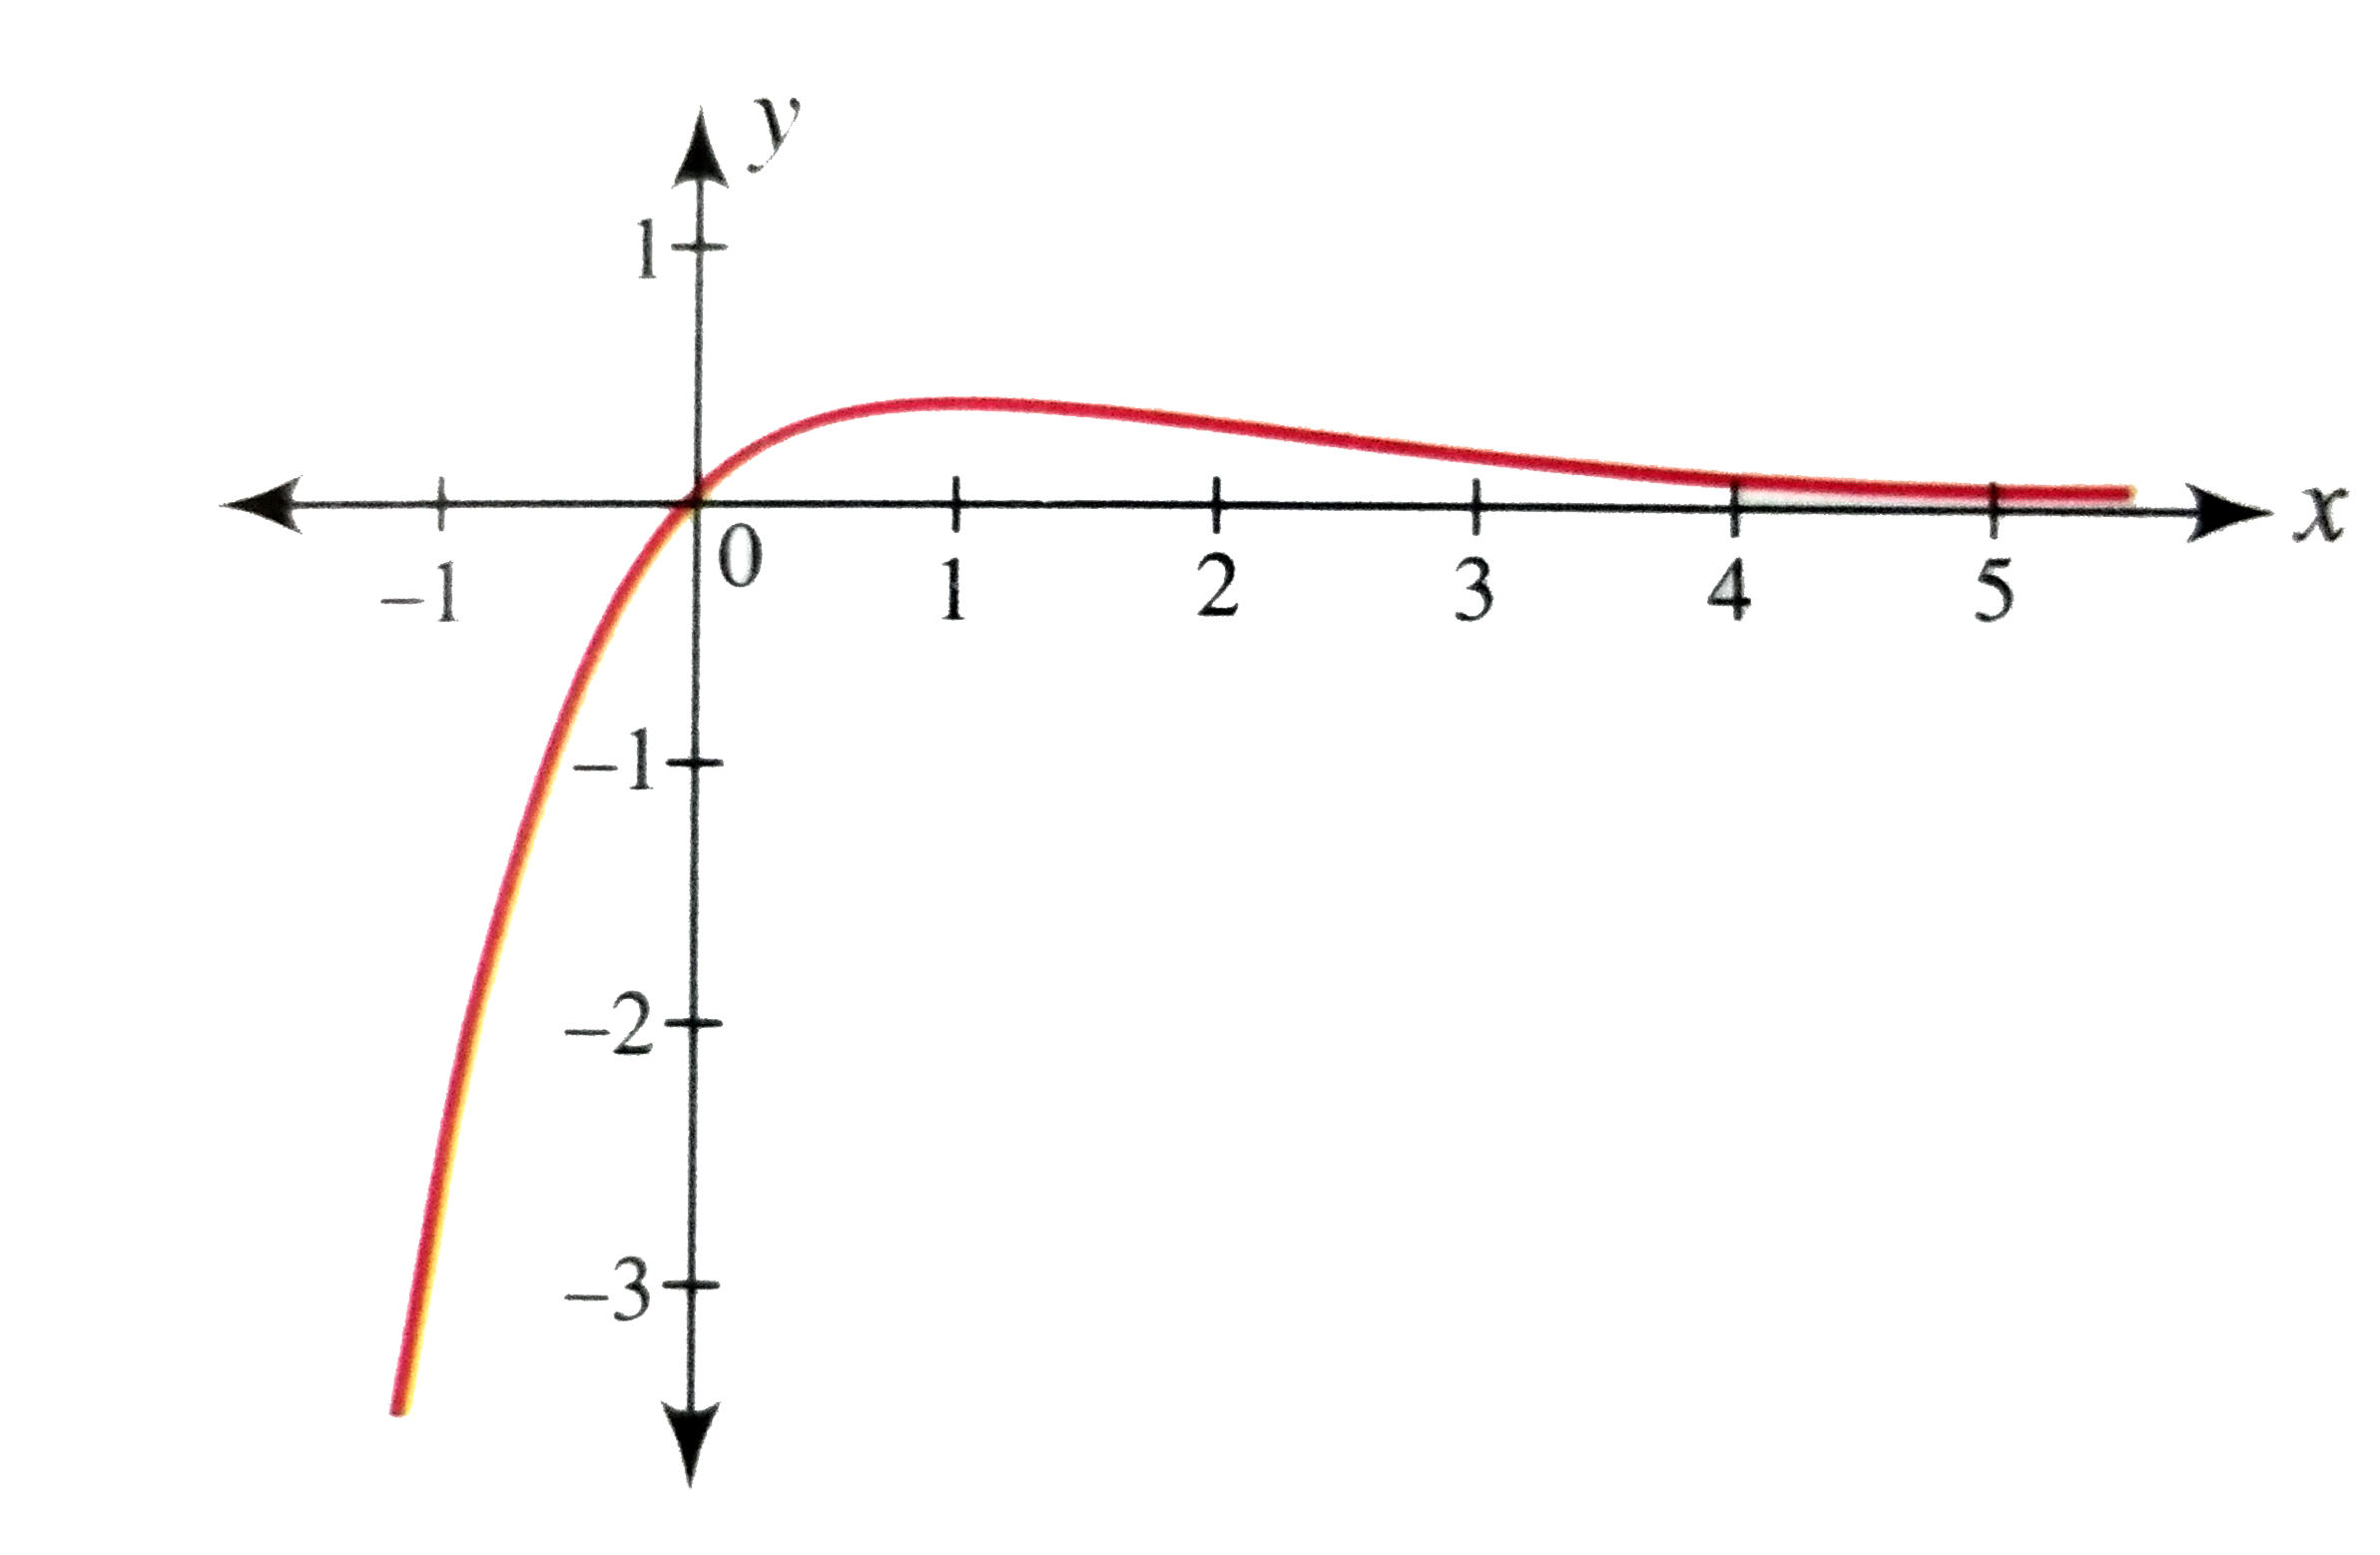
Draw the graph of y=1logex
Video Solution
Text Solution
y=xe−x
Let dydx=0
⇒e−x−xe−x=0⇒x=1
Also at x=1,dydx changes sign from +ve to −ve, hence x=1 is the point of maxima.
When x→−∞,y→−∞
Also limx→∞xe−x=limx→∞xex=limx→∞1ex=0,f(0)=0

Range of the function is (−∞,f(1)) or (−f∞,e−1)
|
Topper's Solved these Questions
Similar Questions
Draw the graph of y=(logex)2
View SolutionDraw the graph of y=x+1x
View SolutionDraw the graph of y=2x−1
View SolutionDraw the graph of y=−logex.
View SolutionDraw the graph of y=|x|
View SolutionDraw the graph of y=loge(−x),−logex,y=|logex|,y=loge|x| and y=|loge|x|| transforming the graph of y=logex.
View SolutionDraw the graph of y=|loge(x+3)|.
View SolutionDraw the graph of y=loge(x2−1)
View SolutionDraw the graph of y=loge(x+3),
View SolutionDraw the graph of y=loge(x3−x)
View Solution