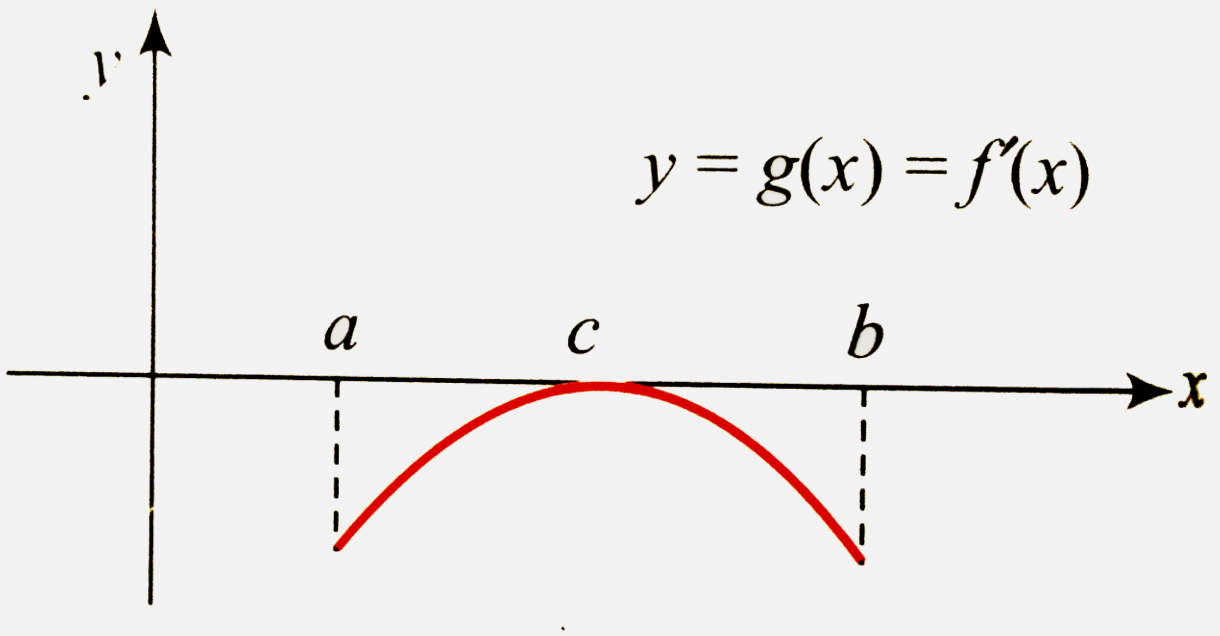
The graph of y =g(x) =f(X) is as shown in the following figure analyse this graph and answer the following question
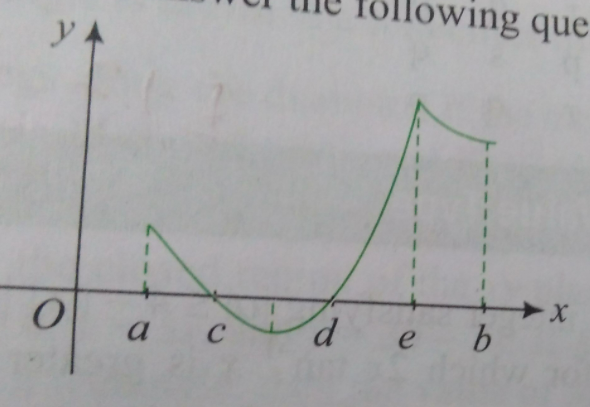
Number of points of inflectionn the graph of y = f(x) for a<x<b has
0
1
2
can't say anything
The correct Answer is:3

Clearly one point of inflection lies in the interval (a,d) wher derivatie of f(x) is zero
also f(X) does not exist at x=e but f(x) changes sign in the neightbourhood of e so x =e another point of inflection
Topper's Solved these Questions
- MONOTONICITY AND MAXIMA MINIMA OF FUNCTIONSBOOK - CENGAGE ENGLISHCHAPTER - MONOTONICITY AND MAXIMA MINIMA OF FUNCTIONSEXERCISE - Matrix Match Type
14 Videos
- MONOTONICITY AND MAXIMA MINIMA OF FUNCTIONSBOOK - CENGAGE ENGLISHCHAPTER - MONOTONICITY AND MAXIMA MINIMA OF FUNCTIONSEXERCISE - Linked comprehension Type
2 Videos
- METHODS OF DIFFERENTIATIONBOOK - CENGAGE ENGLISHCHAPTER - METHODS OF DIFFERENTIATIONEXERCISE - Single Correct Answer Type
46 Videos
- MONOTONOCITY AND NAXINA-MINIMA OF FUNCTIONSBOOK - CENGAGE ENGLISHCHAPTER - MONOTONOCITY AND NAXINA-MINIMA OF FUNCTIONSEXERCISE - Comprehension Type
6 Videos
Similar Questions
Knowledge Check
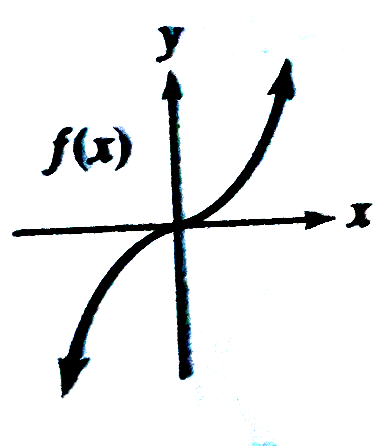
The graph of f(x) is shown above , Which of the following represents the graph of f(x-3) ?A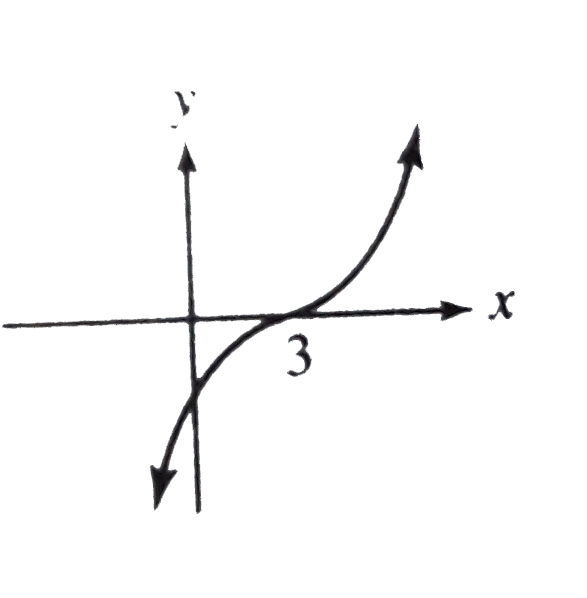 B
B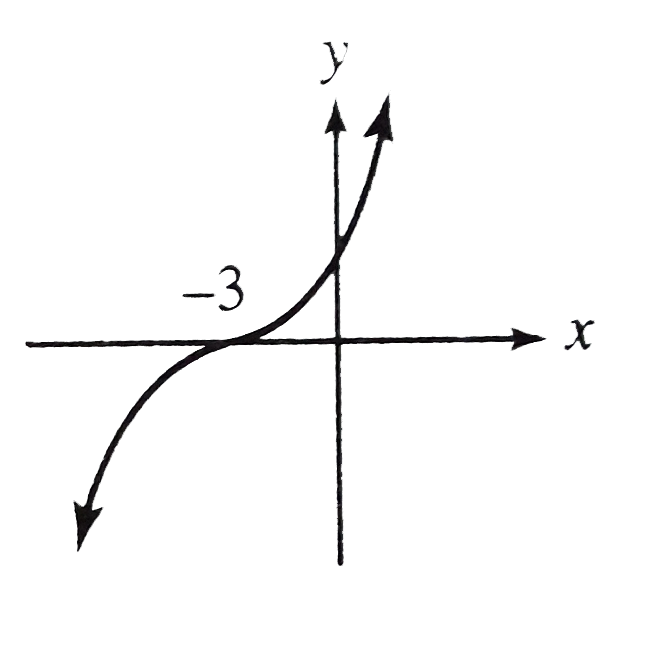 C
C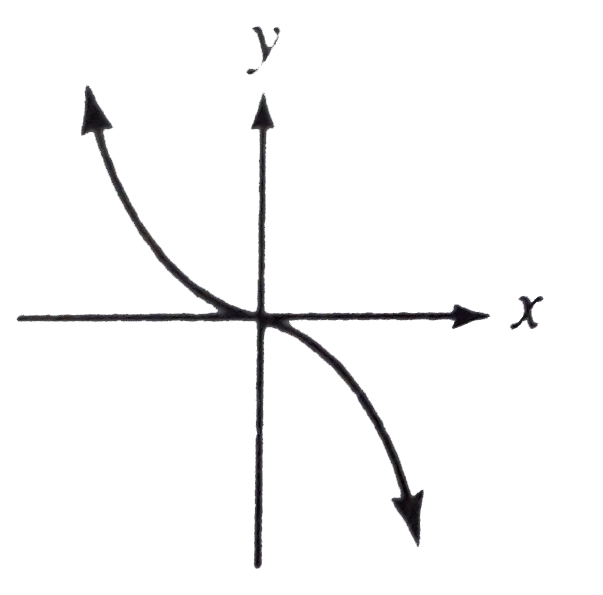 D
D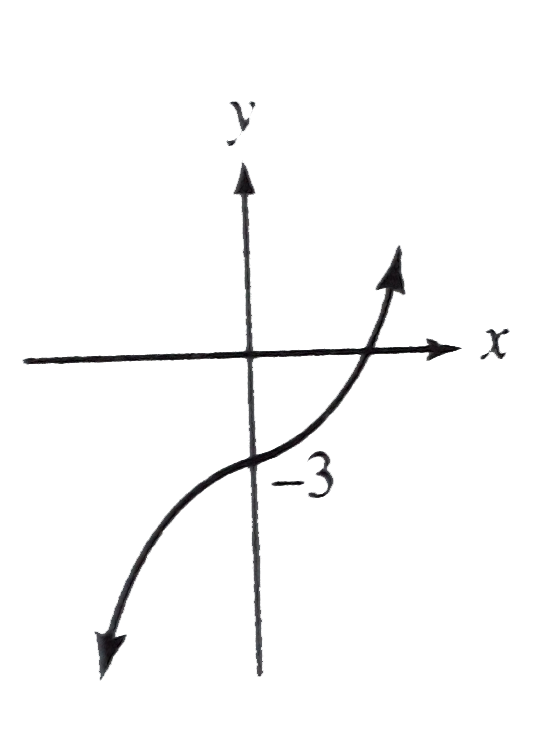
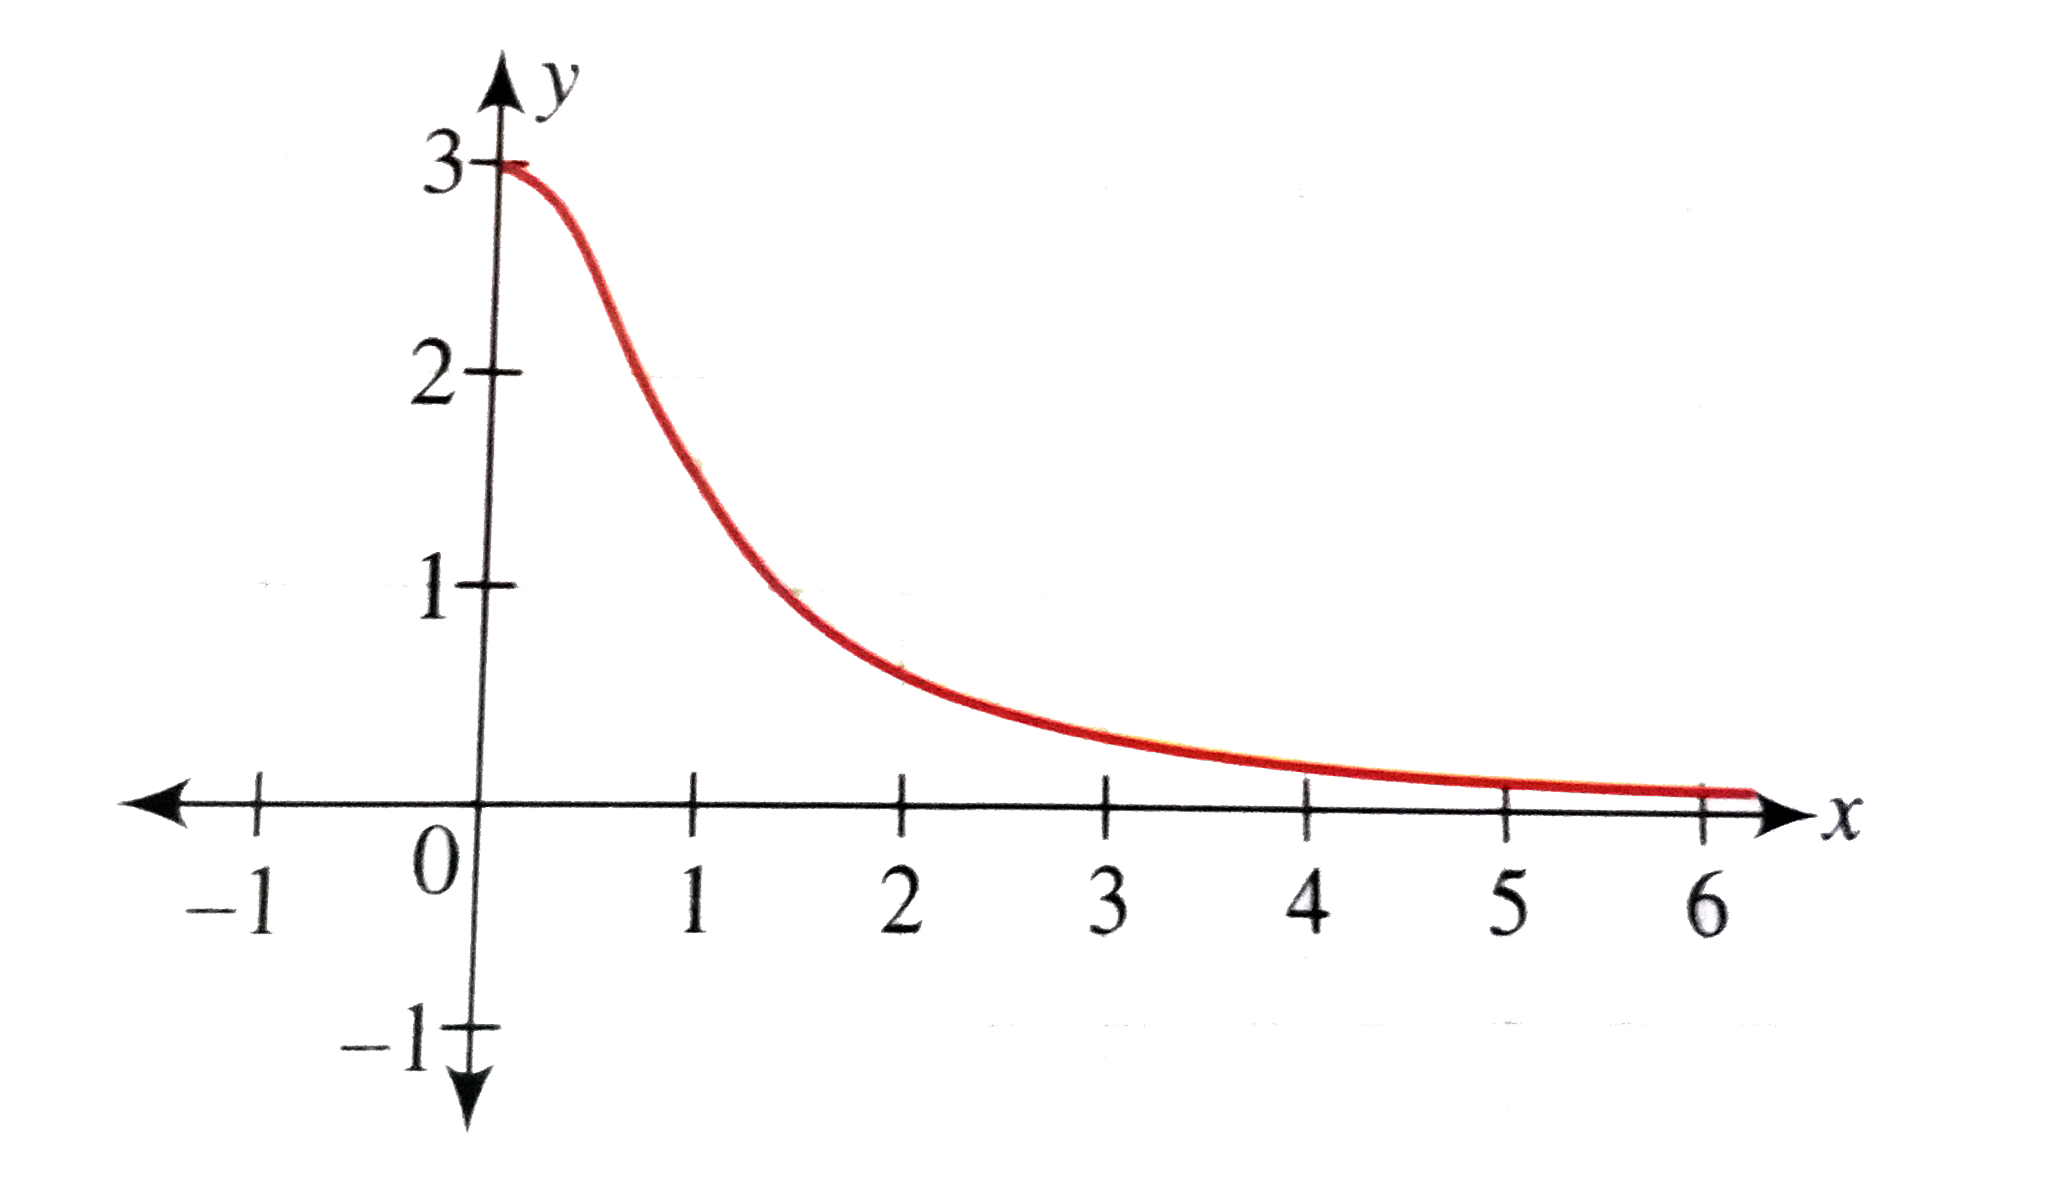
Graph of y=f(x) is as shown in the following figure.
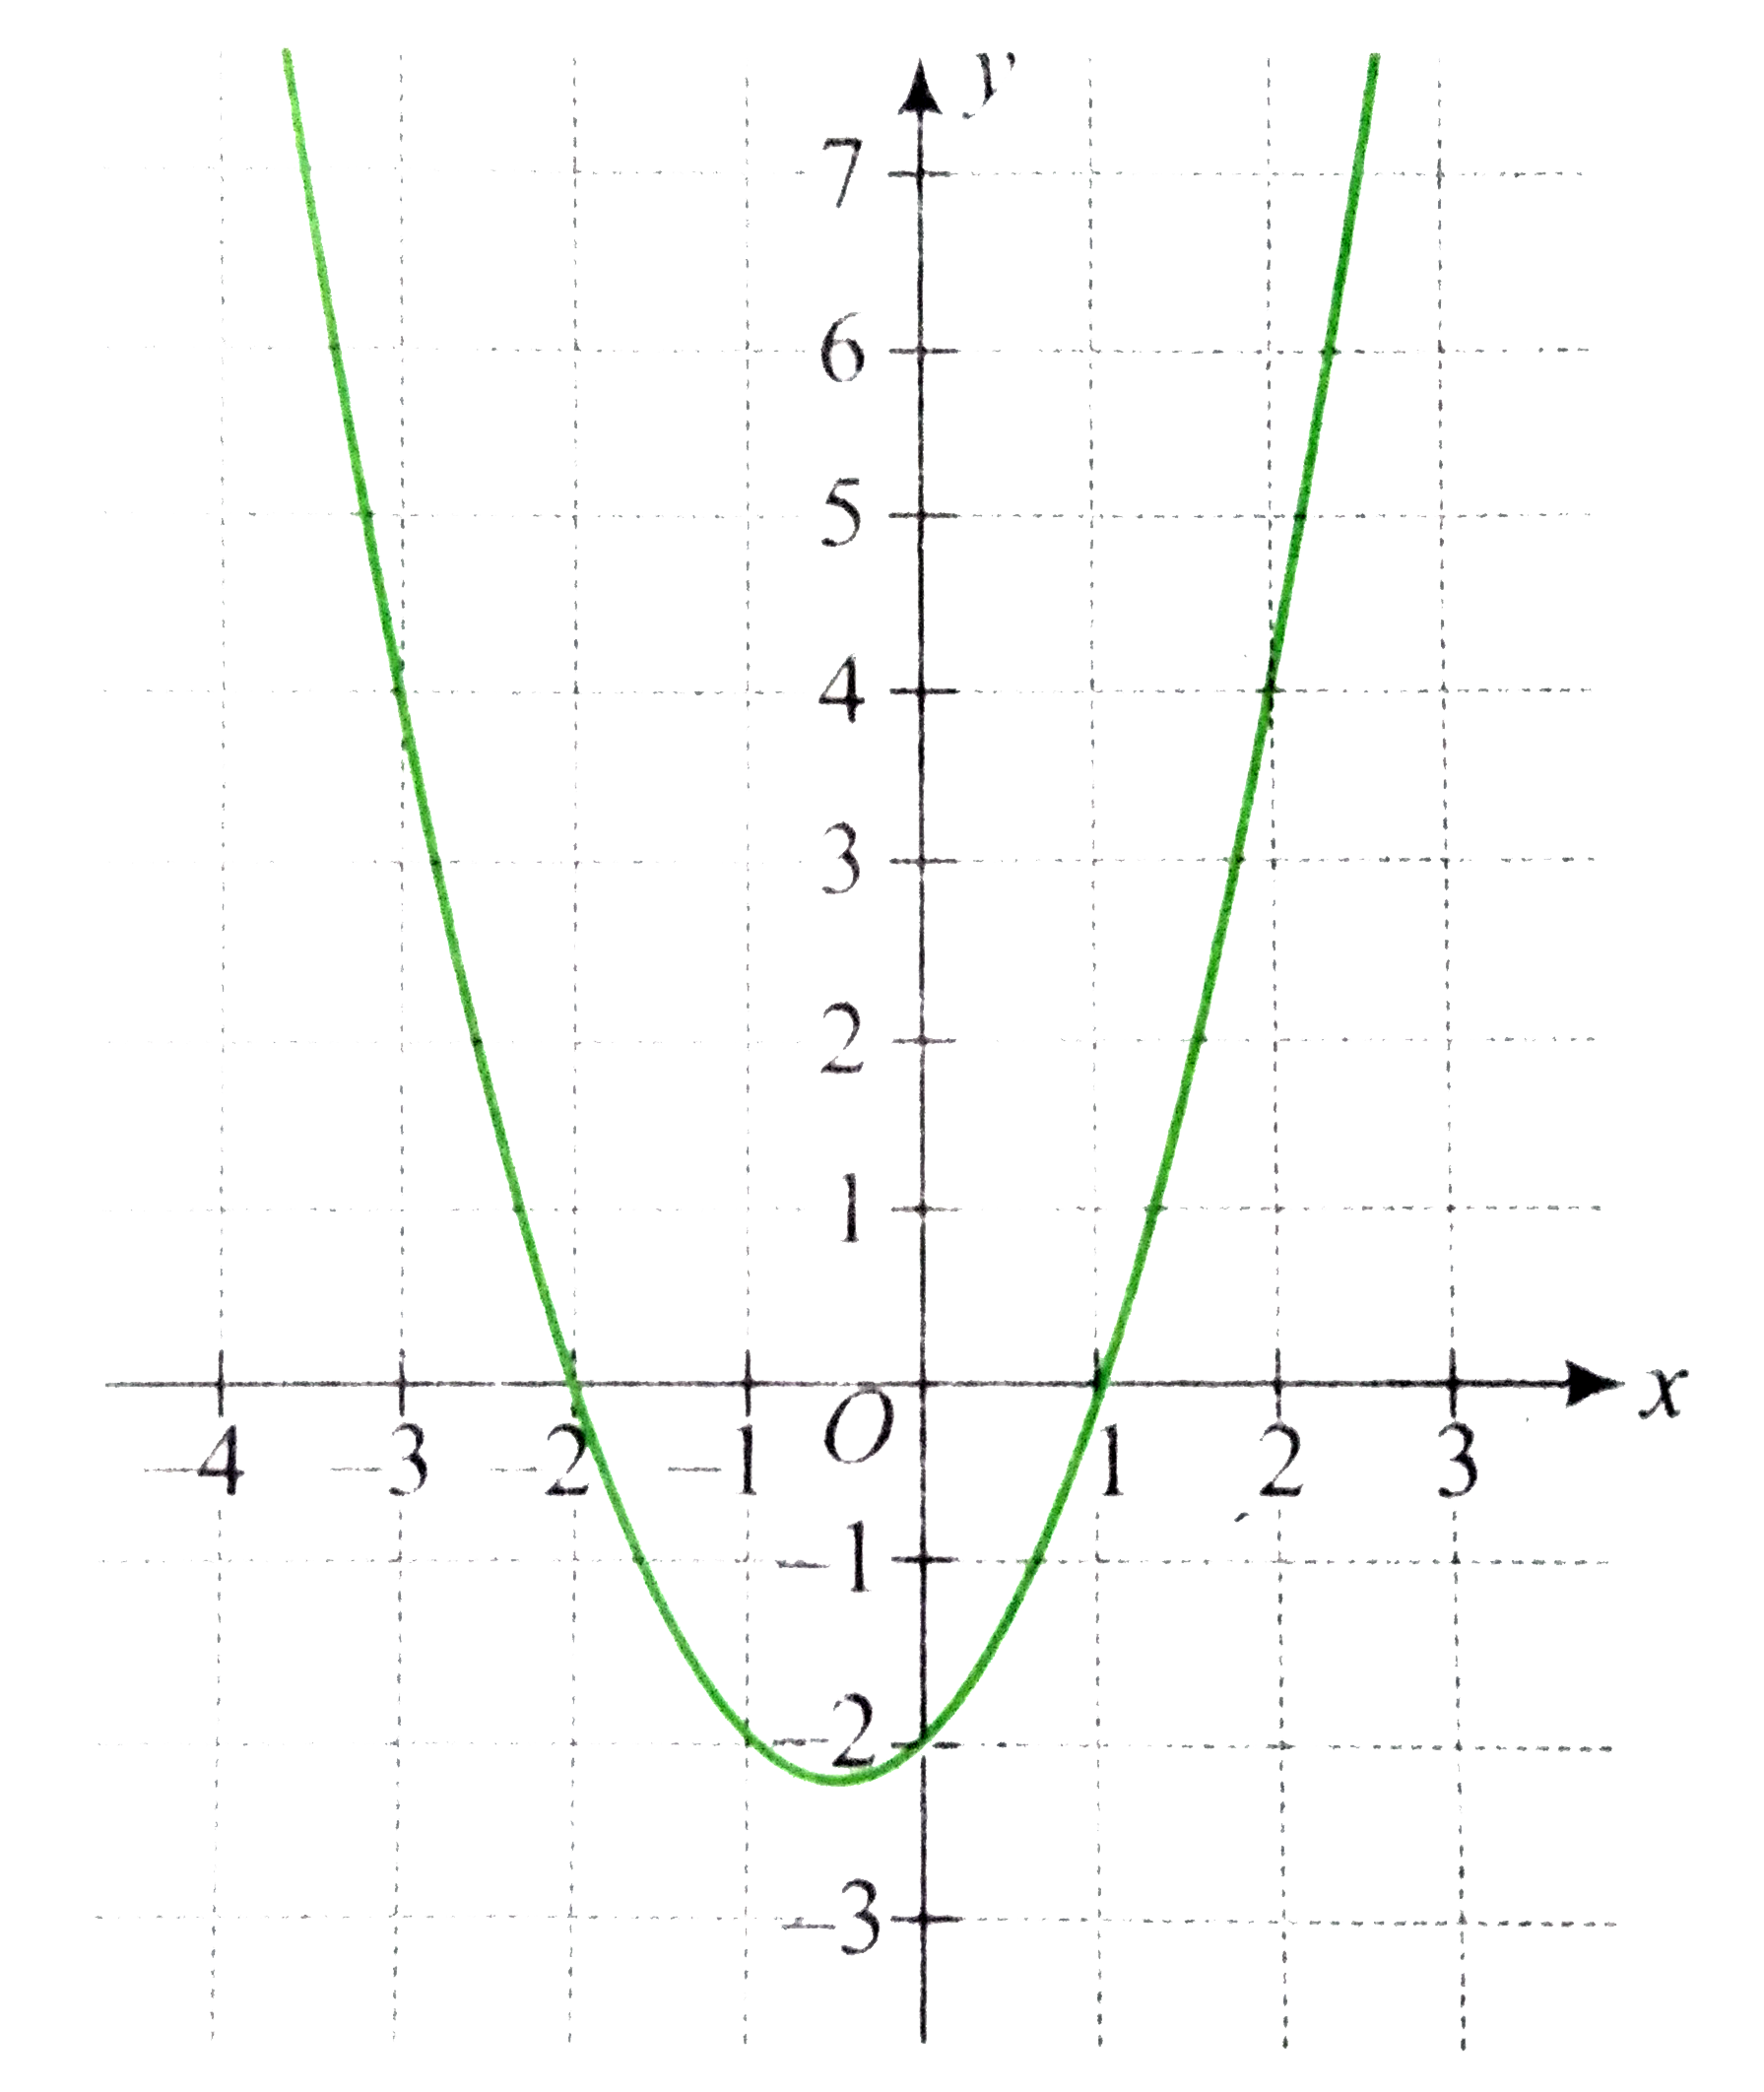
Find the roots of the following equations
f(x)=0
f(x)=4
f(x)=x+2
View SolutionThe graph of y=|f(x)| is as shown in the following figure Fig Graph of y=f(x) may be a, b, c d is fig
View SolutionThe graph of y=f(x) is as shown in the following figure.
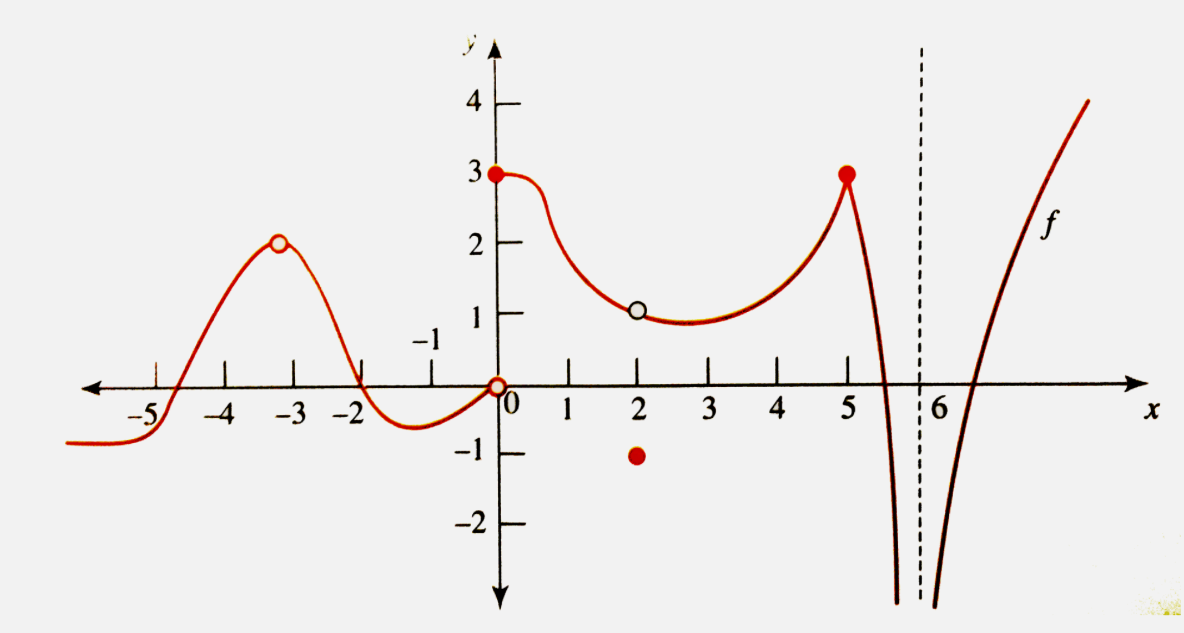
Identify the points of discontinuity and give the reason for the same.
View SolutionIf the graph of y=|f(x)| is as shown in figure
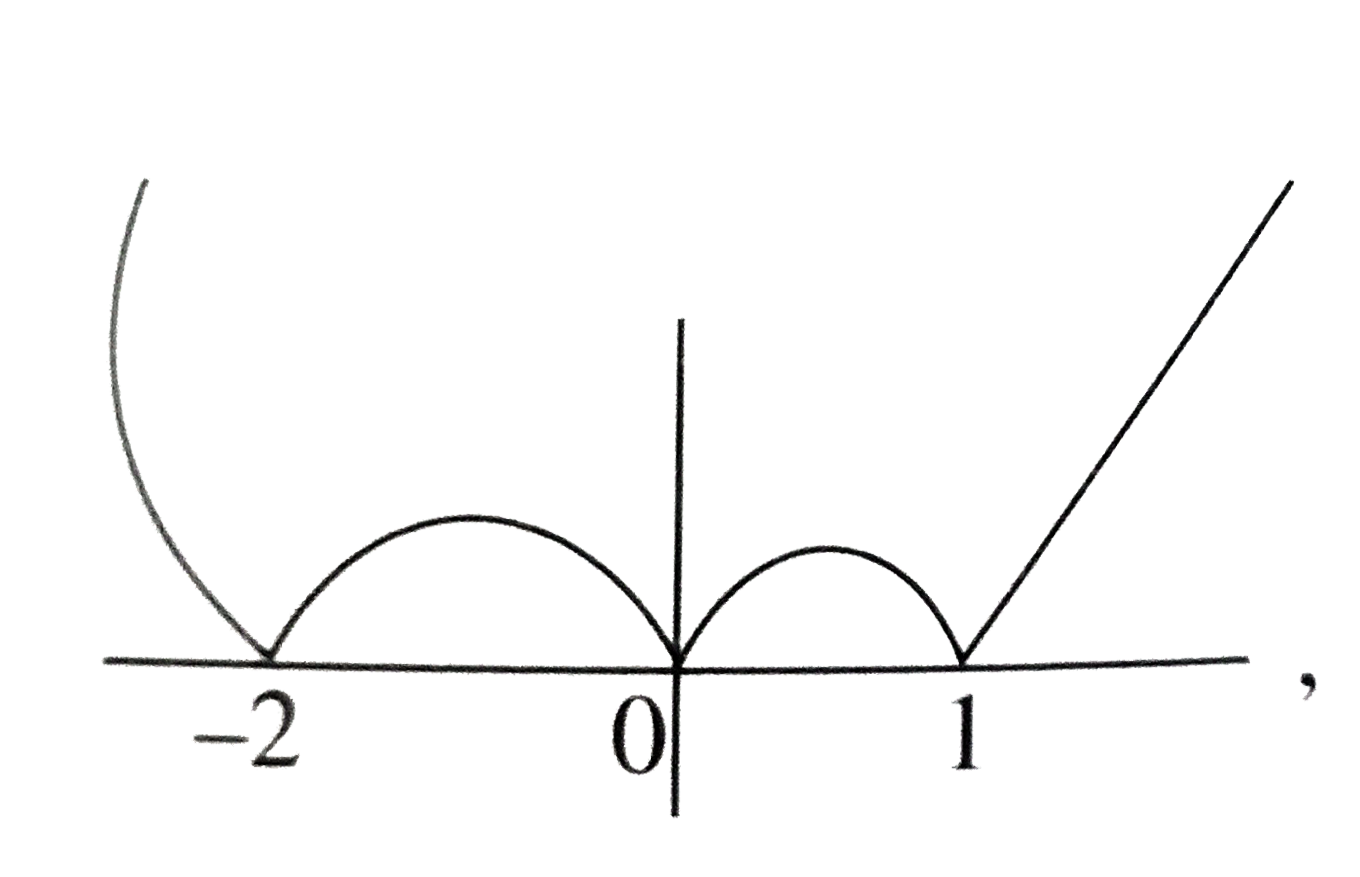 then the graph of y=f(x) may be
View SolutionFollowing is the graph of y = f' (x) , given that f(c) = 0. Analyse the graph and answer the following questions.
(a) How many times the graph of y = f(x) will intersect the x - axis?
(b) Discuss the type of roots of the equation f (x) = 0, a≤x≤b.
(c) How many points of inflection the graph of y=f(x),a≤x≤b, has?
(d) Find the points of local maxima/minima ofy=f(x),a<xb.
(e) How many roots equation f''(x)=0 has?
View Solution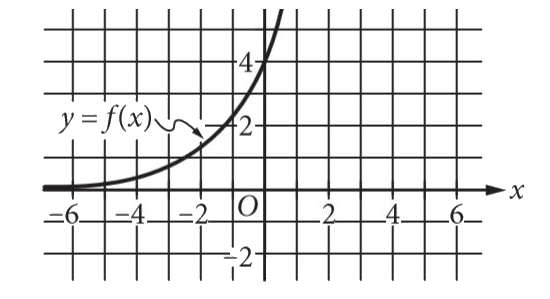
The graph of y = f (x) is shown in the xy -plane. What is the value of f (0) ?
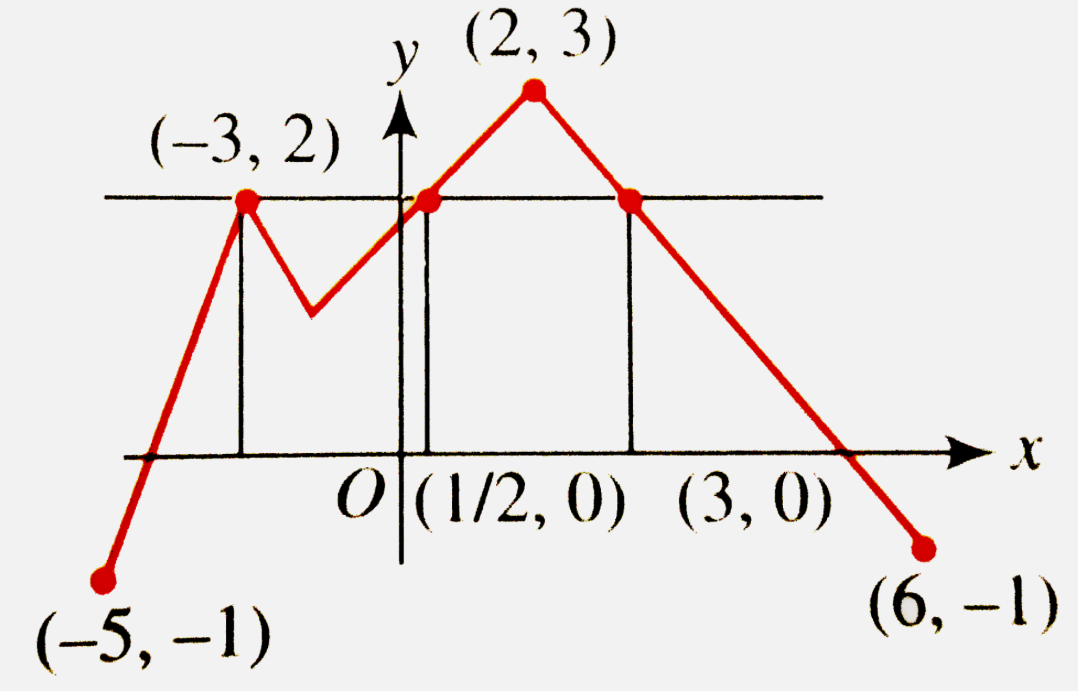
View SolutionThe graph of y = f(x) is shown, find the number of solution of f(f(x)) = 2.
View Solution

