The graph of y =g(x) =f(X) is as shown in the following figure analyse this graph and answer the following question

The graph of y=f(x) for has
no point of extream
one point of extrema
two points extrema
can't say anything
The correct Answer is:3

f(X) changes sing form positive to negative at x=c
So x=c is point maxima
F(X) changes sign form negative to postive at x=d
So x =d is point minima
Topper's Solved these Questions
- MONOTONICITY AND MAXIMA MINIMA OF FUNCTIONSBOOK - CENGAGE ENGLISHCHAPTER - MONOTONICITY AND MAXIMA MINIMA OF FUNCTIONSEXERCISE - Matrix Match Type
14 Videos
- MONOTONICITY AND MAXIMA MINIMA OF FUNCTIONSBOOK - CENGAGE ENGLISHCHAPTER - MONOTONICITY AND MAXIMA MINIMA OF FUNCTIONSEXERCISE - Linked comprehension Type
2 Videos
- METHODS OF DIFFERENTIATIONBOOK - CENGAGE ENGLISHCHAPTER - METHODS OF DIFFERENTIATIONEXERCISE - Single Correct Answer Type
46 Videos
- MONOTONOCITY AND NAXINA-MINIMA OF FUNCTIONSBOOK - CENGAGE ENGLISHCHAPTER - MONOTONOCITY AND NAXINA-MINIMA OF FUNCTIONSEXERCISE - Comprehension Type
6 Videos
Similar Questions
The graph of y =g(x) =f(X) is as shown in the following figure analyse this graph and answer the following question
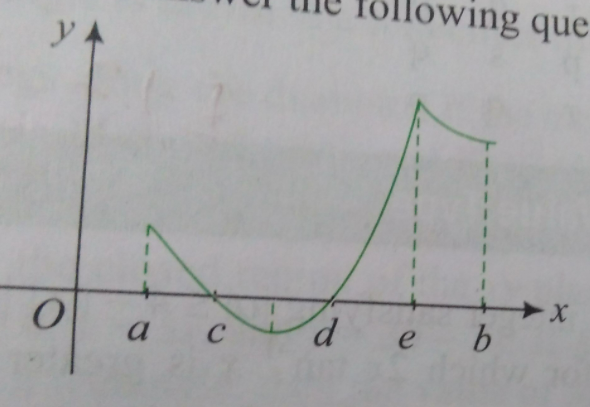
Number of points of inflectionn the graph of y = f(x) for a<x<b has
View SolutionLet graph of y=f(x) is
View SolutionLet graph of y=f(x) is
View SolutionThe graph of y=f(x) is as shown in the following figure. Draw the graph of y=[f(x)].
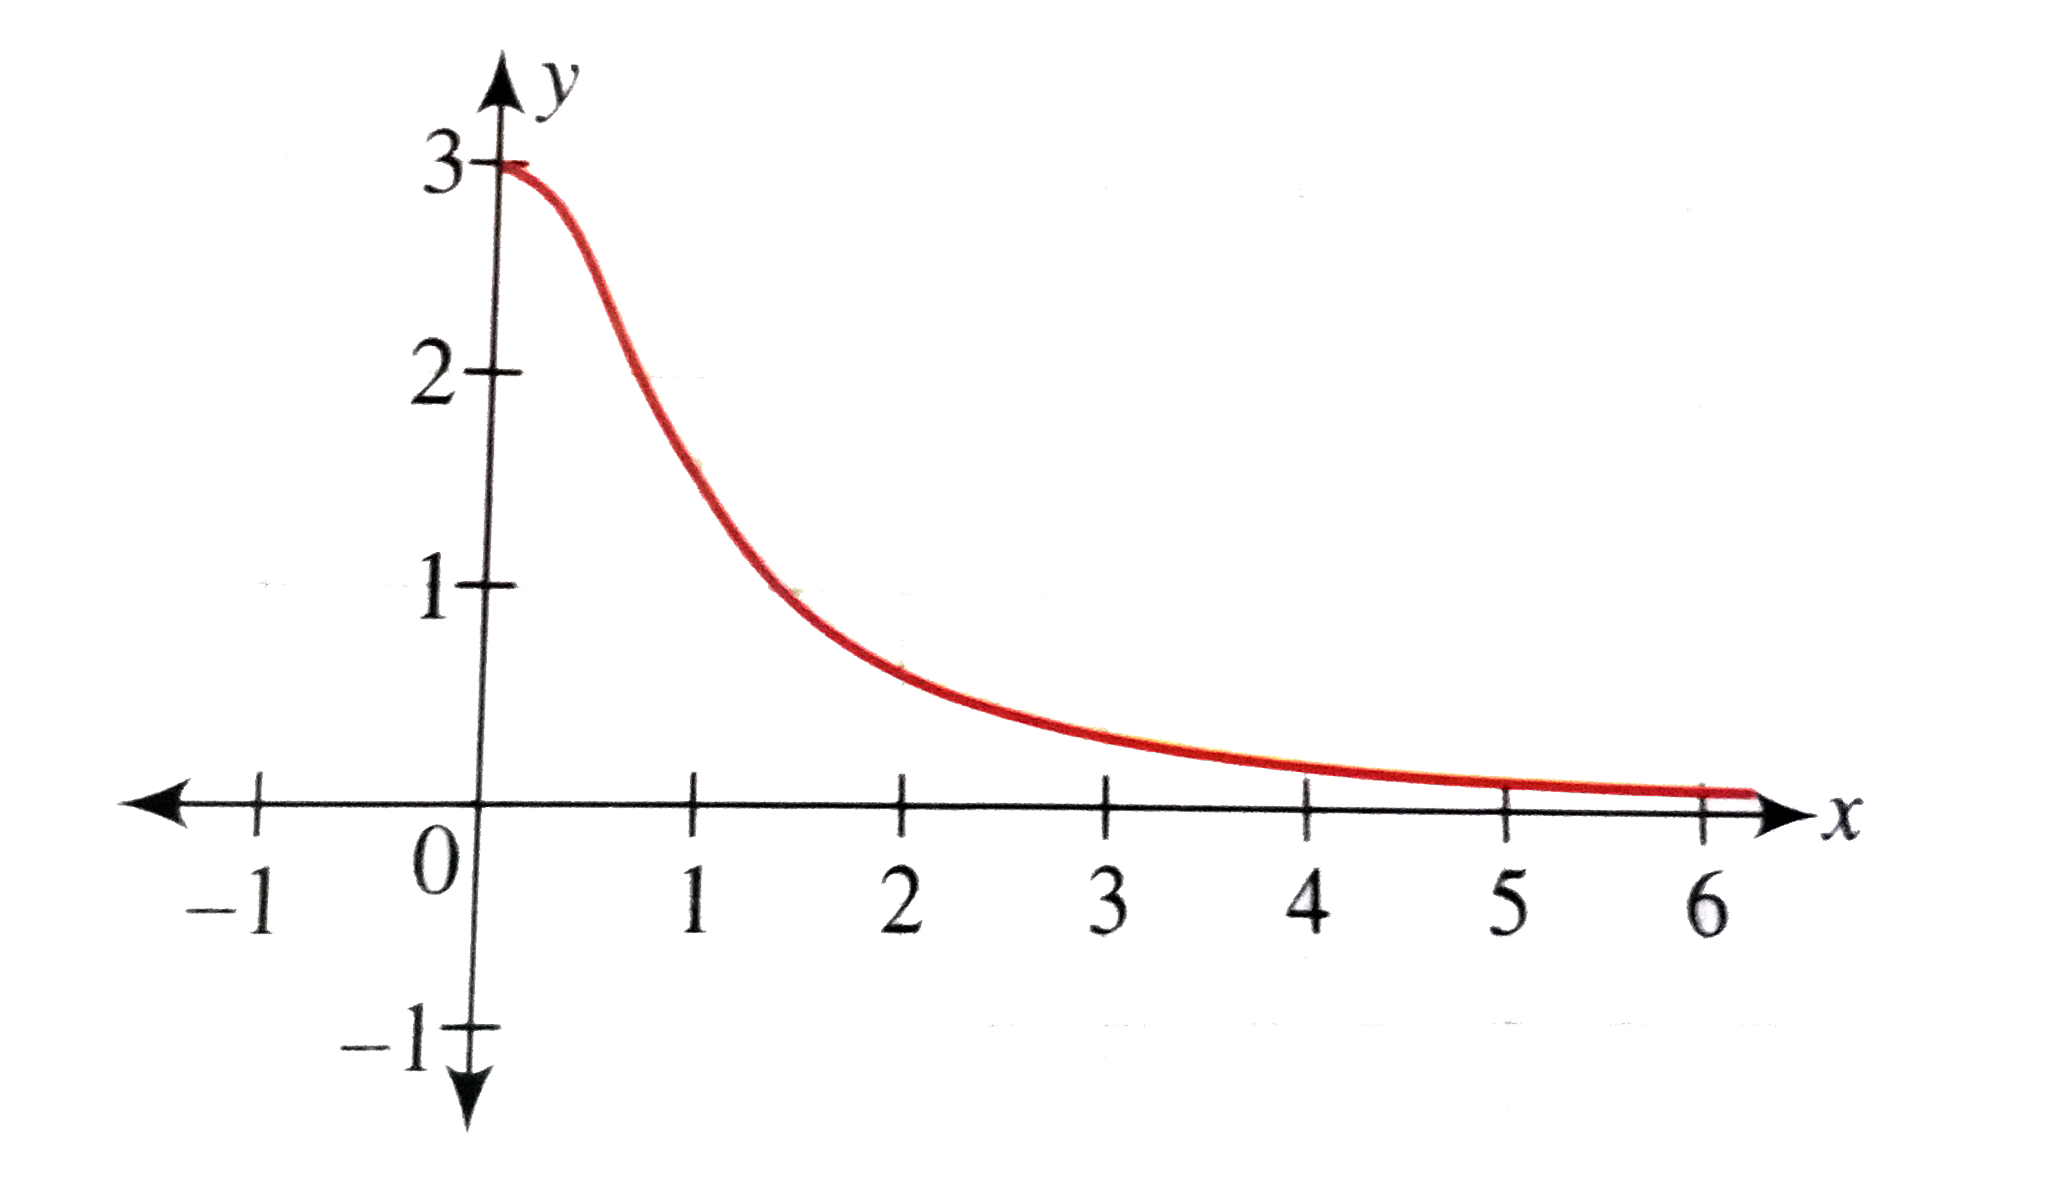
View SolutionThe graph of y=f(x) is as shown in the following figure. Draw the graph of y=[f(x)].

View SolutionGiven the graph of y=f(x)
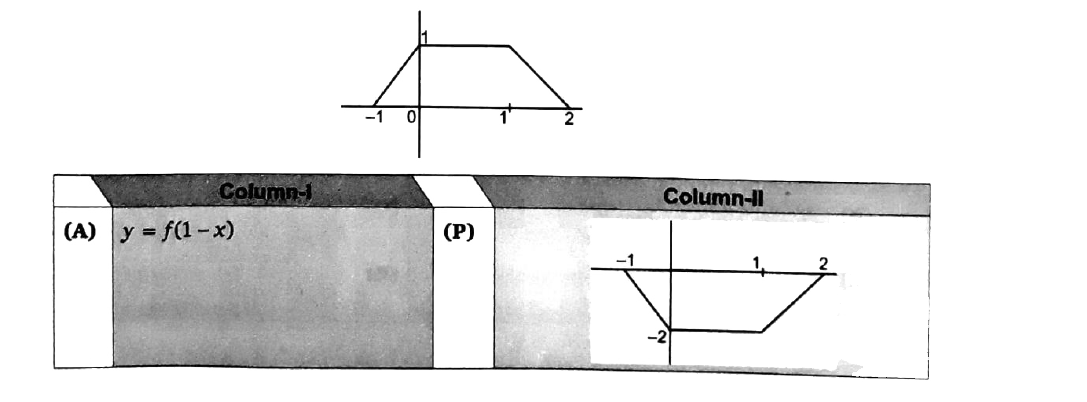
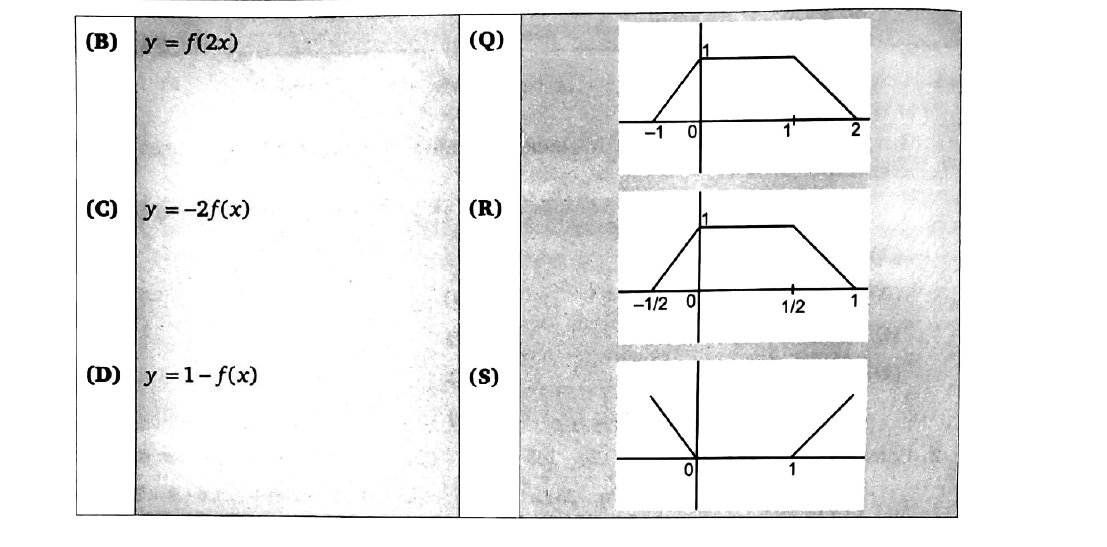
View SolutionGiven the graph of y=f(x)

View SolutionThe graph of y=f(x) is as shown ,Which of the following is/are CORRECT?
View SolutionGraph of y=f(x) is given as shown in the following figure. Draw the graph of y=sgn(f(x)).
View SolutionGraph of y=f(x) is as shown in the following figure.
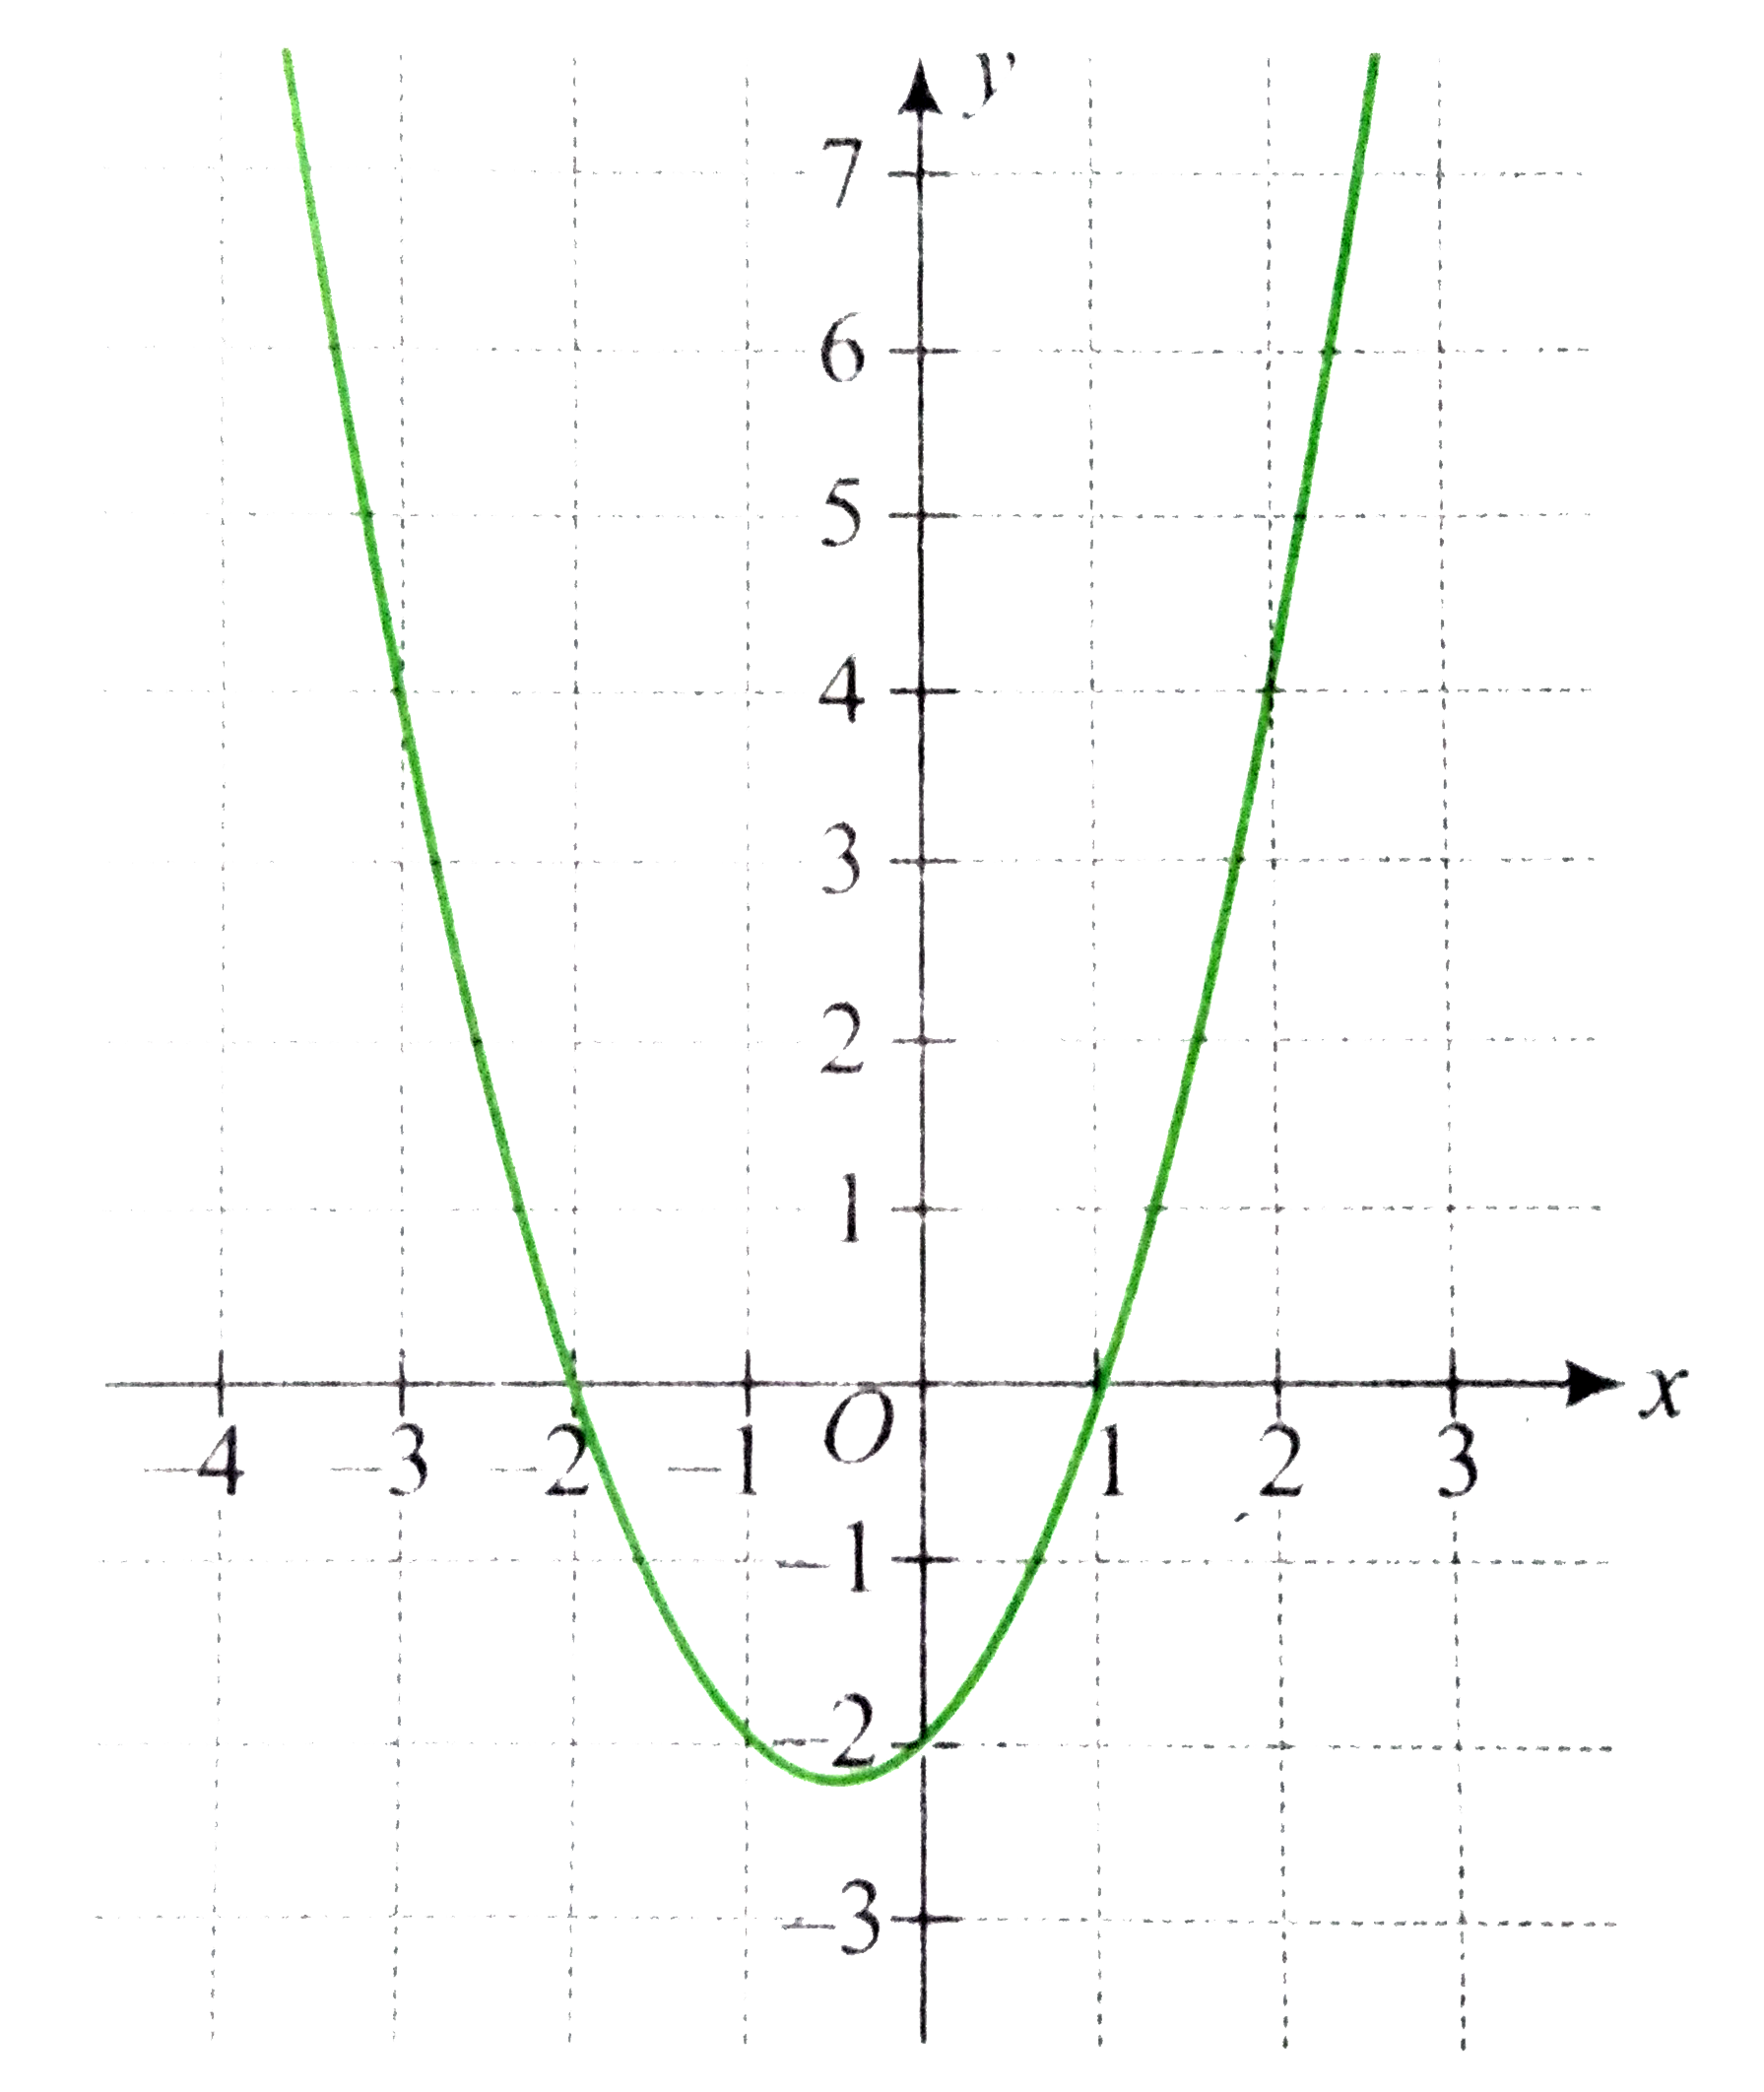
Find the roots of the following equations
f(x)=0
f(x)=4
f(x)=x+2
View Solution
