The following table shows the number of Maruti cars sold by the five dealers in a particular month: Dealer, Saya, Bagga Links, D.D. Motors, Bhasin Motor, Competent Motors Cars sold, 60, 40, 20, 15, 10 Represent the above information by a pictograph.
Step by step video & image solution for The following table shows the number of Maruti cars sold by the five dealers in a particular month: Dealer, Saya, Bagga Links, D.D. Motors, Bhasin Motor, Competent Motors Cars sold, 60, 40, 20, 15, 10 Represent the above information by a pictograph. by Maths experts to help you in doubts & scoring excellent marks in Class 9 exams.
Updated on:21/07/2023Topper's Solved these Questions
Similar Questions
The following data shows the number of students opting different subject in a college: Subjects, English, Maths, Physics, Chemistry, Eco., Commerce No. of Students, 45, 60, 20, 30, 10, 15 Construct a pie-diagram to represent the above data.
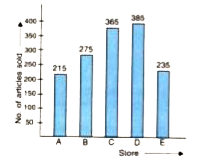
View SolutionThe given bar graph shows the number of identical articles sold by 5 different stores A, B, C, D and E during a particular month.

Study the bar graph and answer the following questions :
(i) Which store sold the largest number of articles ?
(ii) By what per cent is the sale of store D more than that of store B ?
(iii) Find the ratio of the total sale of the two highest selling stores to the total sale of the two least selling stores.
(iv) By how much must store E increase its sale to catch up with its nearest rival store ?
View SolutionThe quantity of petrol filed in a car and the cost of petrol are given in the following table: Litres of petrol filled:, 10, 15, 20, 25 Cost of petrol:, 500, 750, 1000, 1250 Draw a graph representing the above data: Also, find the cost of 12 litres of petrol using the graph. How much petrol can be purchased for Rs. 800?
View SolutionThe sales figure of two car dealers during January 2013 showed that dealer A sold 5 deluxe, 3 premium and 4 standard cars, while dealer B sold 7 deluxe, 2 premium and 3 standard cars. Total sales over the 2 month period of January-February revealed that dealer A sold 8 deluxe 7 premium and 6 standard cars. In the same 2 month period, dealer B sold 10 deluxe, 5 premium and 7 standard cars. Write 2 x 3 matrices summarizing sales data for January and 2 month period for each dealer.
View SolutionThe sales figure of two car dealers during January 2013 showed that dealer A sold 5 deluxe, 3 premium and 4 standard cars, while dealer B sold 7 deluxe, 2 premium and 3 standard cars. Total sales over the 2 month period of January-February revealed that dealer A sold 8 deluxe 7 premium and 6 standard cars. In the same 2 month period, dealer B sold 10 deluxe, 5 premium and 7 standard cars. Write 2×3 matrices summarizing sales data for January and 2-month period for each dealer.
View Solution
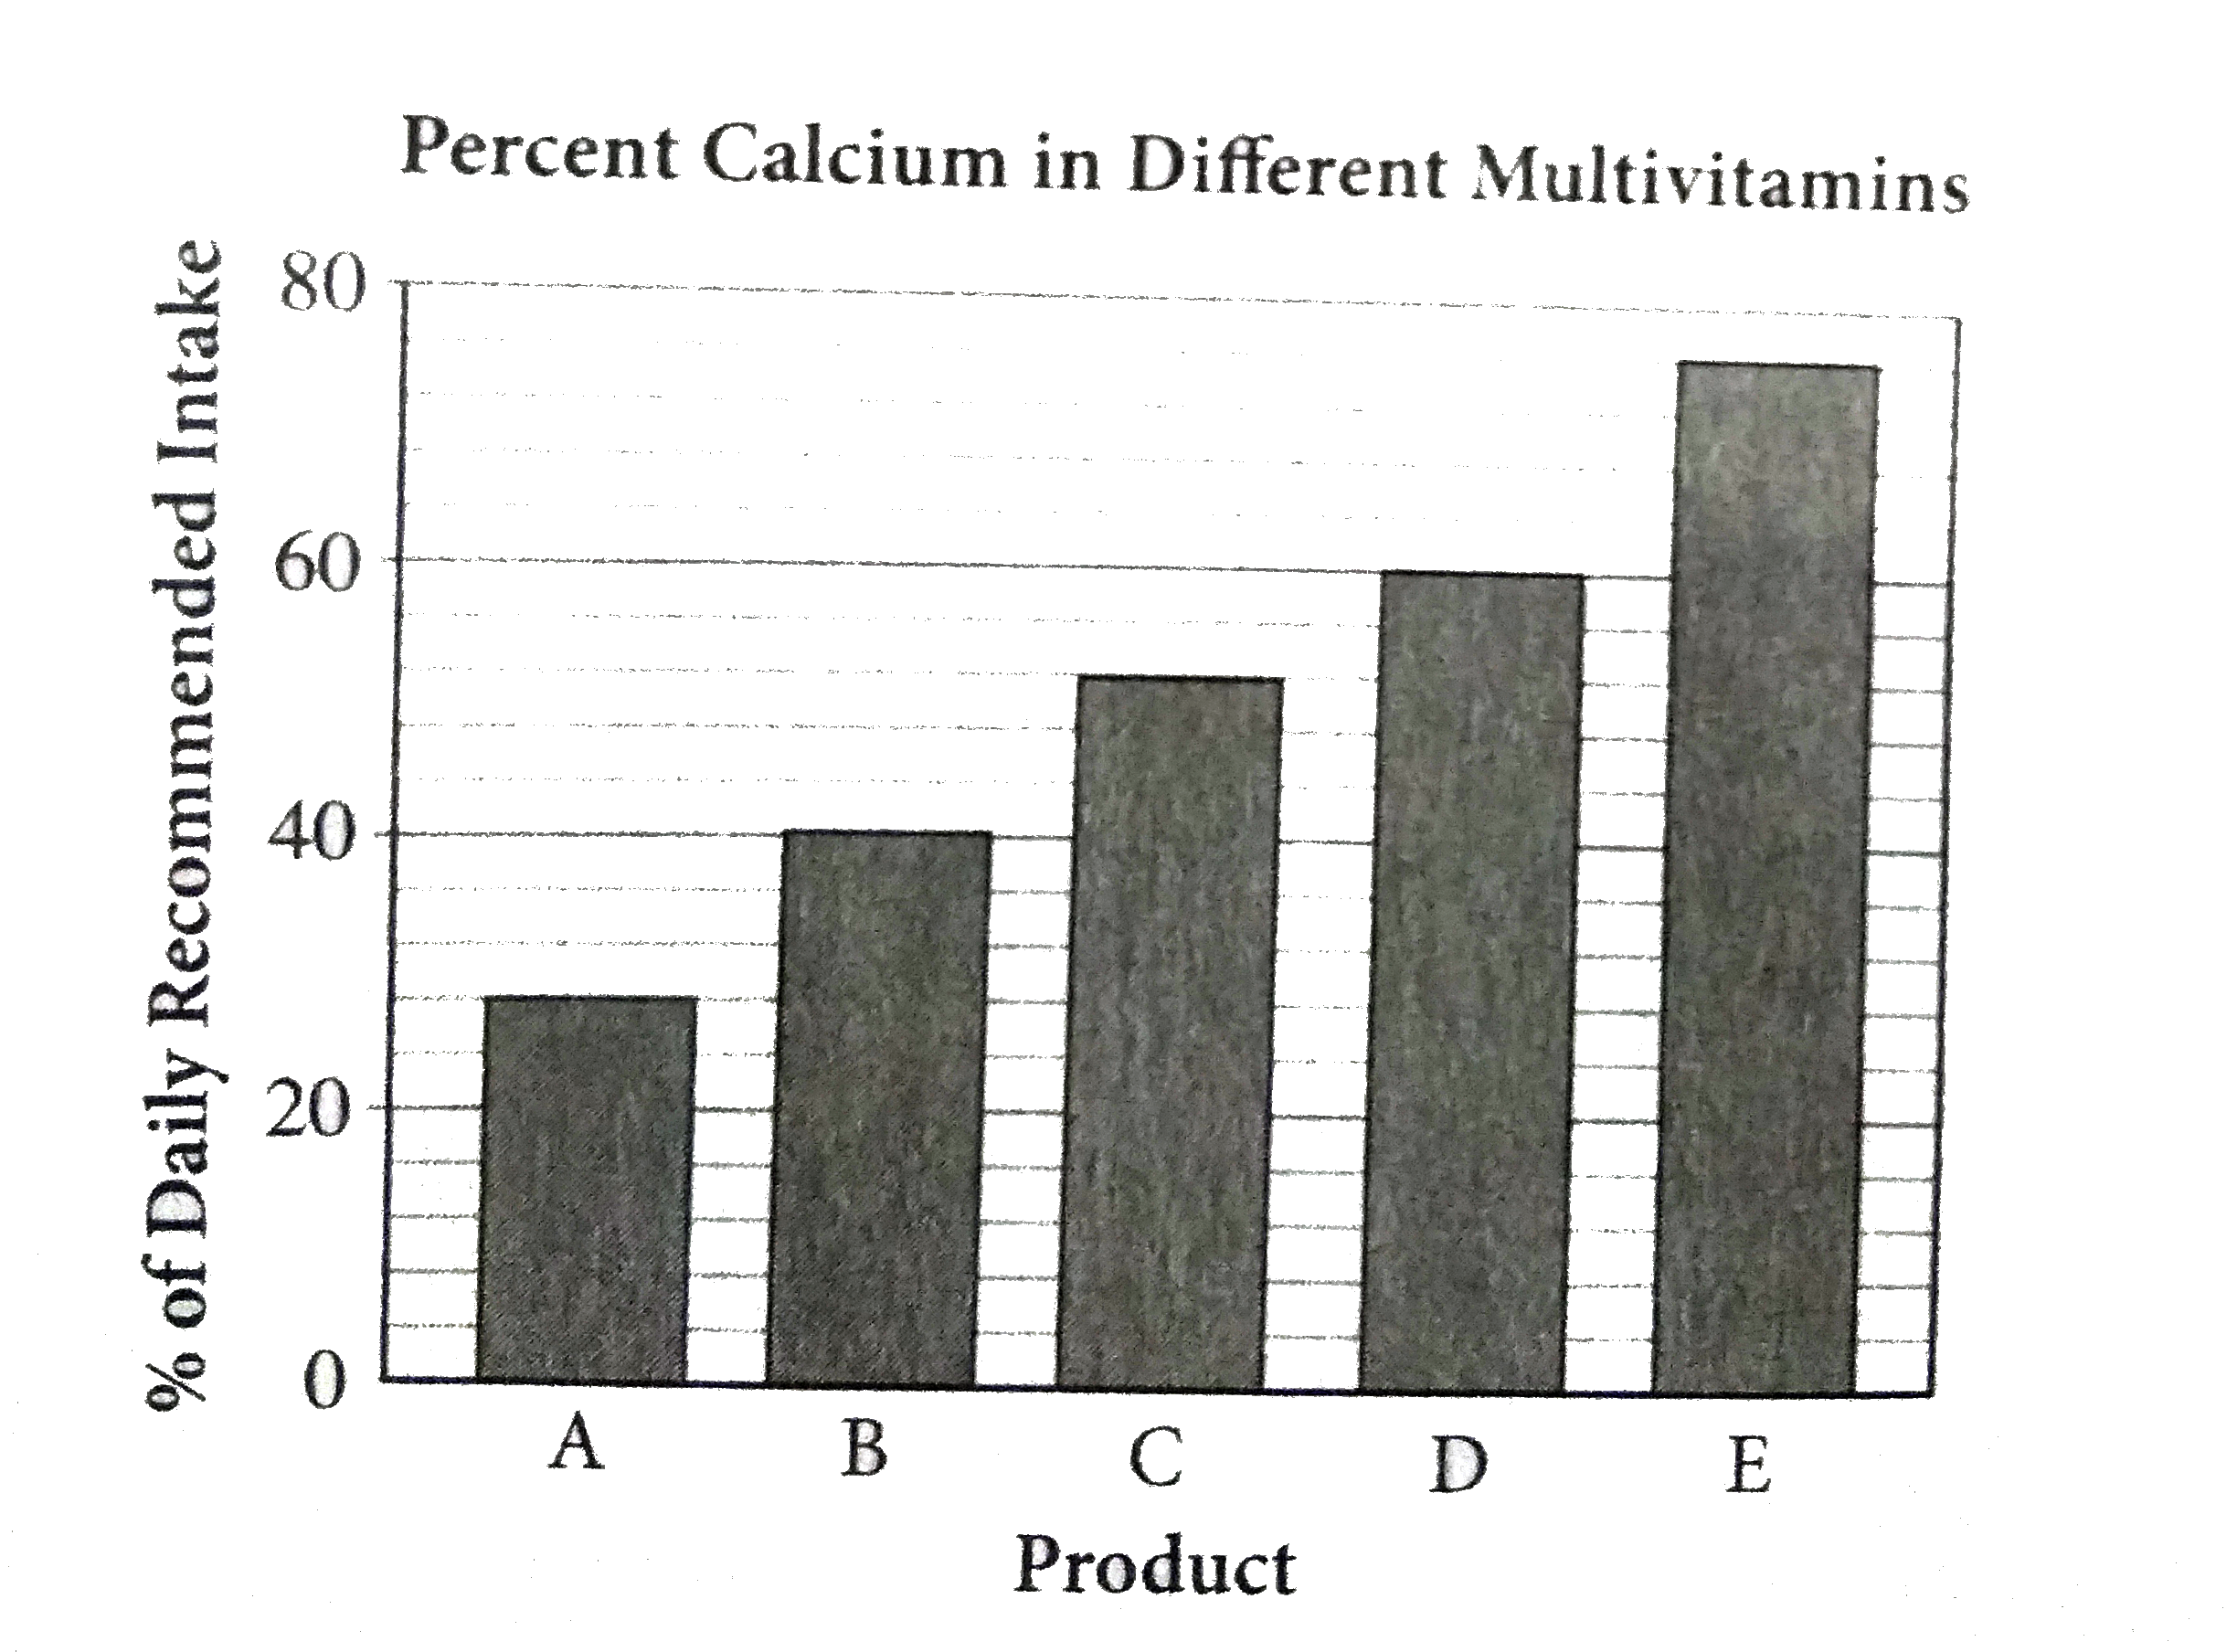
The bar graph above shows the percent of the daily recommended intake of calcium supplied by five different multivitamins, A, B, C, D and E, per pill. Products A and D are sold in bottles of 75 pills and cost $12 and $18, respectively. Products B, C and E are sold in bottles of 50 pills and cost $9.50, $10.25 and 15.50, respectively. Which of the five products supplies the greatest percentage intake of calcium per dollar?
View SolutionA teacher wanted to analysis the performance of two sections of students in a mathematics test of 100 marks. Looking performance, she found that a few students got under 20 marks and a few got 70 marks or above. So she decided to group them into intervals of varying sizes as follows :
0-20, 20-30, ....., 60-70, 70-100. Then she formed the following table :
∣∣ ∣ ∣ ∣ ∣ ∣ ∣ ∣ ∣ ∣ ∣ ∣∣Marks Number of students0−20 720−30 1030−40 1040−50 2050−60 2060−70 1570−above 8Total 90∣∣ ∣ ∣ ∣ ∣ ∣ ∣ ∣ ∣ ∣ ∣ ∣∣
(i) Find the probability that a student obtained less than 20% in the mathematics test.
(ii) Find the probability that a student obtained marks 60 or above .
View SolutionA teacher wanted to analysis the performance of two sections of students in a mathematics test of 100 marks. Looking performance, she found that a few students got under 20 marks and a few got 70 marks or above. So she decided to group them into intervals of varying sizes as follows :(i) Find the probability that a student obtained less than 20% in the mathematics test.
(ii) Find the probability that a student obtained marks 60 or above .
0-20, 20-30, ....., 60-70, 70-100. Then she formed the following table :
∣∣ ∣ ∣ ∣ ∣ ∣ ∣ ∣ ∣ ∣ ∣ ∣∣Marks Number of students0−20 720−30 1030−40 1040−50 2050−60 2060−70 1570−above 8Total 90∣∣ ∣ ∣ ∣ ∣ ∣ ∣ ∣ ∣ ∣ ∣ ∣∣
View SolutionTotal number of animals in five villages are as follows: Village, Number of animals A B C D E, 80 120 90 40 60 Prepare a pictograph of these animals using one symbol to represent 10 animals.
View SolutionIn which of the following tables, a and b vary directly. Also, find the constant of variation if a and b are in direct variation. (i) a: 4, 7, 21, 28 and b:12, 21, 63, 84 (ii) a: 2.5, 5, 7.5, 10, 15 and b:10, 20, 30, 40, 60 (iii) a:1, 2, 3, 4, 5 and b:2, 1, 6, 3, 2/5
View Solution