The following data shows the number of students opting different subject in a college: Subjects, English, Maths, Physics, Chemistry, Eco., Commerce No. of Students, 45, 60, 20, 30, 10, 15 Construct a pie-diagram to represent the above data.
To construct a pie chart representing the number of students opting for different subjects in a college, we will follow these steps:
Step 1: Calculate the Total Number of Students
First, we need to find the total number of students opting for all subjects.
- Subjects and Number of Students:
- English: 45
- Maths: 60
- Physics: 20
- Chemistry: 30
- Economics: 10
- Commerce: 15
- Total Calculation:
Total=45+60+20+30+10+15=180
Step 2: Calculate the Angle for Each Subject
In a pie chart, the total angle of the circle is 360 degrees. We will calculate the angle for each subject based on the proportion of students opting for that subject.
- Angle Calculation Formula:
Angle for a subject=(Number of Students in SubjectTotal Number of Students)×360
- Calculating Angles:
- English:
Angle=(45180)×360=90 degrees
- Maths:
Angle=(60180)×360=120 degrees
- Physics:
Angle=(20180)×360=40 degrees
- Chemistry:
Angle=(30180)×360=60 degrees
- Economics:
Angle=(10180)×360=20 degrees
- Commerce:
Angle=(15180)×360=30 degrees
Step 3: Represent the Angles in a Pie Chart
Now that we have calculated the angles for each subject, we can represent them in a pie chart.
- Pie Chart Representation:
- Draw a circle.
- Use a protractor to measure and draw the angles:
- English: 90 degrees
- Maths: 120 degrees
- Physics: 40 degrees
- Chemistry: 60 degrees
- Economics: 20 degrees
- Commerce: 30 degrees
Step 4: Label the Pie Chart
Finally, label each section of the pie chart with the subject name and the corresponding number of students.
Summary of Angles:
- English: 90 degrees
- Maths: 120 degrees
- Physics: 40 degrees
- Chemistry: 60 degrees
- Economics: 20 degrees
- Commerce: 30 degrees
First, we need to find the total number of students opting for all subjects.
- English: 45
- Maths: 60
- Physics: 20
- Chemistry: 30
- Economics: 10
- Commerce: 15
Total=45+60+20+30+10+15=180
In a pie chart, the total angle of the circle is 360 degrees. We will calculate the angle for each subject based on the proportion of students opting for that subject.
Angle for a subject=(Number of Students in SubjectTotal Number of Students)×360
- English:
Angle=(45180)×360=90 degrees
- Maths:
Angle=(60180)×360=120 degrees
Angle=(20180)×360=40 degrees
Angle=(30180)×360=60 degrees
Angle=(10180)×360=20 degrees
Angle=(15180)×360=30 degrees
Now that we have calculated the angles for each subject, we can represent them in a pie chart.
- Draw a circle.
- Use a protractor to measure and draw the angles:
- English: 90 degrees
- Maths: 120 degrees
- Physics: 40 degrees
- Chemistry: 60 degrees
- Economics: 20 degrees
- Commerce: 30 degrees
Finally, label each section of the pie chart with the subject name and the corresponding number of students.
- English: 90 degrees
- Maths: 120 degrees
- Physics: 40 degrees
- Chemistry: 60 degrees
- Economics: 20 degrees
- Commerce: 30 degrees
Topper's Solved these Questions
Similar Questions
The number of students admitted in different faculties of a college are given below: Faculty, Science, Art, Commerce, Law, Edu., Total No. of Student, 1000,1200,650,450,300,3600 Draw a pie-chart to represent the above information.
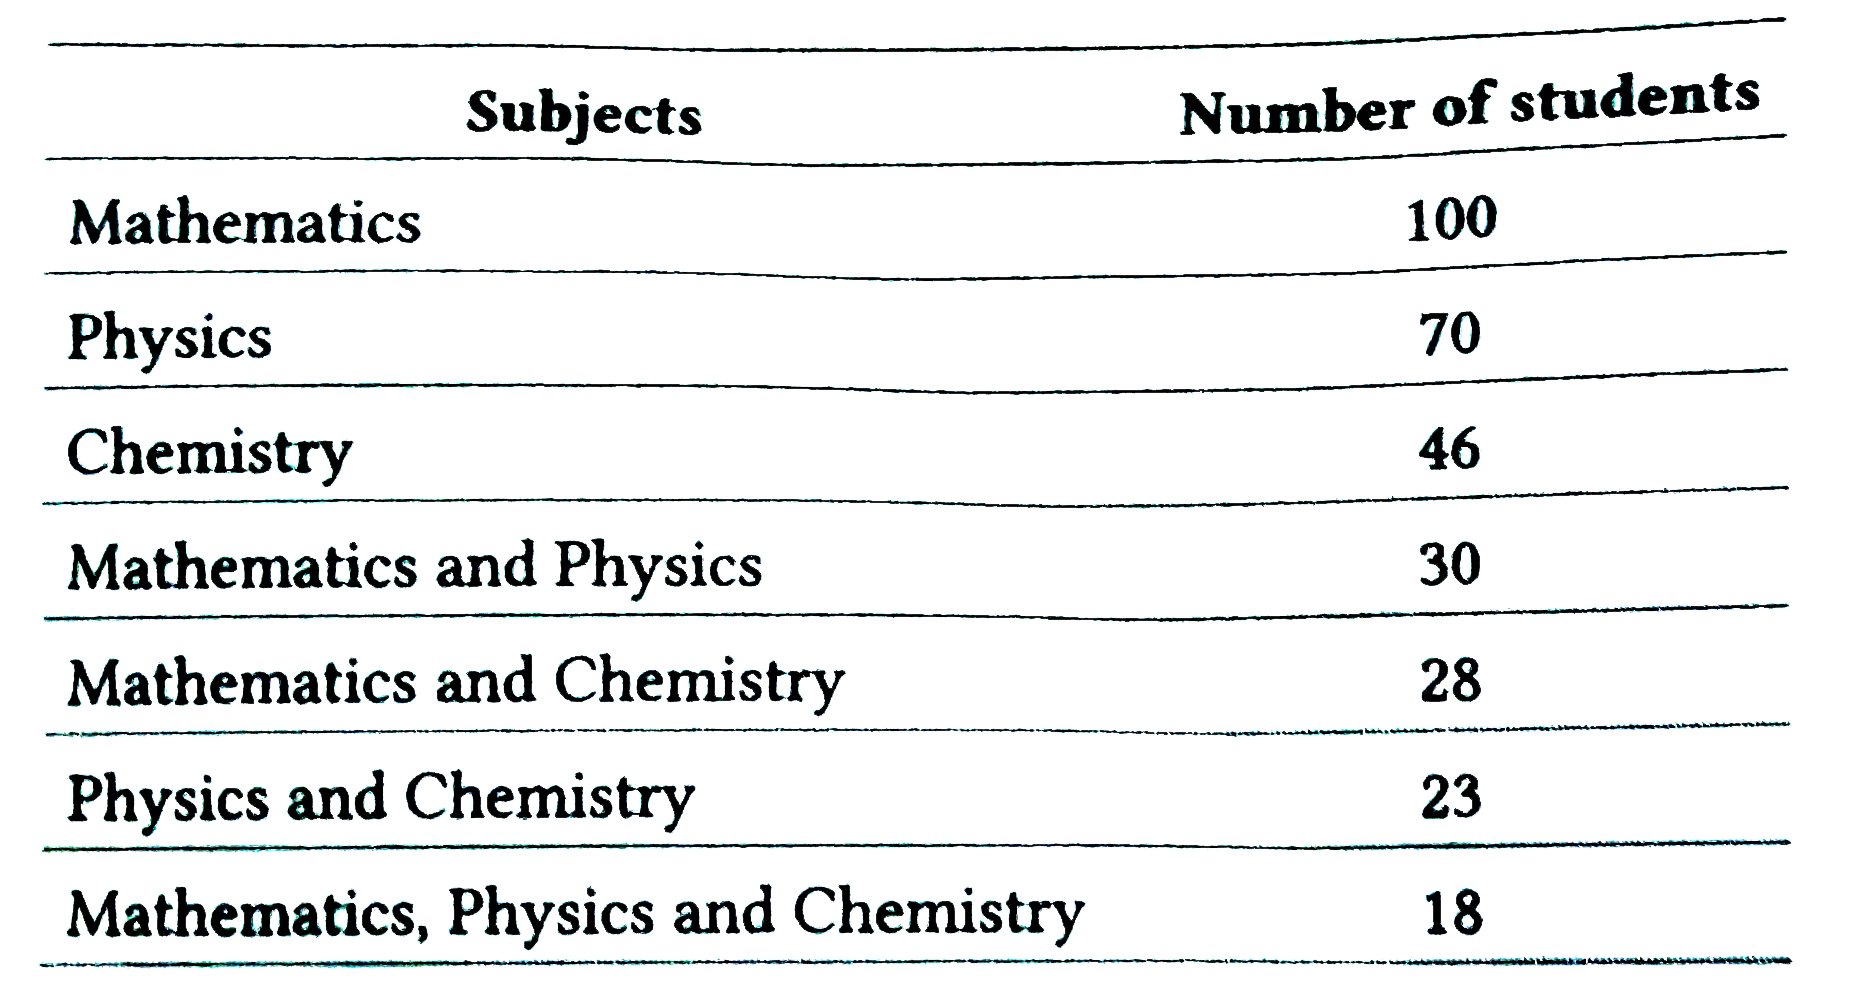
View SolutionA class has 175 students. The following table shows the number of students studying one or more of the following subjects in this case.

How many students are enrolled in Mathematics alone, Physics alone and Chemistry alone? Are there students who have not offered any one of these subjects?
View SolutionIn a class of 175 students the following data shows the number of students opting one or more subjects Mathematics 100, physics 70, chemistry 28, physics and Chemistry 23, mathematics and chemistry 28 , mathematics and physics 30 , mathematics physics and chemistry 18. how many students have offered mathematics alone ?
View SolutionFollowing is the break up of the expenditure of a family on different items of consumption.: Items, Food, Clothing, Rent, Education, Fuel etc., Medicine, Misc. Expenditure (in Rs), 1600, 200, 600, 150, 100, 80, 270 Draw a pie-diagram to represent the above data.
View SolutionA class has 175 students. The following data shows the number of students obtaining one or more subjects. Mathematics 100, Physics 70, Chemistry 40, Mathematics and Physics 30, Mathematics and Chemistry 28, Physics and Chemistry 23, Mathematics, Physics and Chemistry 18. How many students have offered Mathematics alone (a) 35 (c) 60 (b) 48 (d) 22
View SolutionThe following pie-chart shows the number of students admitted in different feculties of a college. If 1000 students are admitted in Science answer the following:
(i) What is the total number of students?
(ii) What is the ratio of students in science and arts?
View SolutionThe percentage of marks obtained by a student in different subjects are given below.
SubjectHindiScienceEnglishMathematicsSocial StudiesPercentage of3560157540marks obtained
Draw a bar graph representing the above data.
View SolutionThe following table shows the number of Maruti cars sold by the five dealers in a particular month: Dealer, Saya, Bagga Links, D.D. Motors, Bhasin Motor, Competent Motors Cars sold, 60, 40, 20, 15, 10 Represent the above information by a pictograph.
View SolutionIn a class of 55 students, the number of students studying different subjects are 23 in Mathematics, 24 in Physics, 19 in Chemistry, 12 in Mathematics and Physics, 9 in Mathematics and Chemistry, 7 in Physics and Chemistry and 4 in all the three subjects. Find the number of students who have taken exactly one subject.
View SolutionThe following data gives the amount spent on the construction of a house. Draw a pie diagram. Items, Cement, Timber, Bricks, Labour, Steel, Misc. Expenditure (in thousand Rs), 60, 30, 45, 75, 45, 45
View Solution
