Study the bar graph representing the number of persons in various age groups in a town shown in Figure. Observe the bar graph and answer the following questions: What is the percentage of the youngest age-group persons over those in the oldest age group? What is the total population of the town? What is the number of persons in the age-group 60-65? How many persons are more in the age-group 10-15 then in the age group 30-35? What is the age-group of exactly 1200 persons living in the town? What is the total number of persons living in the town in the age-group 50-55? What is the total number of persons living in the town in the age-groups 10-15 and 60-65? Whether the population in general increases, decreases or remains constant with the increase in the age-group.
Step-by-Step Solution
1. Percentage of the Youngest Age Group over the Oldest Age Group:
- Youngest Age Group (10-15 years): 1400 persons
- Oldest Age Group (70-75 years): 300 persons
- Percentage = (Number of Youngest / Number of Oldest) × 100
- Calculation:
Percentage=(1400300)×100=1400×100300=140000300=466.67%
2. Total Population of the Town:
- Age groups and their populations:
- 10-15 years: 1400
- 20-25 years: 1200
- 30-35 years: 1100
- 40-45 years: 1000
- 50-55 years: 900
- 60-65 years: 800
- 70-75 years: 300
- Total Population = 1400 + 1200 + 1100 + 1000 + 900 + 800 + 300
- Calculation:
Total Population=1400+1200+1100+1000+900+800+300=6700
3. Number of Persons in the Age Group 60-65:
- From the bar graph, the number of persons in the age group 60-65 years is 800.
4. Difference in Number of Persons between Age Groups 10-15 and 30-35:
- Age group 10-15: 1400 persons
- Age group 30-35: 1100 persons
- Difference = Number in 10-15 - Number in 30-35
- Calculation:
Difference=1400−1100=300
5. Age Group with Exactly 1200 Persons:
- From the bar graph, the age group with exactly 1200 persons is 20-25 years.
6. Total Number of Persons in the Age Group 50-55:
- From the bar graph, the number of persons in the age group 50-55 years is 900.
7. Total Number of Persons in Age Groups 10-15 and 60-65:
- Age group 10-15: 1400 persons
- Age group 60-65: 800 persons
- Total = Number in 10-15 + Number in 60-65
- Calculation:
Total=1400+800=2200
8. Population Trend with Age Group Increase:
- Observing the bar graph, as the age group increases, the number of persons generally decreases. This indicates that the population in general decreases with the increase in age group.
- Youngest Age Group (10-15 years): 1400 persons
- Oldest Age Group (70-75 years): 300 persons
- Percentage = (Number of Youngest / Number of Oldest) × 100
- Calculation:
Percentage=(1400300)×100=1400×100300=140000300=466.67%
- Age groups and their populations:
- 10-15 years: 1400
- 20-25 years: 1200
- 30-35 years: 1100
- 40-45 years: 1000
- 50-55 years: 900
- 60-65 years: 800
- 70-75 years: 300
- Total Population = 1400 + 1200 + 1100 + 1000 + 900 + 800 + 300
- Calculation:
Total Population=1400+1200+1100+1000+900+800+300=6700
- From the bar graph, the number of persons in the age group 60-65 years is 800.
- Age group 10-15: 1400 persons
- Age group 30-35: 1100 persons
- Difference = Number in 10-15 - Number in 30-35
- Calculation:
Difference=1400−1100=300
- From the bar graph, the age group with exactly 1200 persons is 20-25 years.
- From the bar graph, the number of persons in the age group 50-55 years is 900.
- Age group 10-15: 1400 persons
- Age group 60-65: 800 persons
- Total = Number in 10-15 + Number in 60-65
- Calculation:
Total=1400+800=2200
- Observing the bar graph, as the age group increases, the number of persons generally decreases. This indicates that the population in general decreases with the increase in age group.
Topper's Solved these Questions
Similar Questions
Show that (x−2) is a factor of the polynomial f(x)=2x3−3x2−17x+30 and hence factorize f(x).
View SolutionA floral design on the floor of a building consists of 280 tiles. Each tile is in the shape of a parallelogram of altitude 3 cm and base 5 cm. Find the cost of polishing the design at the rate of 50 paise per cm2 .
View SolutionNumber of persons in various age groups in a town is given in the following tableDraw a bar graph to represent the above information and answer the following questions. (take 1 unit length = 20 thousands)(a) Which two age groups have same population?(b) All persons in the age group of 60 and above are called senior citizens. How many senior citizens are there in the town?
View SolutionNumber of persons in various age groups in a town is given in the following tableDraw a bar graph to represent the above information and answer the following questions. (take 1 unit length = 20 thousands)(a) Which two age groups have same population?(b) All persons in the age group of 60 and above are called senior citizens. How many senior citizens are there in the town?
View SolutionStudy the bar graph representing the number of persons in various age groups in a town shown in Figure. Observe the bar graph and answer the following questions:
(i)What is the percentage of the youngest age-group persons over those in the oldest age group?
(ii)What is the total population of the town?
(iii)What is the number of persons in the age group 60-65?
(iv)What is the age-group of exactly 1200 persons living in the town?
(v)What is the total number of persons living in the town in the age group 50-55?
(vi)What is the total number of persons living in the town in the age group 10-15 and 60-65?
View SolutionNumber of persons in various age groups in a town is given in the following table. Draw a bar Draw a bar graph to represent the above information and answer the following questins. (take 1 unit lenght = 20 thousands) (a) Which two age groups have same population?
View SolutionThe bar graph given in the adjoining figure represents the various age groups of people in a town.Study the bar graph and answer the following questions:
Write the no. of people in the youngest age group?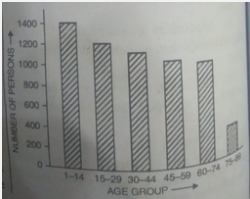 .
.
View SolutionThe bar graph given in the adjoining figure represents the various age groups of people in a town.Study the bar graph and answer the following questions:
Write the no. of people in the youngest age group? .
.
View SolutionThe bar graph given in the adjoining figure represents the various age groups of people in a town.Study the bar graph and answer the following questions:
Total number of people in the age 1-89.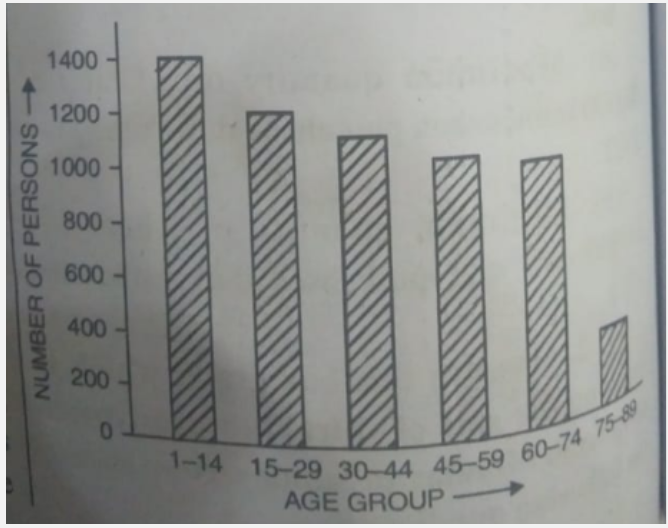 .
.
View SolutionNumber of persons in various age groups in a town is given in the following table: Which two age groups have same population ?
View SolutionAverage age seven persons in a group is 30 years .The average age of five person of this group is 31 years .What is the average age of the other two person in the group ?
View SolutionStudy the following histogram and answer the questions.
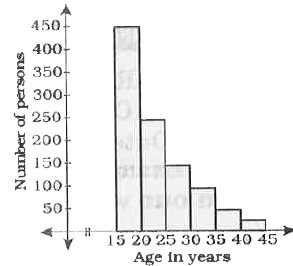
The total number of persons in the age group of 15 years to 45 years is :
View SolutionStudy the following histogram and answer the questions.
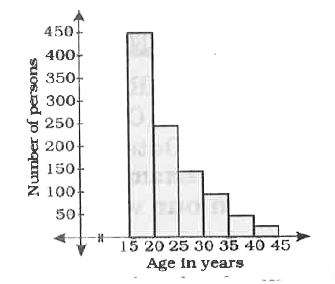
The ratio of maximum population in an age group to the total number of persons under study is :
View Solutionनिम्न आयत-चित्र का अध्ययन करके, नीचे दिए गए प्रश्न के उत्तर दीजिए।
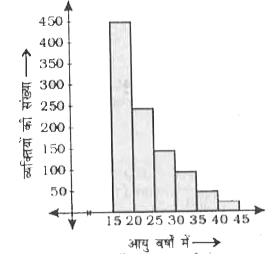
15 से 45 वर्षों की आयु-वर्ग के व्यक्तियों की कुल संख्या कितनी है?
View Solutionनिम्न आयत-चित्र का अध्ययन करके, नीचे दिए गए प्रश्न के उत्तर दीजिए।
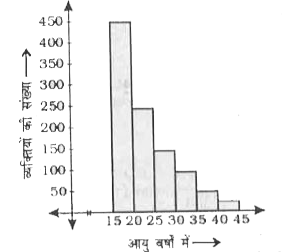
वर्षों के 15-20आयु वर्ग के व्यक्तियों की कुल संख्या कितनी है?
View Solution
