The expenditure (in 10 crores of rupees) on health by the Govt. of India during the various five year plans in shown below: Planes: I II II IV V VI Expenditure on health (in 10 crores of rupees) 7 14 23 34 76 182 Construct a bar graph to represent the above data.
Step by step video & image solution for The expenditure (in 10 crores of rupees) on health by the Govt. of India during the various five year plans in shown below: Planes: I II II IV V VI Expenditure on health (in 10 crores of rupees) 7 14 23 34 76 182 Construct a bar graph to represent the above data. by Maths experts to help you in doubts & scoring excellent marks in Class 9 exams.
Updated on:21/07/2023Topper's Solved these Questions
Similar Questions
Expenditure on education of a country during a five years period (2002-2006), in crore of rupees, is given below

Represent the information above by a bar graph.
View SolutionThe investment (in ten crores of rupees) of the Life Insurance Corporation of India in different sectors are given below: Sectors Investment (In ten crores of rupees) Central Government Securities State Government Securities Securities guaranteed by the Government Private Sectors Socially oriented sectors (Plan) Socially oriented sectors (Non-Plan) 45 11 23 18 46 11 Represent the above data with the help of a bar graph.
View SolutionThe following data gives the amount of loans (in crores of rupees) disbursed by a bank during some years: Year, 1992, 1993, 1994, 1995, 1996 Loan (in crores of rupees), 28, 33, 55, 55, 80 Represent the above data with the help of a bar graph. With the help of the bar graph, indicate the year in which amount of loan is not increased over that of the preceding year.
View SolutionThe following data gives the amount of loans (in crores of rupees) disbursed by a bank during some years: Year, 1992, 1993, 1994, 1995, 1996 Loan (in crores of rupees), 28, 33, 55, 55, 80 Represent the above data with the help of a bar graph. With the help of the bar graph, indicate the year in which amount of loan is not increased over that of the preceding year.
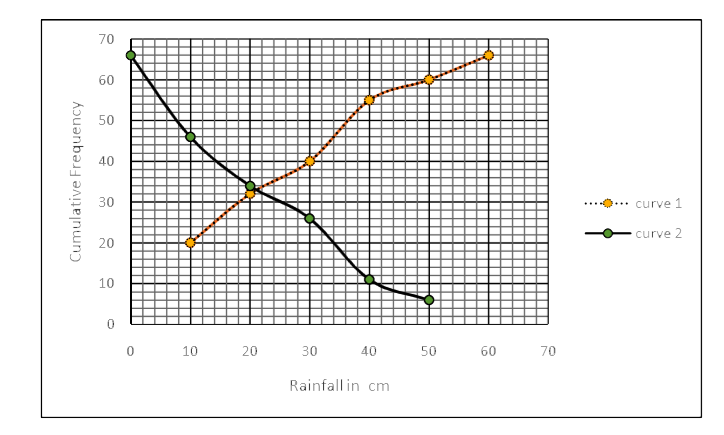
View SolutionA TV reporter was given a task to prepare a report on the rainfall of the city Dispur of India in a particular year. After collecting the data, he analyzed the data and prepared a report on the rainfall of the city. Using this report, he drew the following graph for a particular time period of 66 days

Based on the above graph, answer the following questions
(i) Identify less than type ogive and more than type ogive from the given graph.
(ii) Find the median rainfall of Dispur
(iii) Obtain the Mode of the data if mean rainfall is 23.4cm
View SolutionDirection :
Resistive force proportional to object velocity
At low speeds, the resistive force acting on an object that is moving a viscous medium is effectively modeleld as being proportional to the object velocity. The mathematical representation of the resistive force can be expressed as
R=−bv
Where v is the velocity of the object and b is a positive constant that depends onthe properties of the medium and on the shape and dimensions of the object. The negative sign represents the fact that the resistance froce is opposite to the velocity.
Consider a sphere of mass m released frm rest in a liquid. Assuming that the only forces acting on the spheres are the resistive froce R and the weight mg, we can describe its motion using Newton's second law. though the buoyant force is also acting on the submerged object the force is constant and effect of this force be modeled by changing the apparent weight of the sphere by a constant froce, so we can ignore it here.
Thus mg−bv=mdvdt⇒dvdt=g−bmv
Solving the equation
v=mgb(1−e−bt/m)
where e=2.71 is the base of the natural logarithm
The acceleration becomes zero when the increasing resistive force eventually the weight. At this point, the object reaches its terminals speed v1 and then on it continues to move with zero acceleration
mg−bT=0
⇒mT=mgb
Hence v=vT(1−evtm)
In an experimental set-up four objects I,II,III,IV were released in same liquid. Using the data collected for the subsequent motions value of constant b were calculated. Respective data are shown in table.
ObjectIIIIIIVMass (in kg.)1234Constant bin (N-s)/m3.71.41.42.8
A small sphere of mass 2.00 g is released from rest in a large vessel filled with oil. The sphere approaches a terminal speed of 10.00 cm/s. Time required to achieve speed 6.32 cm/s from start of the motion is (Take g=10.00m/s2) :
View SolutionStudy the bar graph representing the number of persons in various age groups in a town shown in Figure. Observe the bar graph and answer the following questions:
(i)What is the percentage of the youngest age-group persons over those in the oldest age group?
(ii)What is the total population of the town?
(iii)What is the number of persons in the age group 60-65?
(iv)What is the age-group of exactly 1200 persons living in the town?
(v)What is the total number of persons living in the town in the age group 50-55?
(vi)What is the total number of persons living in the town in the age group 10-15 and 60-65?
View SolutionThe half− life periods of four isotopes are give below :
(i)7.6years , ii.4000years
iii.6000years,iv.3.2×105years
Which of the above isotope is most stable ?
View SolutionThe runs scored by a cricket team in first 15 overs are given below: Overs, I, II, III, IV, V, VI, VII, VIII, IX, X, XI, XII, XIII, XIV, XV Runs:, 2, 1, 4, 2, 6, 8, 10, 21, 5, 8, 3, 2, 6, 8, 12 Draw the graph representing the above data in two different ways as a graph and as a bar chart.
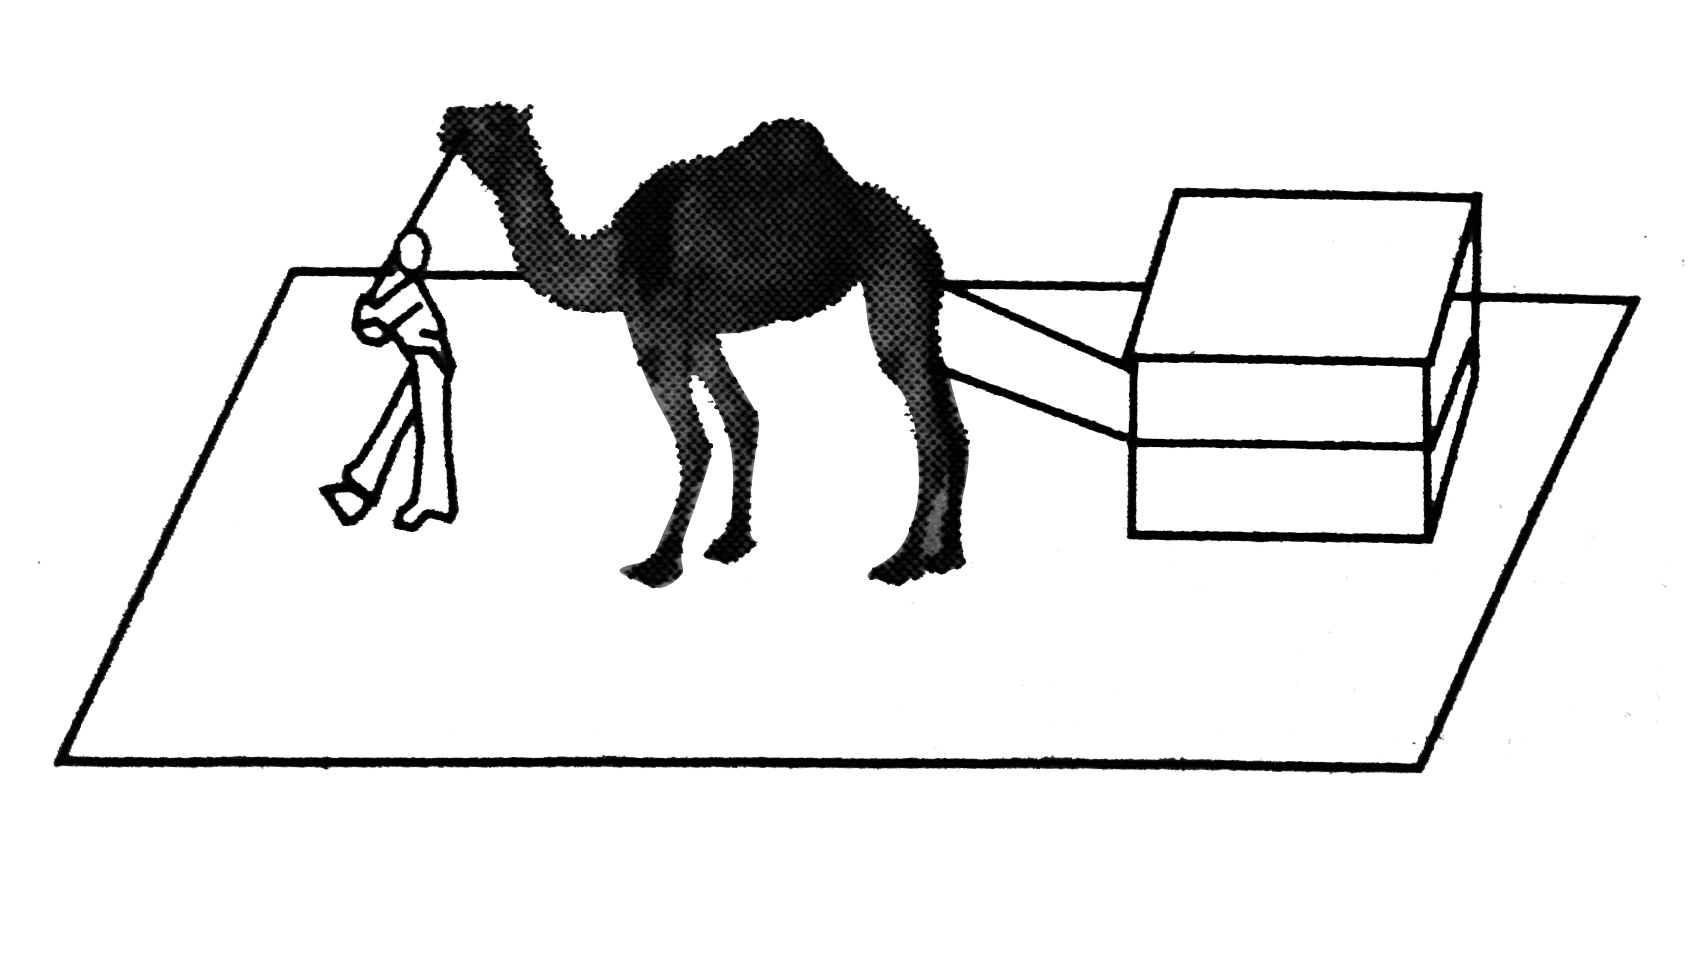
View SolutionRam and Ali have been fast friends since childhood. Ali neglected studies and now has no means to earn money other than a channel whereas Ram has become an engineer. Now both are working in the same factory. Ali uses camel to transport the load within the factory.
 Due to low salary and degradation in health of camel, Ali becomes worried and meets his friend Ram and discusses his problems. Ram collected some data and with some assumptions concluded the following:
i. The load used in each trip is 1000kg and has friction coefficient μk=0.1 and μs=0.2.
ii. Mass of camel is 500kg.
iii. Load is accelerated for first 50m with constant acceleration, then it is pulled at a constant speed of 5ms−1 for 2km and at last stopped with constant retardation in 50m.
iv. From biological data, the rate of consumption of energy of camel can be expressed as P=18×103v+104Js−1 where P is the power and v is the velocity of the camel. After calculations on different issues, Ram suggested proper food, speed of camel, etc. to his friend. For the welfare of Ali, Ram wrote a letter to the management to increase his salary.
(Assuming that the camel exerts a horizontal force on the load):
The ratio of the energy consumed by the camel during uniform motion for the two cases when it moves with speed 5ms−1 to the case when it moves with 10ms−1
View Solution
