The rainfall (in mm) in a city on 7 days of a certain week was recorded as follows: (i) Find the range of the rainfall in the above data. (ii) Find the mean rainfall for the week. (iii) On how many days was the rainfall less than the mean rainfal
Step by step video & image solution for The rainfall (in mm) in a city on 7 days of a certain week was recorded as follows: (i) Find the range of the rainfall in the above data. (ii) Find the mean rainfall for the week. (iii) On how many days was the rainfall less than the mean rainfal by Maths experts to help you in doubts & scoring excellent marks in Class 7 exams.
Updated on:21/07/2023Topper's Solved these Questions
Similar Questions
Knowledge Check
Study the table given below and answer the following questions :

Find out the total rainfall in the summer seasonA19.9 cmB9.5 cmC9.9 cmD10.8 cm
Daily absence from a school during three weeks is recorded as follows :

Draw a graph , illustrating the above data . Calculate the 5 - days moving average and plot them on the same graph .
View SolutionA class teacher has the following absentee record of 40 students of a class for the whole term. Find the mean number of days a student was absent.
View SolutionIf the rainfall on a certain day was 5cm, how many litres of water fell on 1 hectare field on that day?
View SolutionIf it has rained 276 mm in the last 3 days, how many cm of rain will fall in one full week (7 days)? Assume that the rain continues to fall at the same rate.
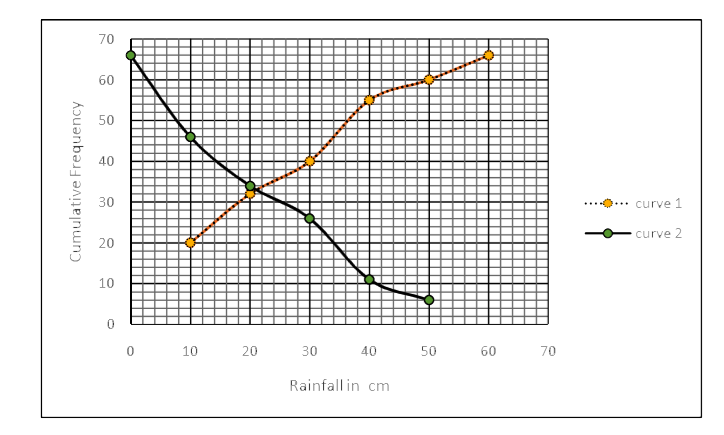
View SolutionA TV reporter was given a task to prepare a report on the rainfall of the city Dispur of India in a particular year. After collecting the data, he analyzed the data and prepared a report on the rainfall of the city. Using this report, he drew the following graph for a particular time period of 66 days

Based on the above graph, answer the following questions
(i) Identify less than type ogive and more than type ogive from the given graph.
(ii) Find the median rainfall of Dispur
(iii) Obtain the Mode of the data if mean rainfall is 23.4cm
View SolutionA study was conducted to find out the concentration of sulphur dioxide in the air in parts per million (ppm) of a certain city. The data obtained for 30 days is a follows :

(i) Make a grouped frequency distribution table for this data with class-intervals as 0.00−0.04,0.04−0.08 and so on.
(ii) For how many day's was the concentration of sulphar dioxide more than 0.11 parts per million (ppm)?
View SolutionThe heights of 10 girls were measured in cm and the results are as follows:135, 150, 139, 128, 151, 132, 146, 149, 143, 141.(i) What is the height of the tallest girl? (ii) What is the height of the shortest girl?(iii) What is the range of the data? (iv) What is the mean height of the girls?(v) How many girls have heights more than the mean height
View Solution

