The following histogram shows the number of literate females in the age group of 10 to 40 years in a town: 1. Write the age group in which the number of literate female is the highest. 2. What is the class width? 3. What is the lowest frequency? 4. What are the class marks of the classes? 5. In which age group literate females are the least?
Step-by-Step Solution
1. Identify the Age Group with the Highest Number of Literate Females:
- Look at the histogram and identify the rectangle with the highest height.
- The highest rectangle corresponds to the age group of 20 to 30 years, where the number of literate females is 1000.
2. Determine the Class Width:
- The class width is the difference between the lower limit and the upper limit of any class interval.
- For example, in the interval 10 to 20, the class width is 20 - 10 = 10.
- This width is consistent across all intervals, so the class width is 10.
3. Find the Lowest Frequency:
- Identify the rectangle with the lowest height in the histogram.
- The lowest rectangle corresponds to a frequency of 320, which is the lowest frequency among the age groups.
4. Calculate the Class Marks of the Classes:
- The class mark is calculated by taking the average of the upper and lower limits of each class interval.
- For each interval:
- For 10 to 20: Class mark = (10 + 20) / 2 = 15
- For 20 to 30: Class mark = (20 + 30) / 2 = 25
- For 30 to 40: Class mark = (30 + 40) / 2 = 35
- For 40 to 50: Class mark = (40 + 50) / 2 = 45
- For 50 to 60: Class mark = (50 + 60) / 2 = 55
- For 60 to 70: Class mark = (60 + 70) / 2 = 65
5. Identify the Age Group with the Least Number of Literate Females:
- Again, look for the rectangle with the lowest height.
- The age group corresponding to the lowest rectangle is 10 to 20 years, where the number of literate females is the least.
Summary of Answers:
1. Age group with the highest number of literate females: 20 to 30 years
2. Class width: 10
3. Lowest frequency: 320
4. Class marks: 15, 25, 35, 45, 55, 65
5. Age group with the least literate females: 10 to 20 years
- Look at the histogram and identify the rectangle with the highest height.
- The highest rectangle corresponds to the age group of 20 to 30 years, where the number of literate females is 1000.
- The class width is the difference between the lower limit and the upper limit of any class interval.
- For example, in the interval 10 to 20, the class width is 20 - 10 = 10.
- This width is consistent across all intervals, so the class width is 10.
- Identify the rectangle with the lowest height in the histogram.
- The lowest rectangle corresponds to a frequency of 320, which is the lowest frequency among the age groups.
- The class mark is calculated by taking the average of the upper and lower limits of each class interval.
- For each interval:
- For 10 to 20: Class mark = (10 + 20) / 2 = 15
- For 20 to 30: Class mark = (20 + 30) / 2 = 25
- For 30 to 40: Class mark = (30 + 40) / 2 = 35
- For 40 to 50: Class mark = (40 + 50) / 2 = 45
- For 50 to 60: Class mark = (50 + 60) / 2 = 55
- For 60 to 70: Class mark = (60 + 70) / 2 = 65
- Again, look for the rectangle with the lowest height.
- The age group corresponding to the lowest rectangle is 10 to 20 years, where the number of literate females is the least.
1. Age group with the highest number of literate females: 20 to 30 years
2. Class width: 10
3. Lowest frequency: 320
4. Class marks: 15, 25, 35, 45, 55, 65
5. Age group with the least literate females: 10 to 20 years
Topper's Solved these Questions
- BOOK - RD SHARMA ENGLISHCHAPTER - DATA HANDLING-I (CLASSIFICATION AND TABULATION DATA)EXERCISE - All Questions27videos
DATA HANDLING-I (CLASSIFICATION AND TABULATION DATA)
- BOOK - RD SHARMA ENGLISHCHAPTER - DATA HANDLING-III (PIE CHARTS OR CIRCLE GRAPHS)EXERCISE - All Questions37videos
DATA HANDLING-III (PIE CHARTS OR CIRCLE GRAPHS)
Similar Questions
The following table presents the number of illiterate females in the age group (10-34) in a town: Age group: 10-14 15-19 20-24 25-29 30-34 No. of Females: 300 980 800 580 290 Draw a histogram to represent the above data:
View SolutionBelow is the histogram depicting marks obtained by 43 students of a class: 1. Write the number of students getting the highest marks. 2. What is the class size?
View Solution
Knowledge Check
- Question 1 - Select One
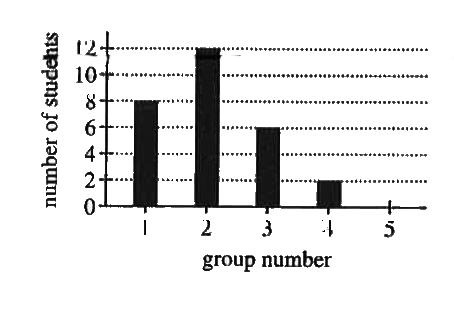
The graph below shows the number of students who were present on Thursday from each of the 5 groups in Ms. Meagan's class. What is the probability that a student selected at random from the class on Thrusday is in Group 4?
 A128B114C15D14
Study the bar graph representing the number of persons in various age groups in a town shown in Figure. Observe the bar graph and answer the following questions: What is the percentage of the youngest age-group persons over those in the oldest age group? What is the total population of the town? What is the number of persons in the age-group 60-65? How many persons are more in the age-group 10-15 then in the age group 30-35? What is the age-group of exactly 1200 persons living in the town? What is the total number of persons living in the town in the age-group 50-55? What is the total number of persons living in the town in the age-groups 10-15 and 60-65? Whether the population in general increases, decreases or remains constant with the increase in the age-group.
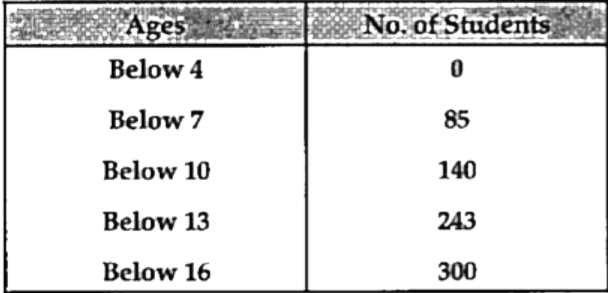
View SolutionConstruct the frequency distribution table from the following cumulative frequency table :

State the age - group which has the least number of students .View SolutionStudy the bar graph representing the number of persons in various age groups in a town shown in Figure. Observe the bar graph and answer the following questions:
(i)What is the percentage of the youngest age-group persons over those in the oldest age group?
(ii)What is the total population of the town?
(iii)What is the number of persons in the age group 60-65?
(iv)What is the age-group of exactly 1200 persons living in the town?
(v)What is the total number of persons living in the town in the age group 50-55?
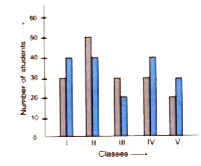
(vi)What is the total number of persons living in the town in the age group 10-15 and 60-65?View SolutionExmine the given graph carefully.

In the graph show above represents the number of girls in a particular class and represents the number of boys in the same class.
Read and answer the following questions.
(i) Which class has the least number of students ?
(ii) Which class has maximum number of students ?
(iii) What is the ratio between the number of girls and the number of boys of class V.View SolutionThe students in a class can be divided into groups of 2, 3, 5 and 6. What is the least number of children this class can have.
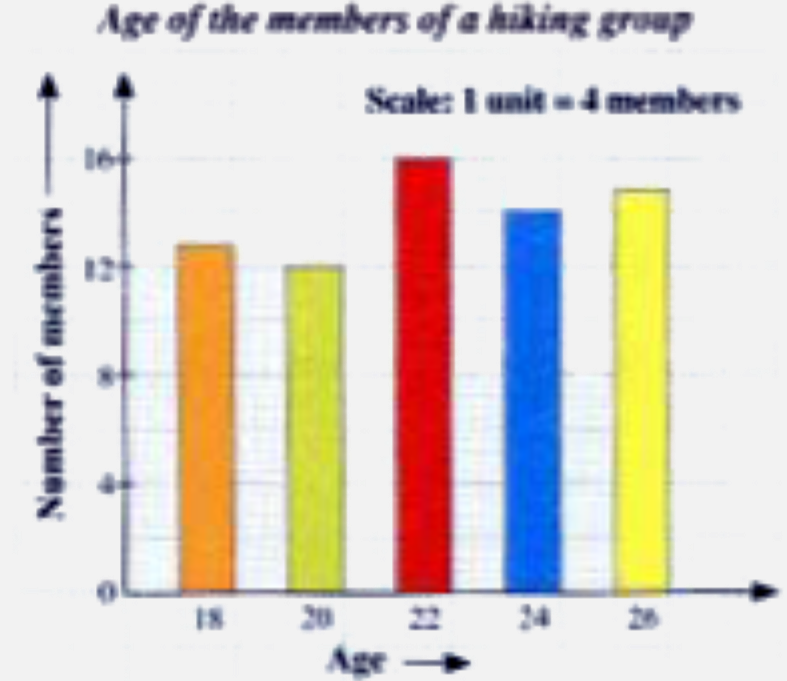
View SolutionThe given graph represents the age and number of members of a hiking group who are planning an excursion. Study the graph and answer the following question.
Which age group has the least members in the hiking group?
 View Solution
Set up an equation in the following cases:
(i) Irfan says that he has 7 marbles more than five times the marbles Parmit has. Irfan has 37 marbles. (Take m to be the number of Parmit’s marbles.)
(ii) Laxmi’s father is 49 years old. He is 4 years older than three times Laxmi’s age. (Take Laxmi’s age to be y years.)
(iii) The teacher tells the class that the highest marks obtained by a student in her class is twice the lowest marks plus 7. The highest score is 87. (Take the lowest score to be l.)
(iv) In an isosceles triangle, the vertex angle is twice either base angle. (Let the base angle be b in degrees. Remember that the sum of angles of a triangle is 180 degrees).View Solution

