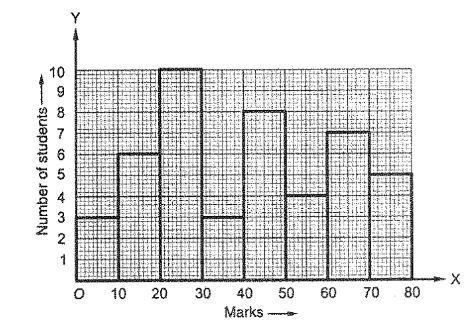
Below is the histogram depicting marks obtained by 43 students of a class: 1. Write the number of students getting the highest marks. 2. What is the class size?
Step by step video & image solution for Below is the histogram depicting marks obtained by 43 students of a class: 1. Write the number of students getting the highest marks. 2. What is the class size? by Maths experts to help you in doubts & scoring excellent marks in Class 8 exams.
Updated on:21/07/2023Topper's Solved these Questions
- DATA HANDLING-I (CLASSIFICATION AND TABULATION DATA)BOOK - RD SHARMA ENGLISHCHAPTER - DATA HANDLING-I (CLASSIFICATION AND TABULATION DATA)EXERCISE - All Questions
27 Videos
- DATA HANDLING-III (PIE CHARTS OR CIRCLE GRAPHS)BOOK - RD SHARMA ENGLISHCHAPTER - DATA HANDLING-III (PIE CHARTS OR CIRCLE GRAPHS)EXERCISE - All Questions
37 Videos
Similar Questions
The following histogram depicts the marks obtained by 45 students of a class: Figure: Look at the histogram and answer the following questions: What is the class size? How many students obtained less than 10 marks? How many students obtained 30 or more marks but less than 40? What is the interval of highest marks and how many students are there in this interval? If passing marks are 30, what is the number of failures?

View SolutionThe table shows the marks obtained by 25 students in a class test. Find the mean of the marks obtained

View Solution
Knowledge Check
In a class , 45 % of students are girls, If there are 22 boys in the class, then the total number of students in the class is
A30B36C40D44
Given below is the distribution of marks obtained by 50 students in a class test :
 If 70% students pass the test , find the minimum marks needed by a students to pass the examination.
View SolutionIn a class of 40 students, 45% are girls. Find the number of boys in the class .
View SolutionGiven below (figure) is the bar graph indicating the marks obtained out of 50 in mathematics paper by 100 students. Read the bar graph and answer the following questions: It is decided to distribute work books on mathematics to the students obtaining less then 20 marks, giving one workbook to each of such students. If a work book costs Rs.5, what sum is required to buy the work books? Every student belonging to the highest mark group is entitled to get a prize of Rs. 10. How much amount of money is required for distributing the prize money? Every student belonging to the lowest mark-group has to solve 5 problems per day. How many problems, in all, will be solved by the students of this group per day? State whether true or false. 17% students have obtained marks ranging from 40 to 49. 59 students have obtained marks ranging from 10 to 29. What is the number of students getting less than 20 marks? What is the number of students getting more than 29 marks? What is the number of students getting marks between 9 to 40? What is the number of students belonging to the highest mark group? What is the number of students obtaining more than 19 marks?
View SolutionDraw a histogram for the marks of students given below:

View SolutionDraw a histogram for the marks of students given below:

View SolutionThe mean and standard deviation of marks obtained by 50 students of a class in three subjects, Mathematics, Physics and Chemistry are given below:

Which of the three subjects shows the highest variability in marks and which shows the lowest?
View SolutionThe marks obtained by 32 students of a class are given below. Prepare a frequency table with class intervals 31−40,41−50,….. etc.

View Solution
