Draw a histogram for the marks of students given below:

Video Solution
Text Solution
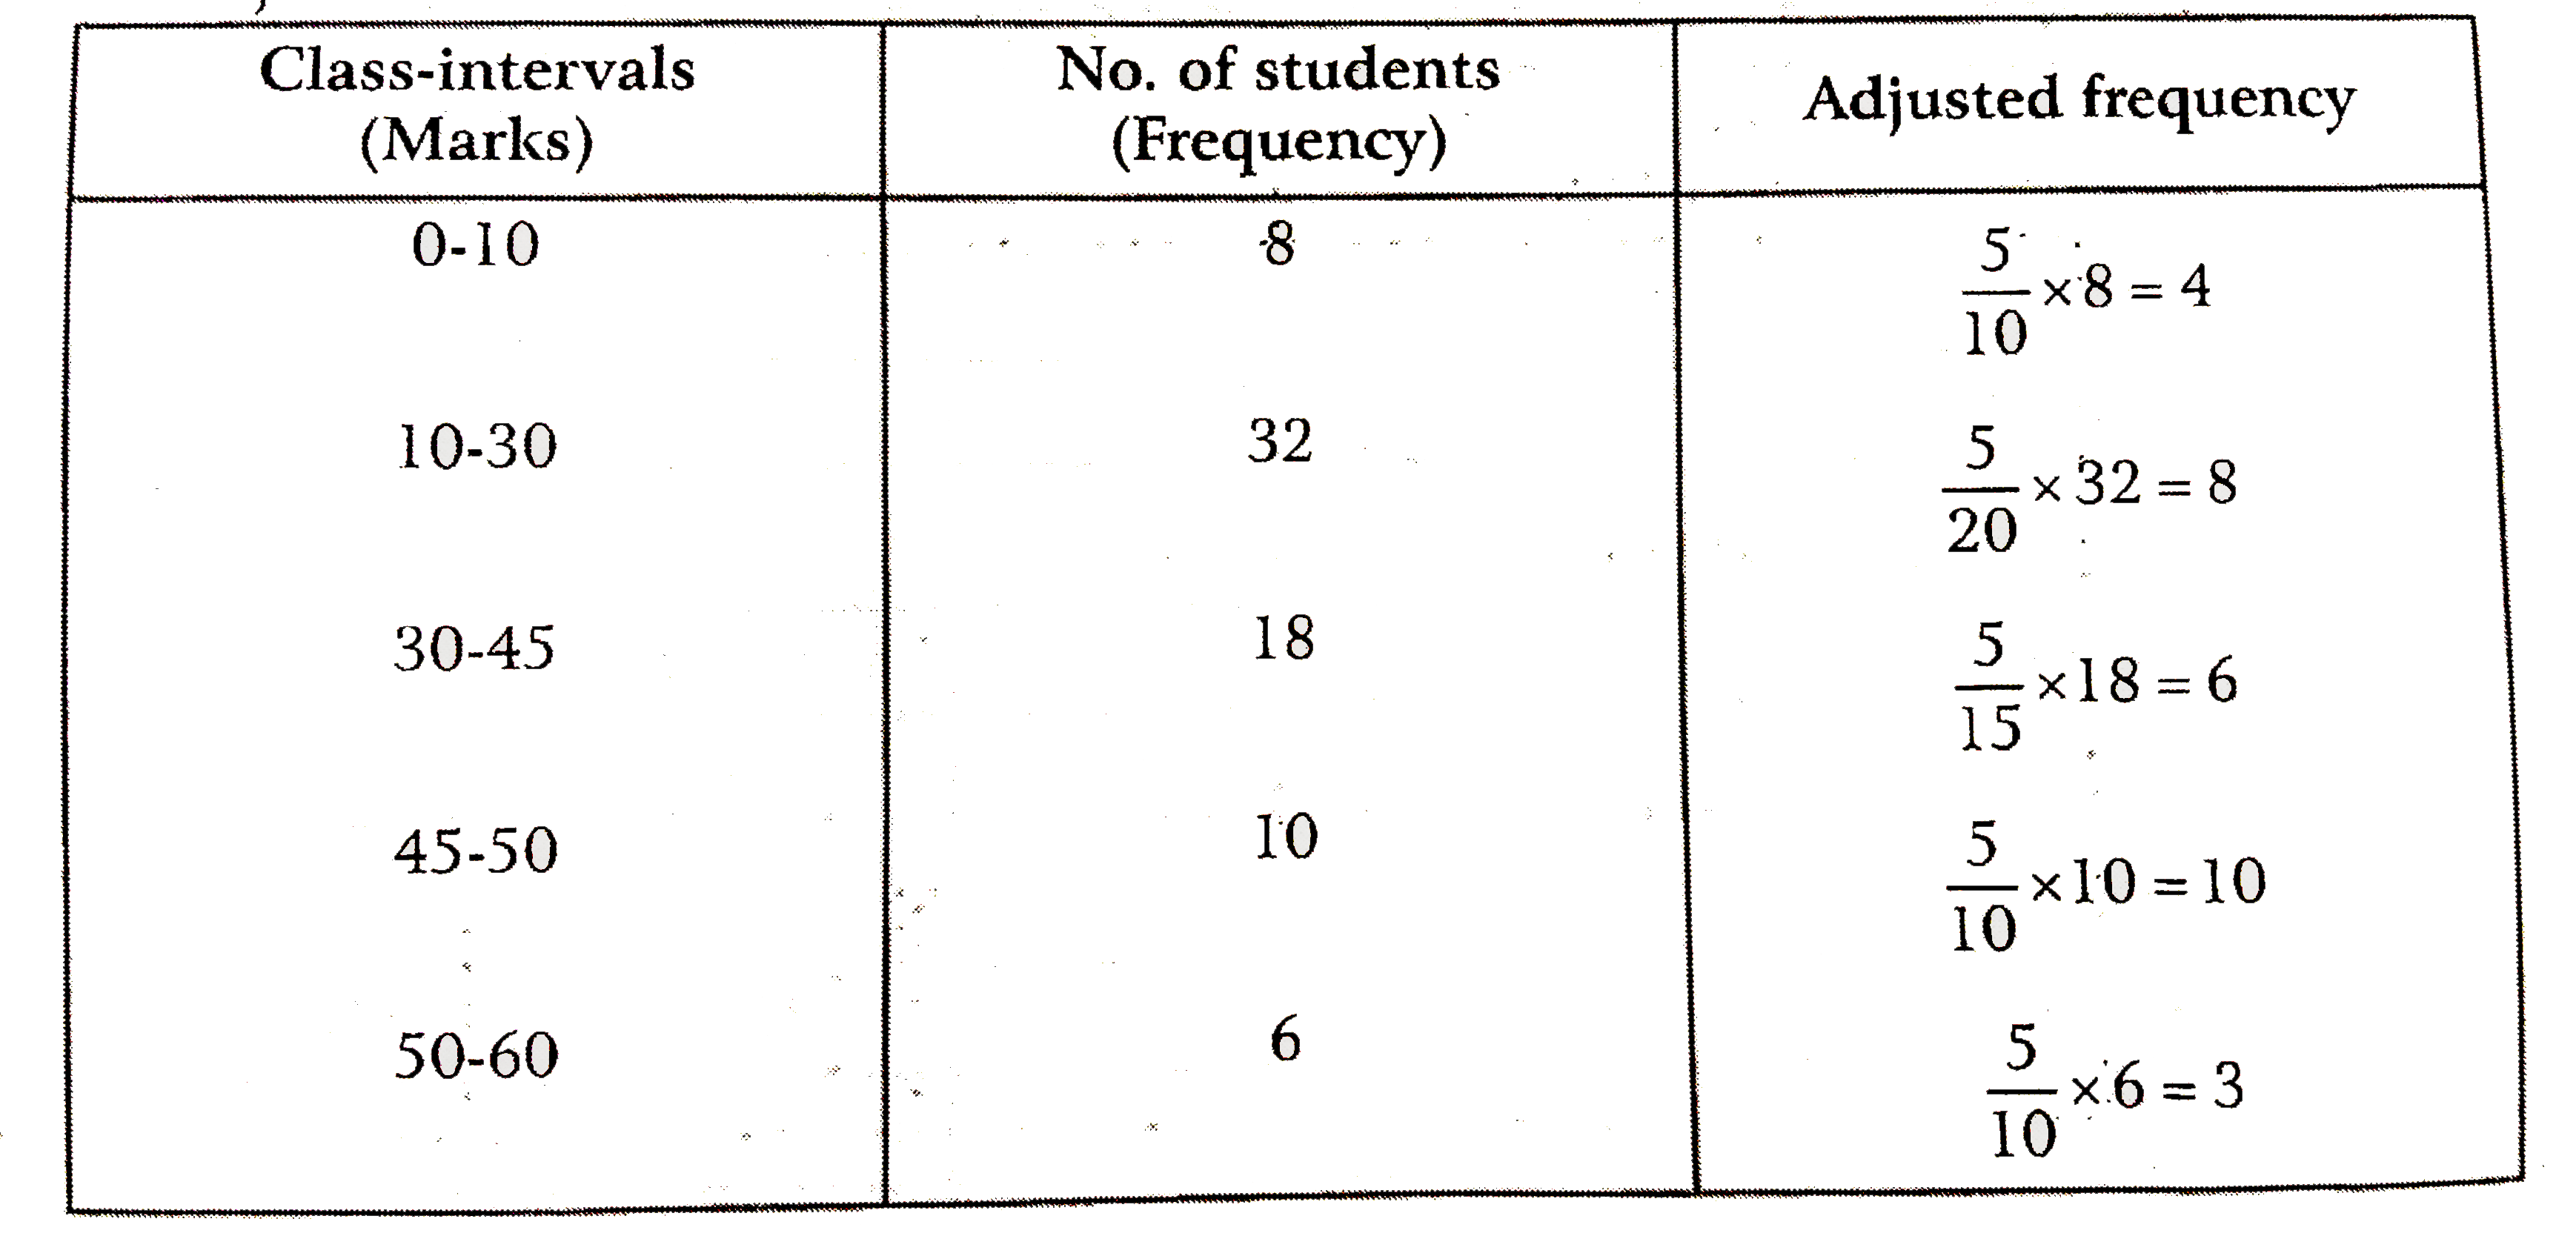
Here, minimum class-size = 5. So, we adjust the frequencies by using the following formula:
Adjusted frequency of a class =Minimum class-sizecalss-size×frequency of the class
The adjusted frequencies are computed as follows:

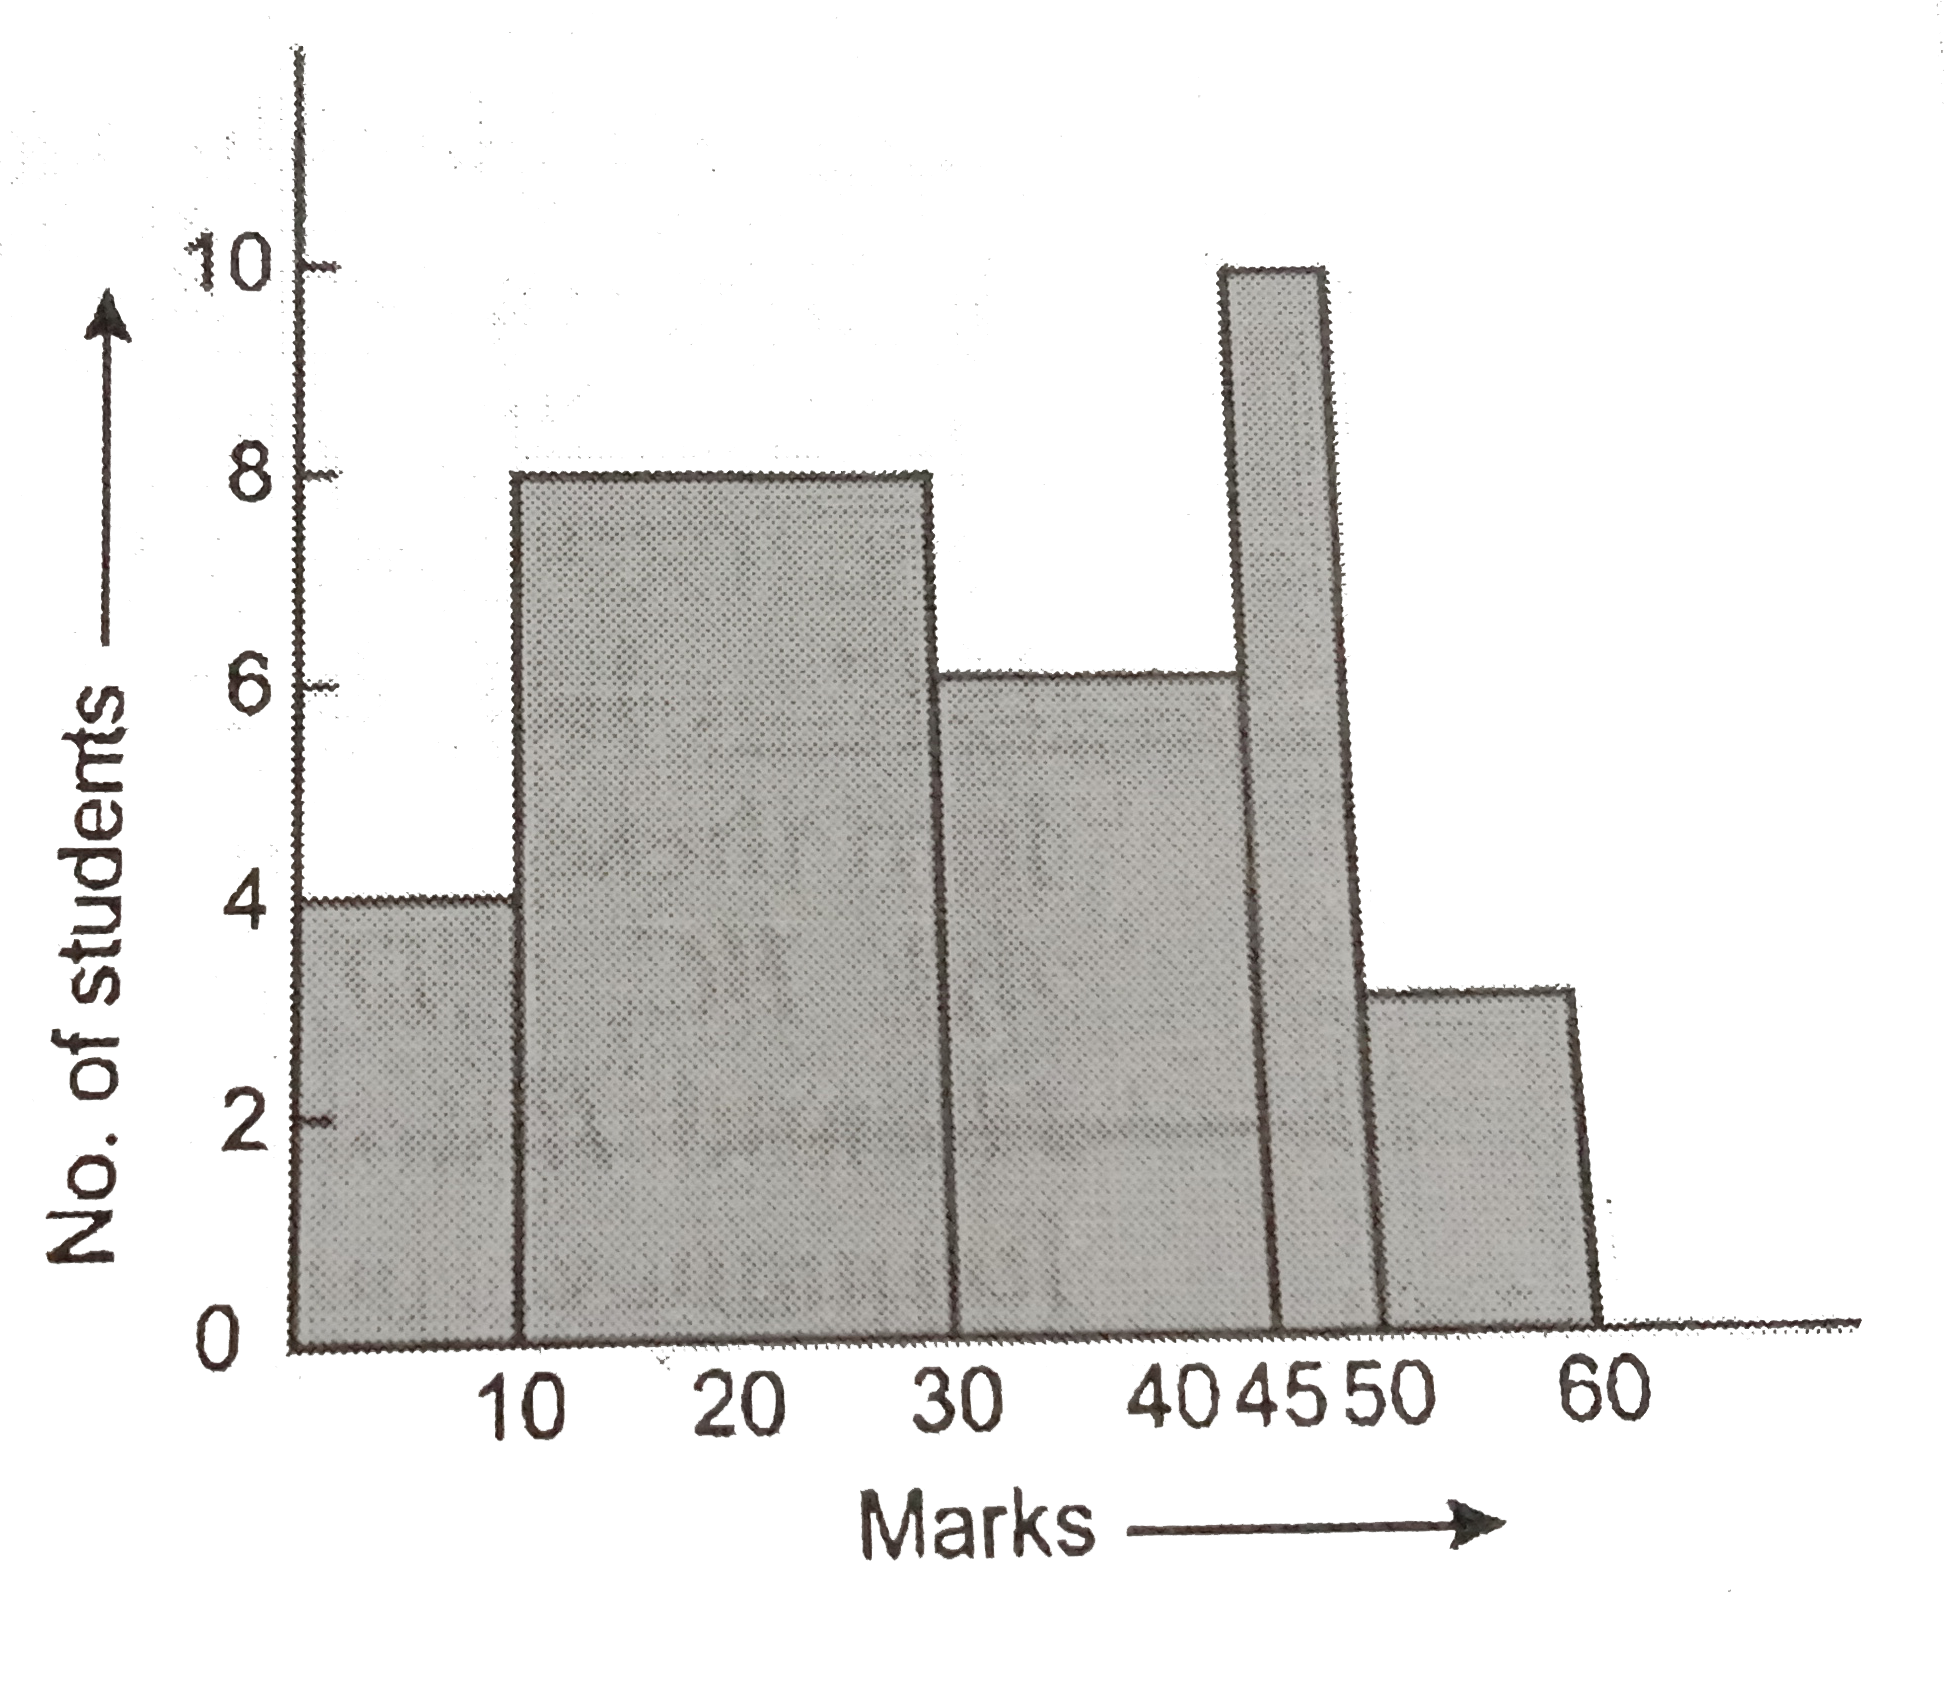
Now, we construct rectangles with class-limits as bases and respective adjusted frequencies as heights.

|
Topper's Solved these Questions
- STATISTICSBOOK - NAGEEN PRAKASHAN ENGLISHCHAPTER - STATISTICSEXERCISE - Problems From NCERT/exemplar
22 Videos
- STATISTICSBOOK - NAGEEN PRAKASHAN ENGLISHCHAPTER - STATISTICSEXERCISE - Exercise 14a
10 Videos
- QUADRILATERALSBOOK - NAGEEN PRAKASHAN ENGLISHCHAPTER - QUADRILATERALSEXERCISE - Revision Exercise (long Answer Questions)
5 Videos
- SURFACE AREA AND VOLUMEBOOK - NAGEEN PRAKASHAN ENGLISHCHAPTER - SURFACE AREA AND VOLUMEEXERCISE - Revision Exercise (long Answer Questions)
10 Videos
Similar Questions
Draw a histogram for the following data :

View SolutionDraw a histogram for the following data:

View SolutionDraw a histogram for the following data:

View SolutionDraw a histogram for the following data:

View SolutionDraw a histogram for the following data:

View SolutionDraw a histogram from the following data:

View SolutionCalculate the quartile deviation of the marks of 63 students in statistics given below :

View SolutionDraw a histogram of the following distribution.

View SolutionA mathematics aptitude test of 50 students was recorded as follows :

Draw a histogram for the above data using a graph paper and locate the mode.
View SolutionA Mathematics aptitude test of 50 students was recorded as follows:

Draw a histogram for the above data using a graph paper and locate the mode:
View Solution
