The percentages of various categories of workers in a state are given in the following table. Categories, Cultivators, Agricultural Labourers, Industrial Workers, Commercial Workers, Others % of workers, 40, 25, 12.5, 10, 12.5 Present the information in the form a pie-chart.
Step by step video & image solution for The percentages of various categories of workers in a state are given in the following table. Categories, Cultivators, Agricultural Labourers, Industrial Workers, Commercial Workers, Others % of workers, 40, 25, 12.5, 10, 12.5 Present the information in the form a pie-chart. by Maths experts to help you in doubts & scoring excellent marks in Class 8 exams.
Updated on:21/07/2023Topper's Solved these Questions
Similar Questions
The weights in kilograms of 60 workers in a factory are given in the following frequency table. Find the mean weight of a worker. Weight (in kg) x: 60 61 62 63 64 65 No. of workers f: 5 8 14 16 10 7
View SolutionThe following table shows the expenditure incurred by a publisher in publishing a book: Items, Paper, Printing, Binding, Advertishing, Misc. Expenditure (in %), 35%, 20%, 10%, 5%, 30% Present the above data in the form of a pie-chart.
View Solution
Knowledge Check
The following table gives the number of households in USA during 2000-2014.
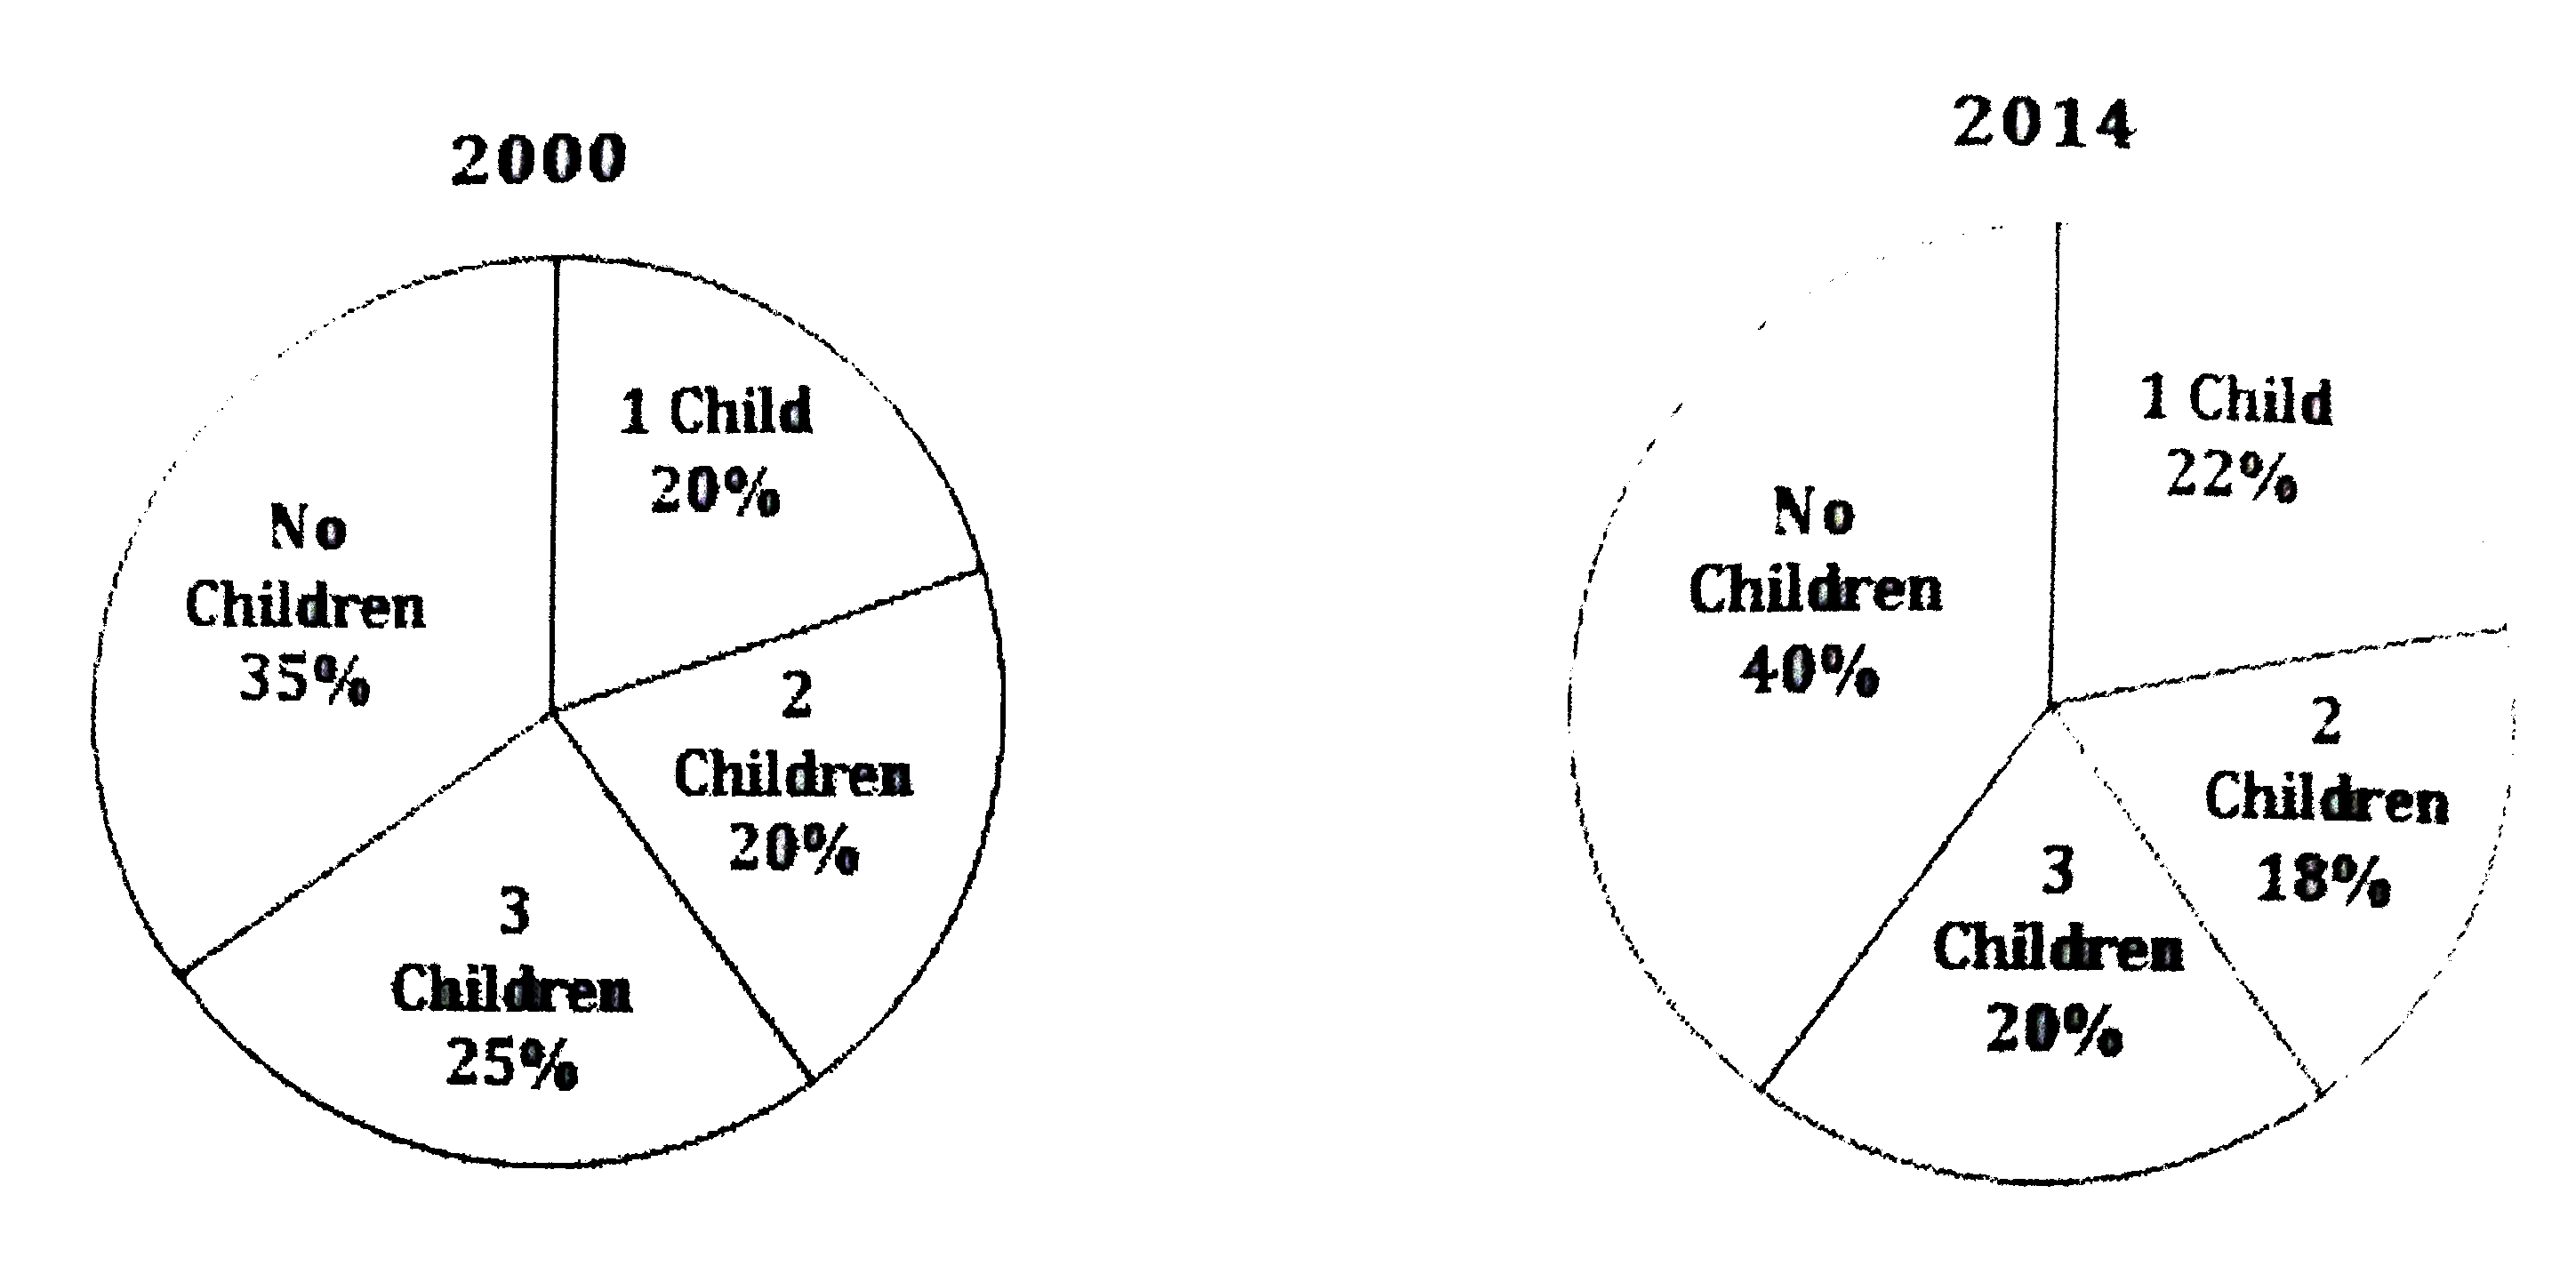
The following charts give the distribution of households based on the numbers of children for the years 2000 and 2014.

The following charts give the distribution based on the number of childre for the year 2000 and 2014.

In 2000, 20 % of the household beloing to the category " no children " decided to have children . If those households had 1,2 and 3 children in the ratio of 4:2:1, respectively , what would be the share of households having 2 children ?A21.0%B22.0%C24.0%D26.4%The Key Club at the local high school is sponsoring an Easter egg hunt at the park. 250 children register for the hunt. The Key Clb members decide that it is more fair if children are divided into four age catagories, as shown in the following table.
Age categoryUnder 22−56−10Over 10Number of children245312547
70 eggs that have special prizes in them will be distributed proportionally to each age category. How many prizes will the club members award to the children in the 6- 10 age range ?A18B27C32D35

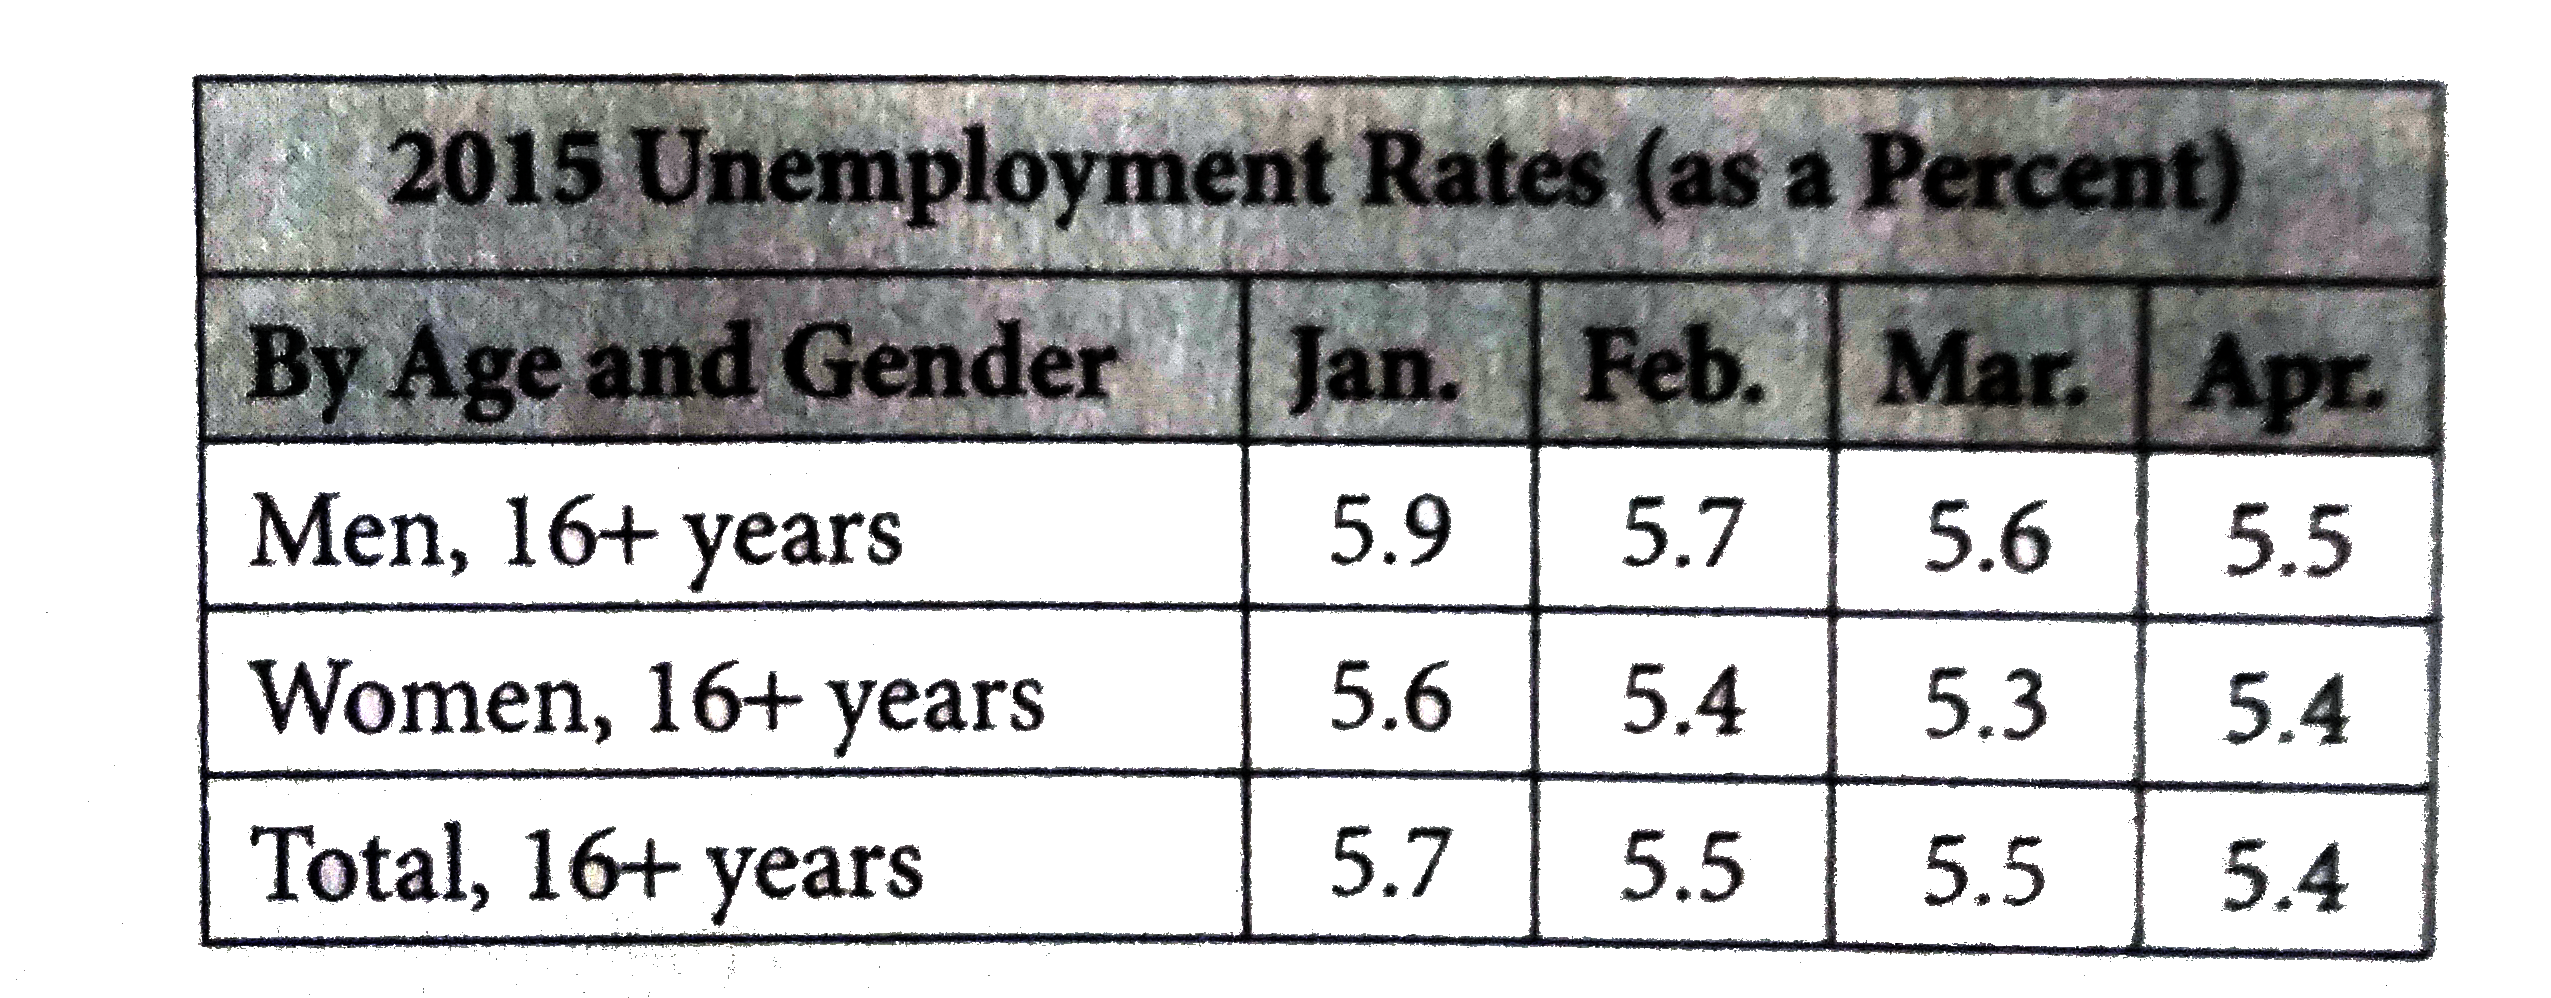
Unemployment rates in the U.S. for the first four months of 2015 are given in the table above. These rates are based on prople, 16 years and order, that are considered to be part of the workforce. In a certain distinct, there are 12,800 people eligible to be part of the workforce, of work 53.5% are men. Based on the information in the table, how many more men in this distrinct were unemployed than women in April 2015 in this distinct?
View Solution10000 workers were employed to construct a river bridge In four years. At the end of first year, 10% workers were retrenched. At the end of the second year, 5% of the workers at that time were retrenched. However to complete the project in time, the number of workers was increased by 10% at the end of the third year. How many workers were working during the fourth year?
View SolutionThe following table gives the daily income of 50 workers of a factory: Daily income (in Rs): 100-120 120-140 140-160 160-180 180-200 Number of workers: 12 14 8 6 10 Find the mean, mode and median of the above data.
View SolutionThe following table gives the weekly wages of workers in a factory. Weekly wages(Rs) 50-55 55-60 60-65 65-70 70-75 75-80 80-85 85-90 No. of workers 5 20 10 10 9 6 12 18 Calculate the mean, by using Short Cut Method.
View SolutionPercentage of the different products of a village in a particular district are given below. Draw a pie chart representing this information. Items, Wheat, Pulses, Jwar, Grounnuts, Vegetables, Total %, 1253 , 1256 , 252 , 503 , 503 , 100
View Solution
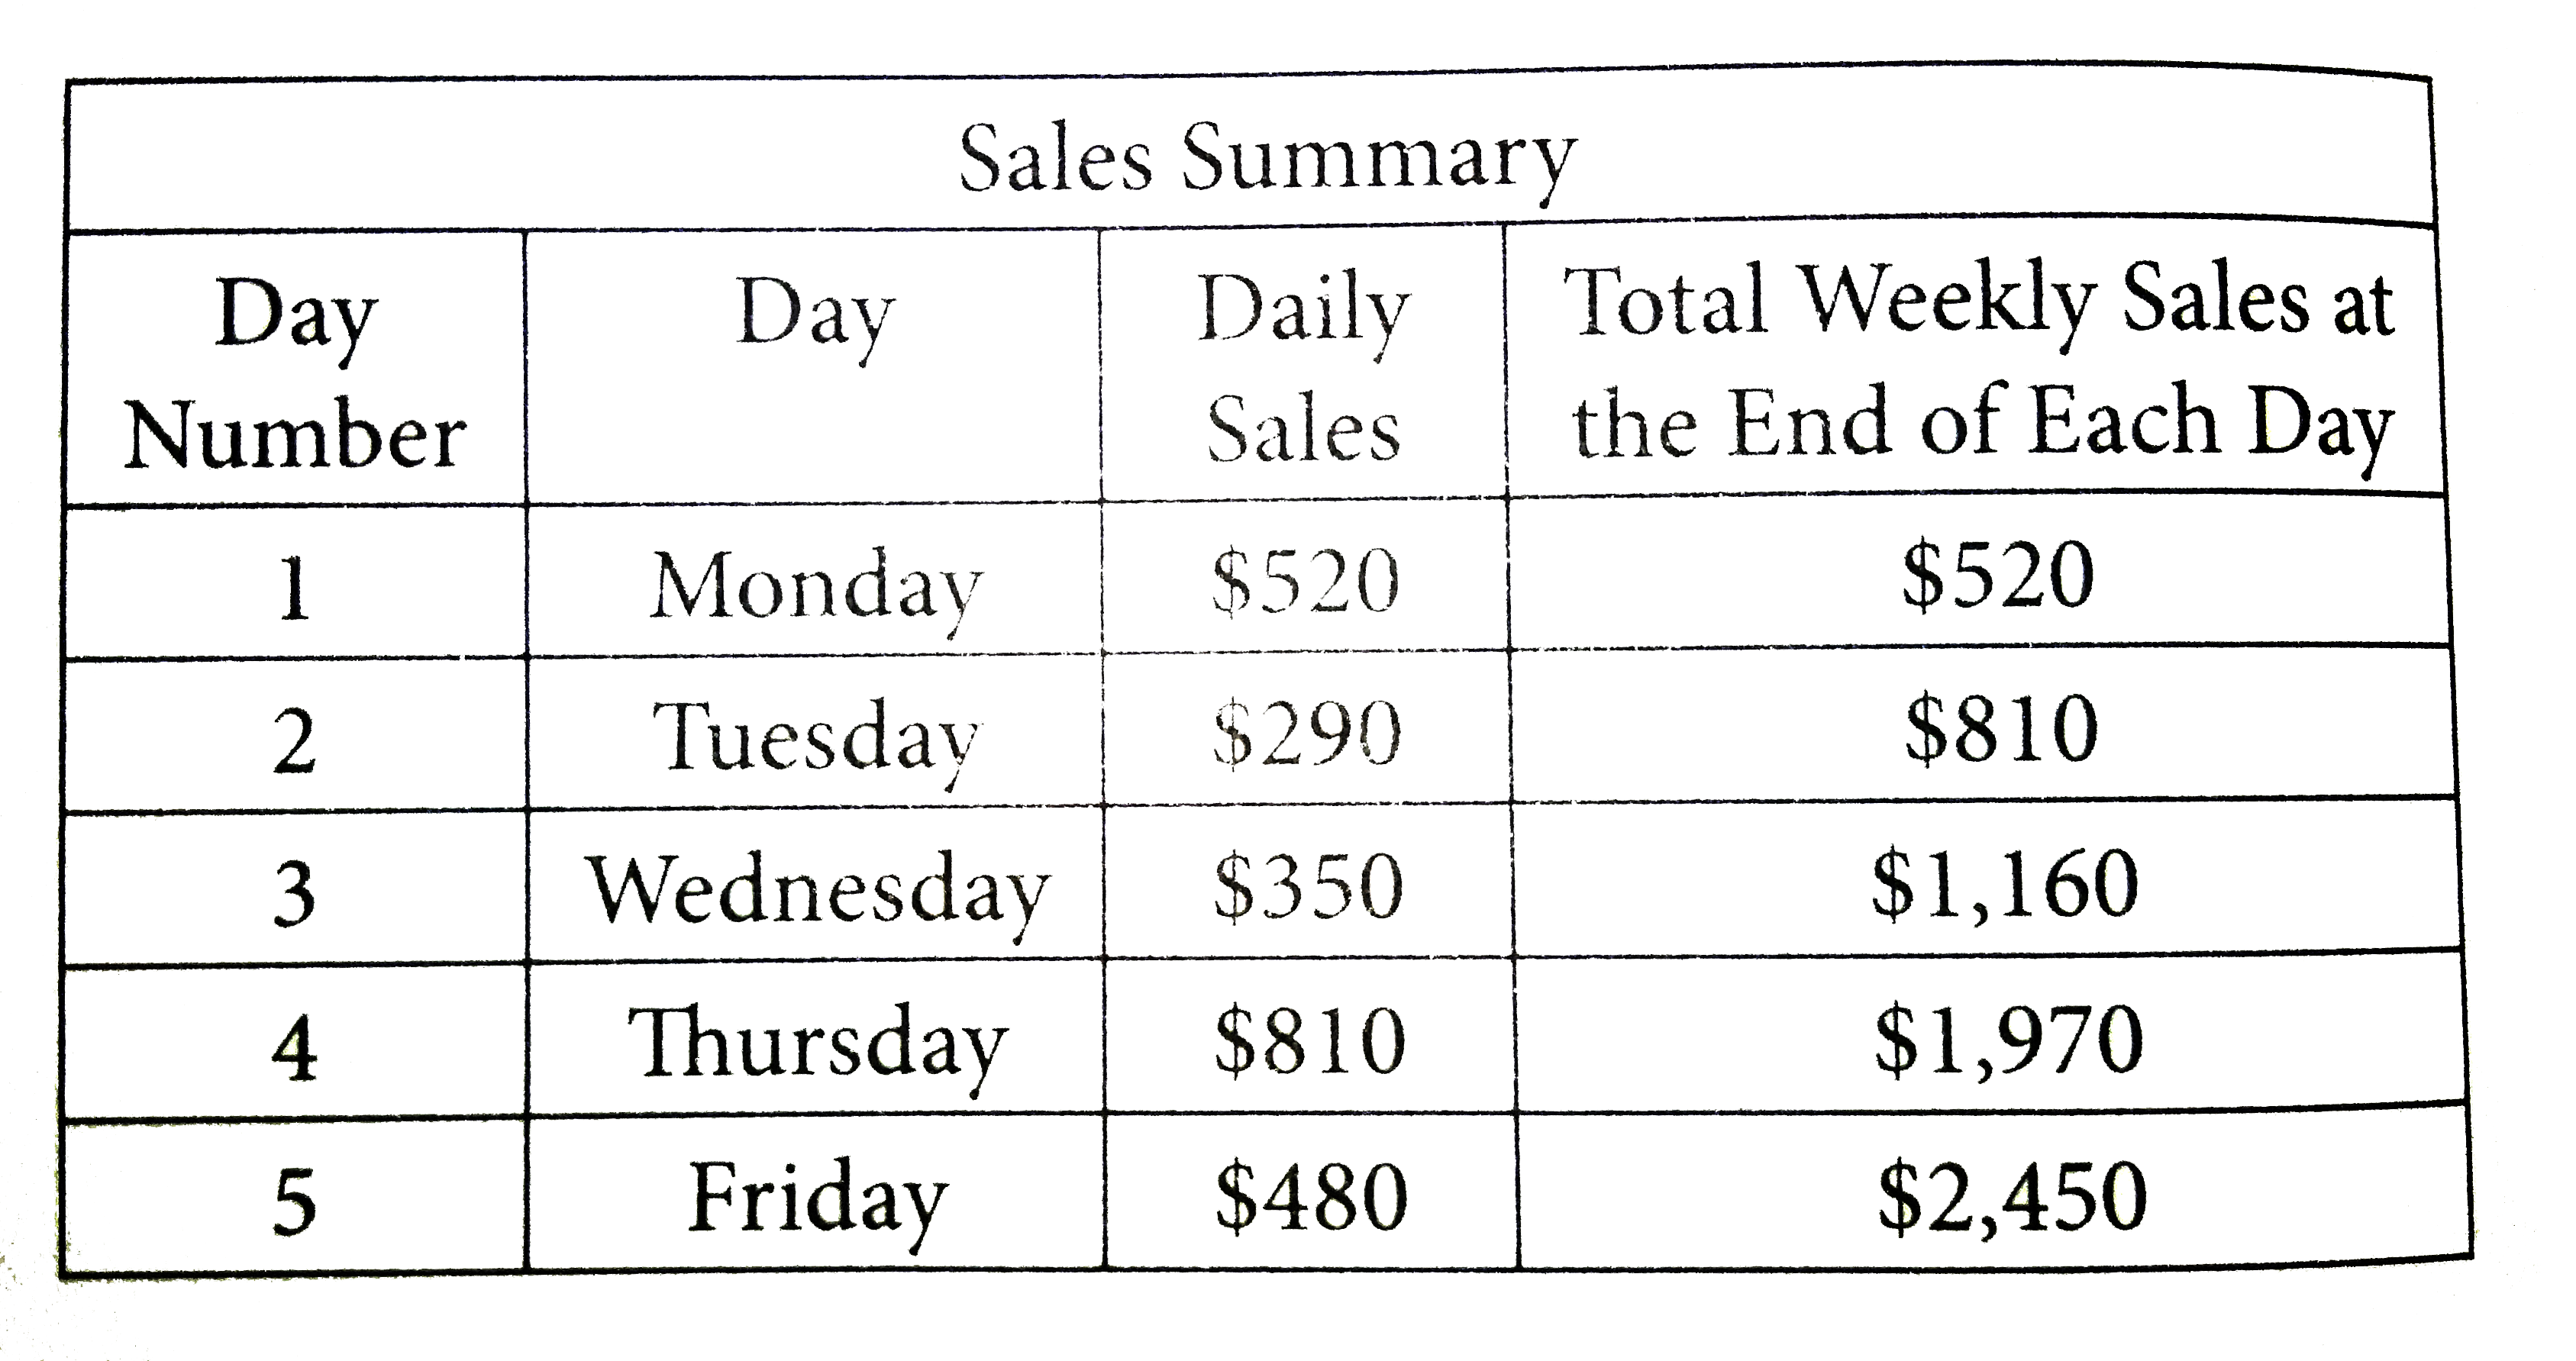
A salesperson recorded her sales during a particular 5-day work week, shown in the table above, in order to study her daily sales.
The salesperson wants to increase her averages sales per day by 20% in the following week. Given the information in the chart above, what should her daily sales average be for the following week?
View Solution
