Which of the following curves represents the Henry's law ?
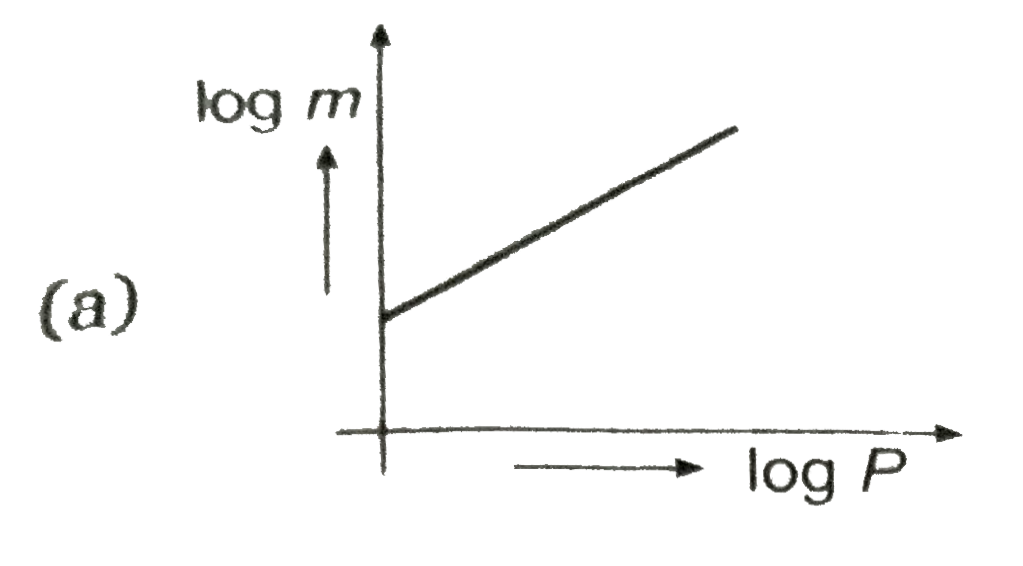
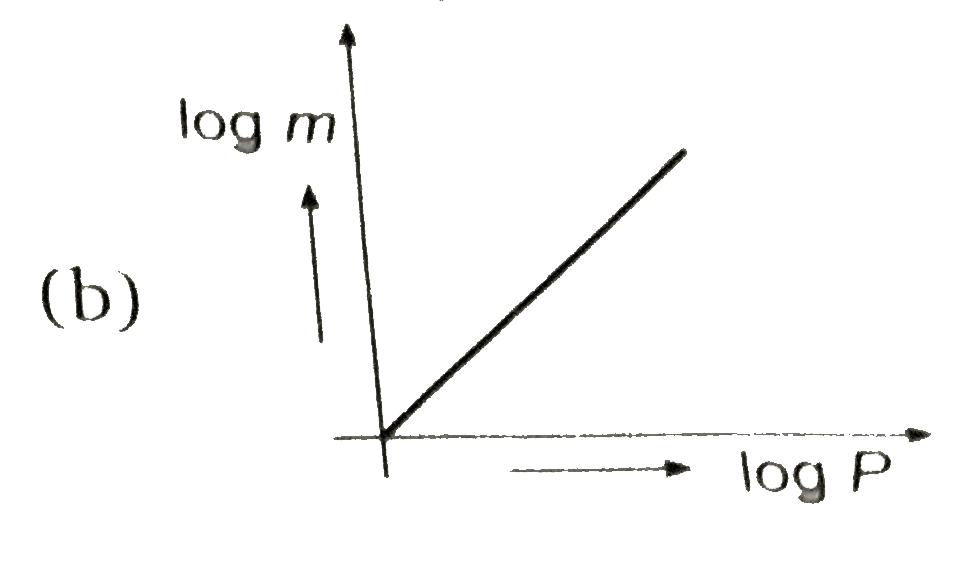
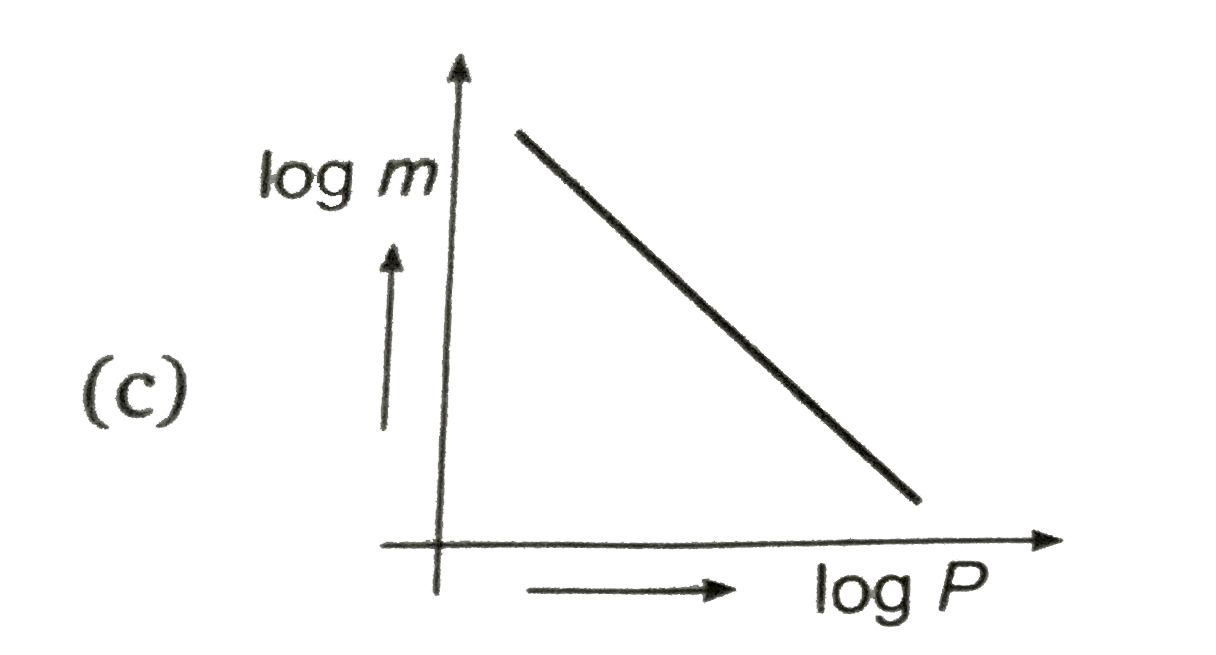
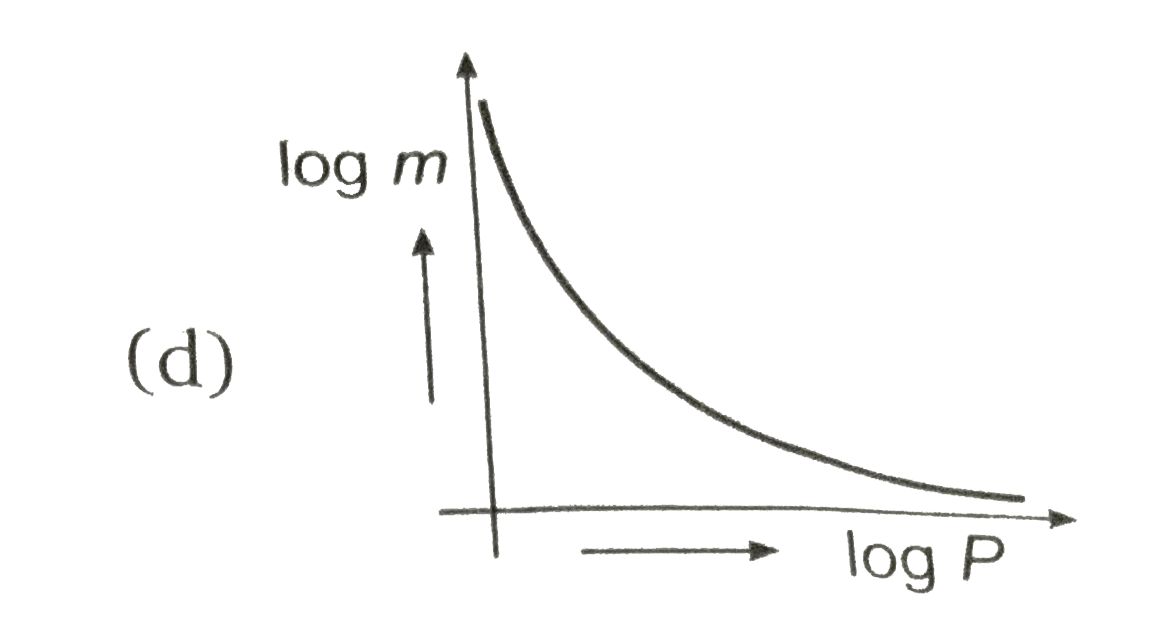
The correct Answer is:a
To determine which curve represents Henry's law, we can follow these steps:
Step 1: Understand Henry's Law
Henry's law states that the pressure (P) of a gas is directly proportional to its molality (M). This can be expressed mathematically as:
P=kh⋅M
where kh is Henry's constant.
Step 2: Rearranging the Equation
To analyze the relationship further, we can take the logarithm of both sides of the equation:
logP=logkh+logM
Step 3: Identify the Form of the Equation
The equation logP=logkh+logM resembles the equation of a straight line:
y=mx+c
where:
- y is logP
- x is logM
- m (slope) is 1
- c (y-intercept) is logkh
Step 4: Characteristics of the Graph
From the above analysis, we can conclude that:
- The graph will be a straight line.
- The slope of the line will be positive (since the relationship is direct).
- The y-intercept will be logkh, which is a constant.
Step 5: Analyze the Given Options
Now, we need to evaluate the provided curves based on the characteristics we derived:
1. Option A: A straight line with a positive slope - This could represent Henry's law.
2. Option B: A straight line with a negative slope - This does not represent Henry's law.
3. Option C: A straight line with zero intercept - This does not represent Henry's law.
4. Option D: A curve that is not a straight line - This does not represent Henry's law.
Step 6: Conclusion
Based on the analysis, the correct answer is Option A, as it is the only option that represents a straight line with a positive slope.
---
Henry's law states that the pressure (P) of a gas is directly proportional to its molality (M). This can be expressed mathematically as:
P=kh⋅M
where kh is Henry's constant.
To analyze the relationship further, we can take the logarithm of both sides of the equation:
logP=logkh+logM
The equation logP=logkh+logM resembles the equation of a straight line:
y=mx+c
where:
- y is logP
- x is logM
- m (slope) is 1
- c (y-intercept) is logkh
From the above analysis, we can conclude that:
- The graph will be a straight line.
- The slope of the line will be positive (since the relationship is direct).
- The y-intercept will be logkh, which is a constant.
Now, we need to evaluate the provided curves based on the characteristics we derived:
1. Option A: A straight line with a positive slope - This could represent Henry's law.
2. Option B: A straight line with a negative slope - This does not represent Henry's law.
3. Option C: A straight line with zero intercept - This does not represent Henry's law.
4. Option D: A curve that is not a straight line - This does not represent Henry's law.
Based on the analysis, the correct answer is Option A, as it is the only option that represents a straight line with a positive slope.
Topper's Solved these Questions
- DILUTE SOLUTIONBOOK - NARENDRA AWASTHI ENGLISHCHAPTER - DILUTE SOLUTIONEXERCISE - leval-02
26 Videos
- DILUTE SOLUTIONBOOK - NARENDRA AWASTHI ENGLISHCHAPTER - DILUTE SOLUTIONEXERCISE - leval-03
23 Videos
- CHEMICAL EQUILIBRIUMBOOK - NARENDRA AWASTHI ENGLISHCHAPTER - CHEMICAL EQUILIBRIUMEXERCISE - Match the column
1 Videos
- ELECTROCHEMISTRYBOOK - NARENDRA AWASTHI ENGLISHCHAPTER - ELECTROCHEMISTRYEXERCISE - Subjective problems
14 Videos
Similar Questions
Knowledge Check
A block of ice at −10∘C is slowly heated and converted to steam at 100∘C. Which of the following curves represents the phenomenon qualitatively?
A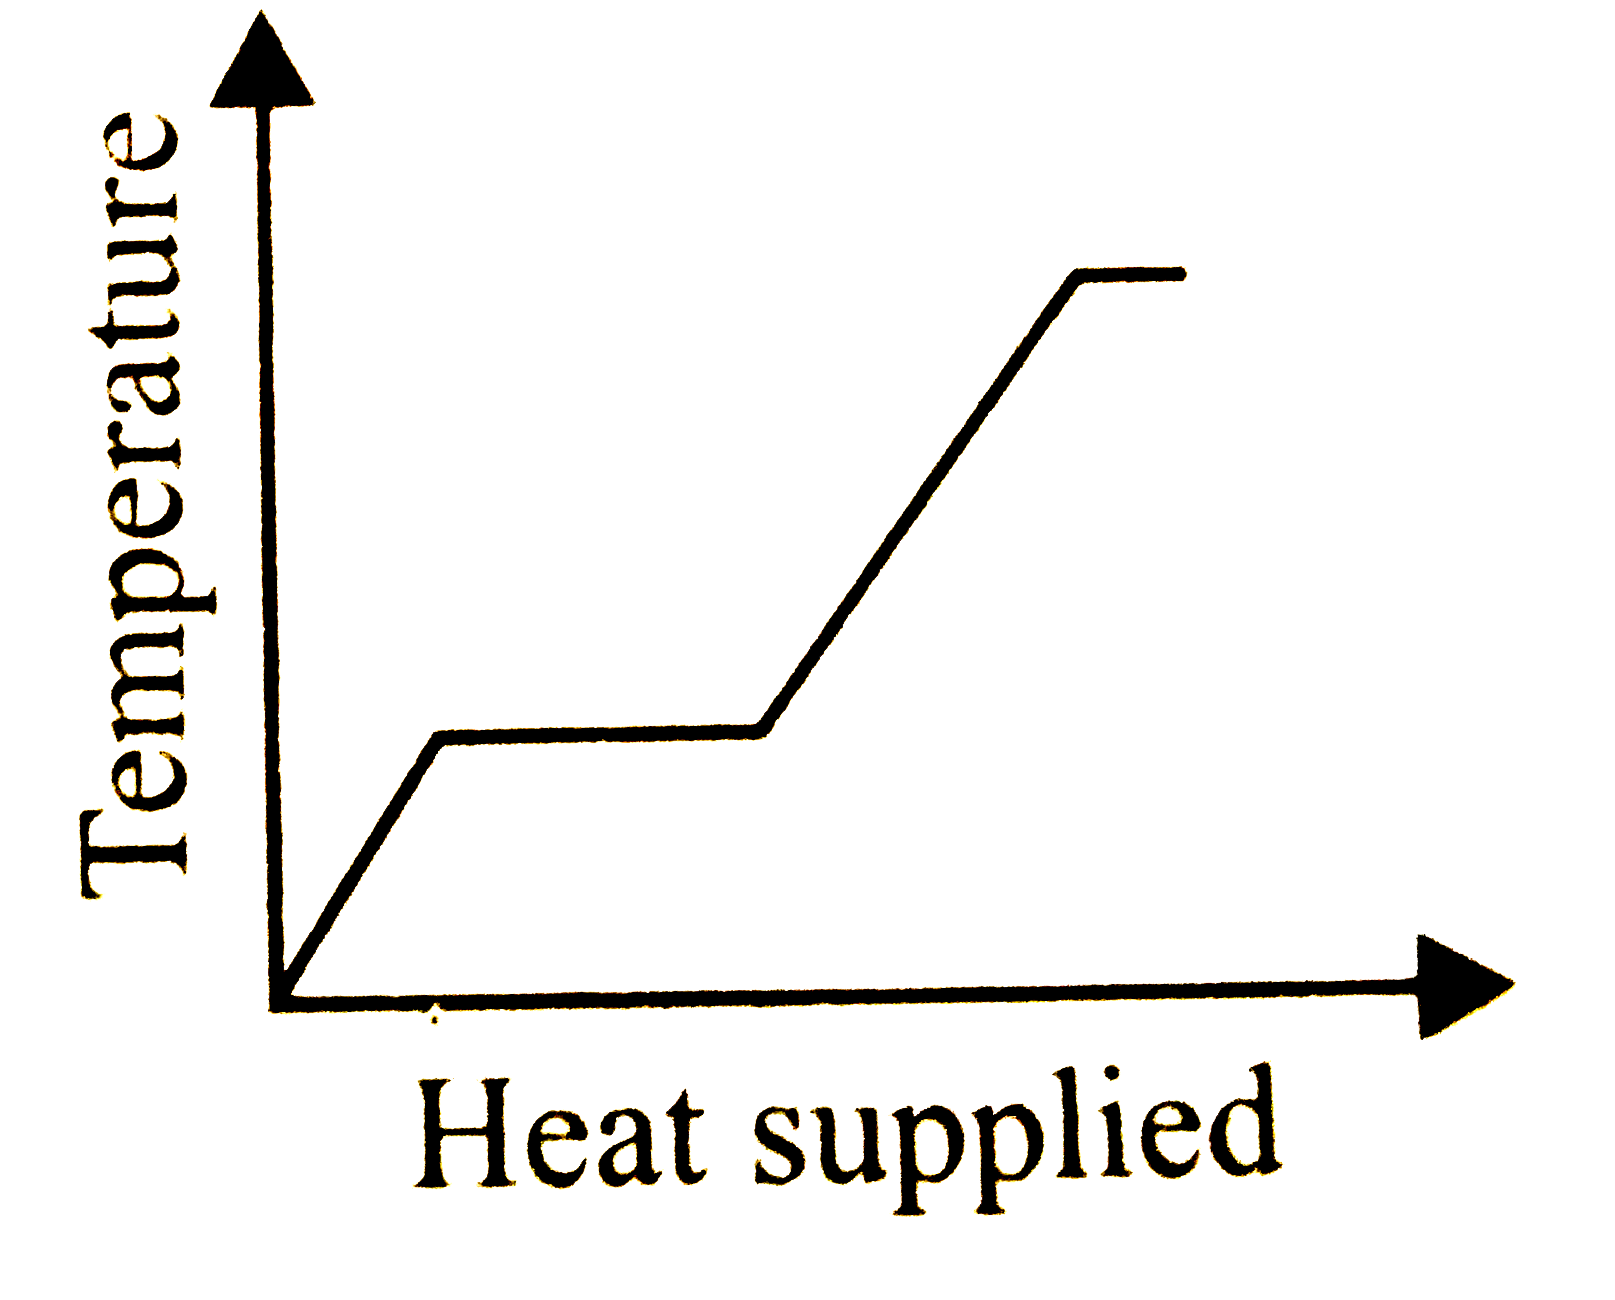 B
B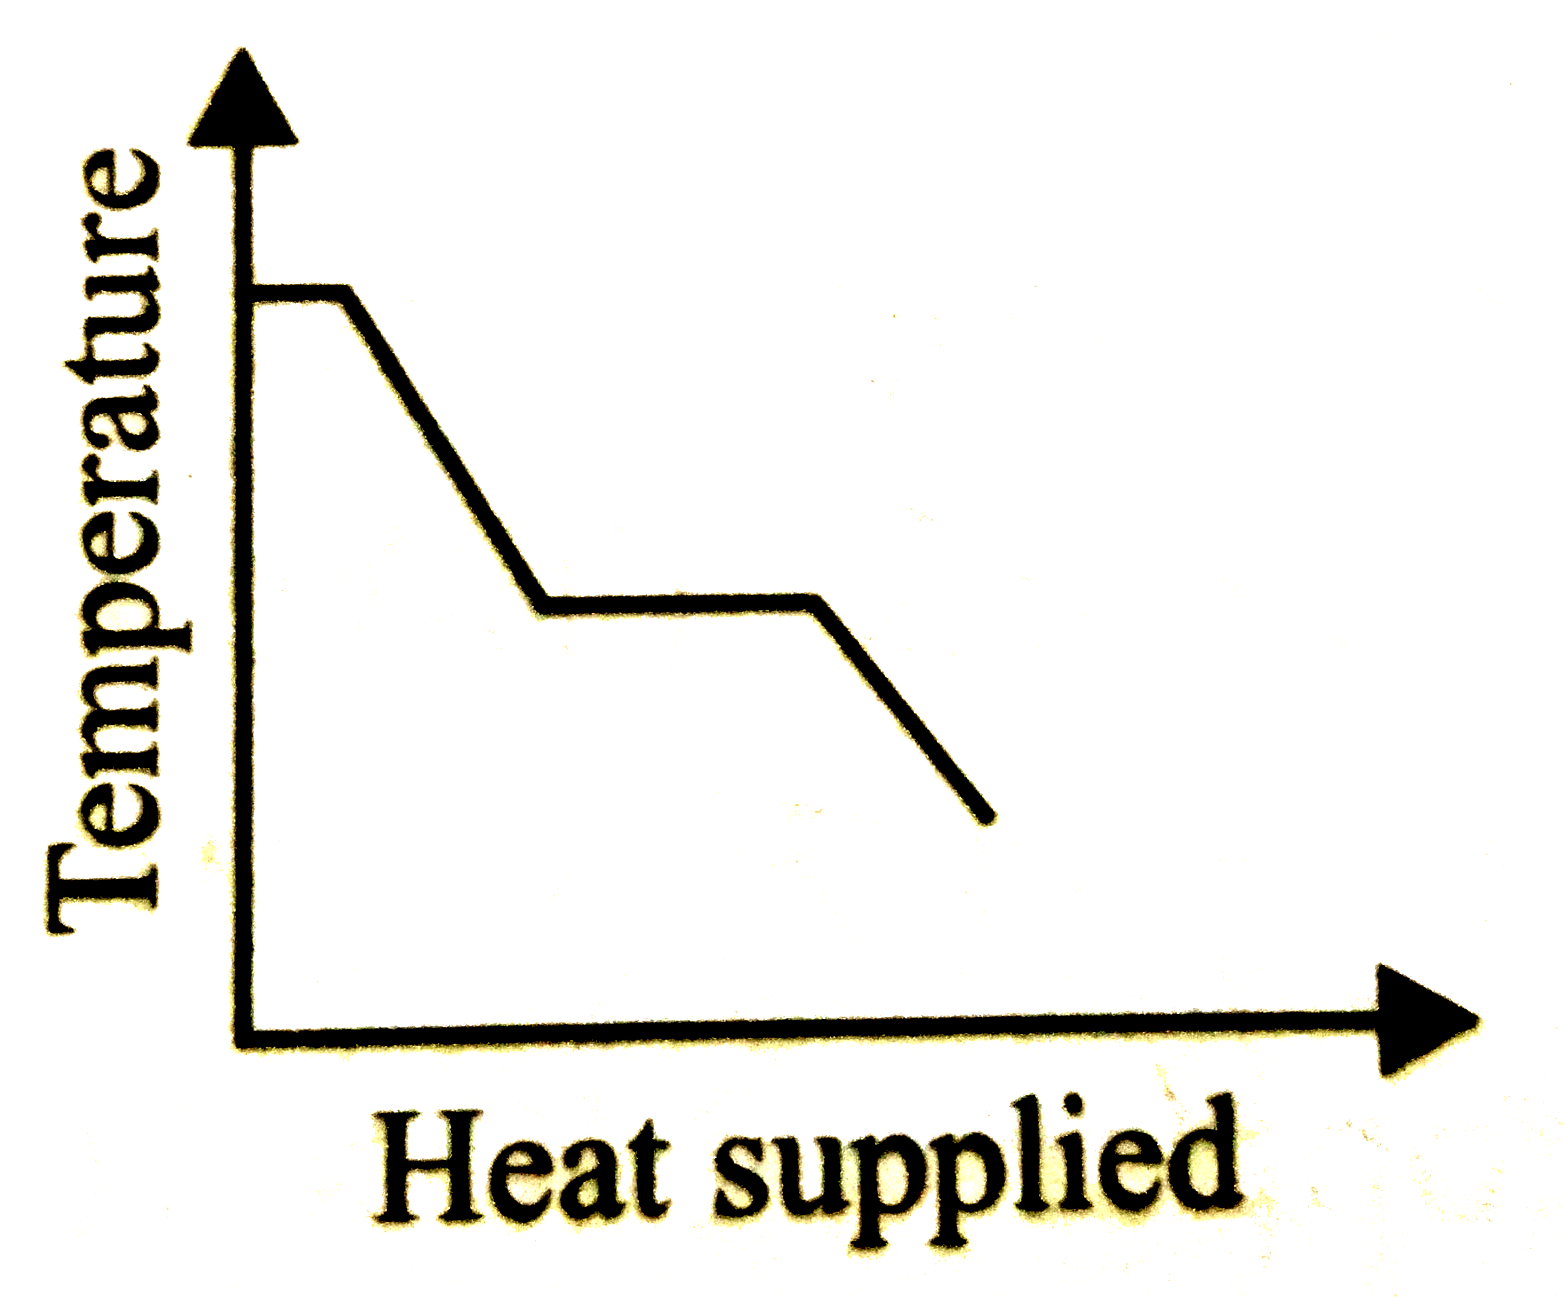 C
C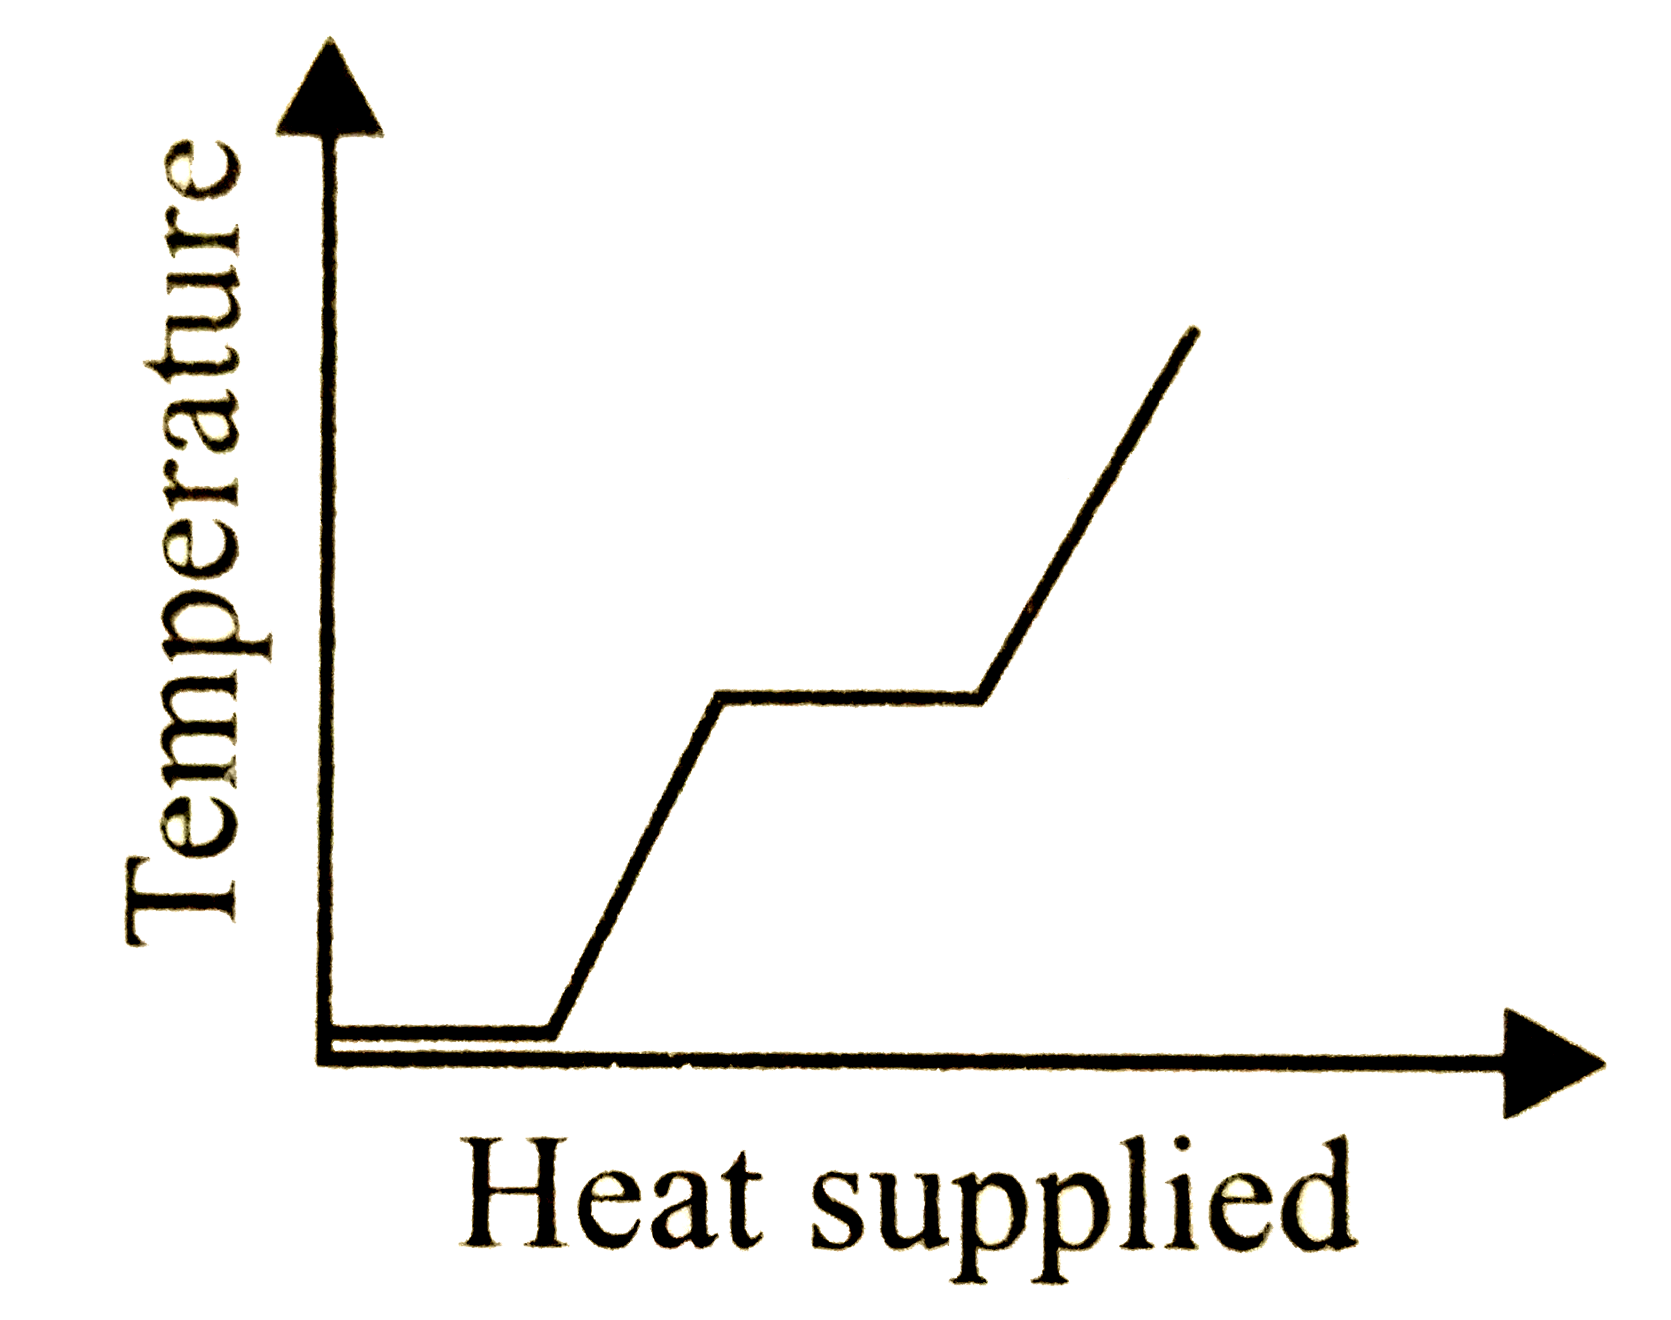 D
D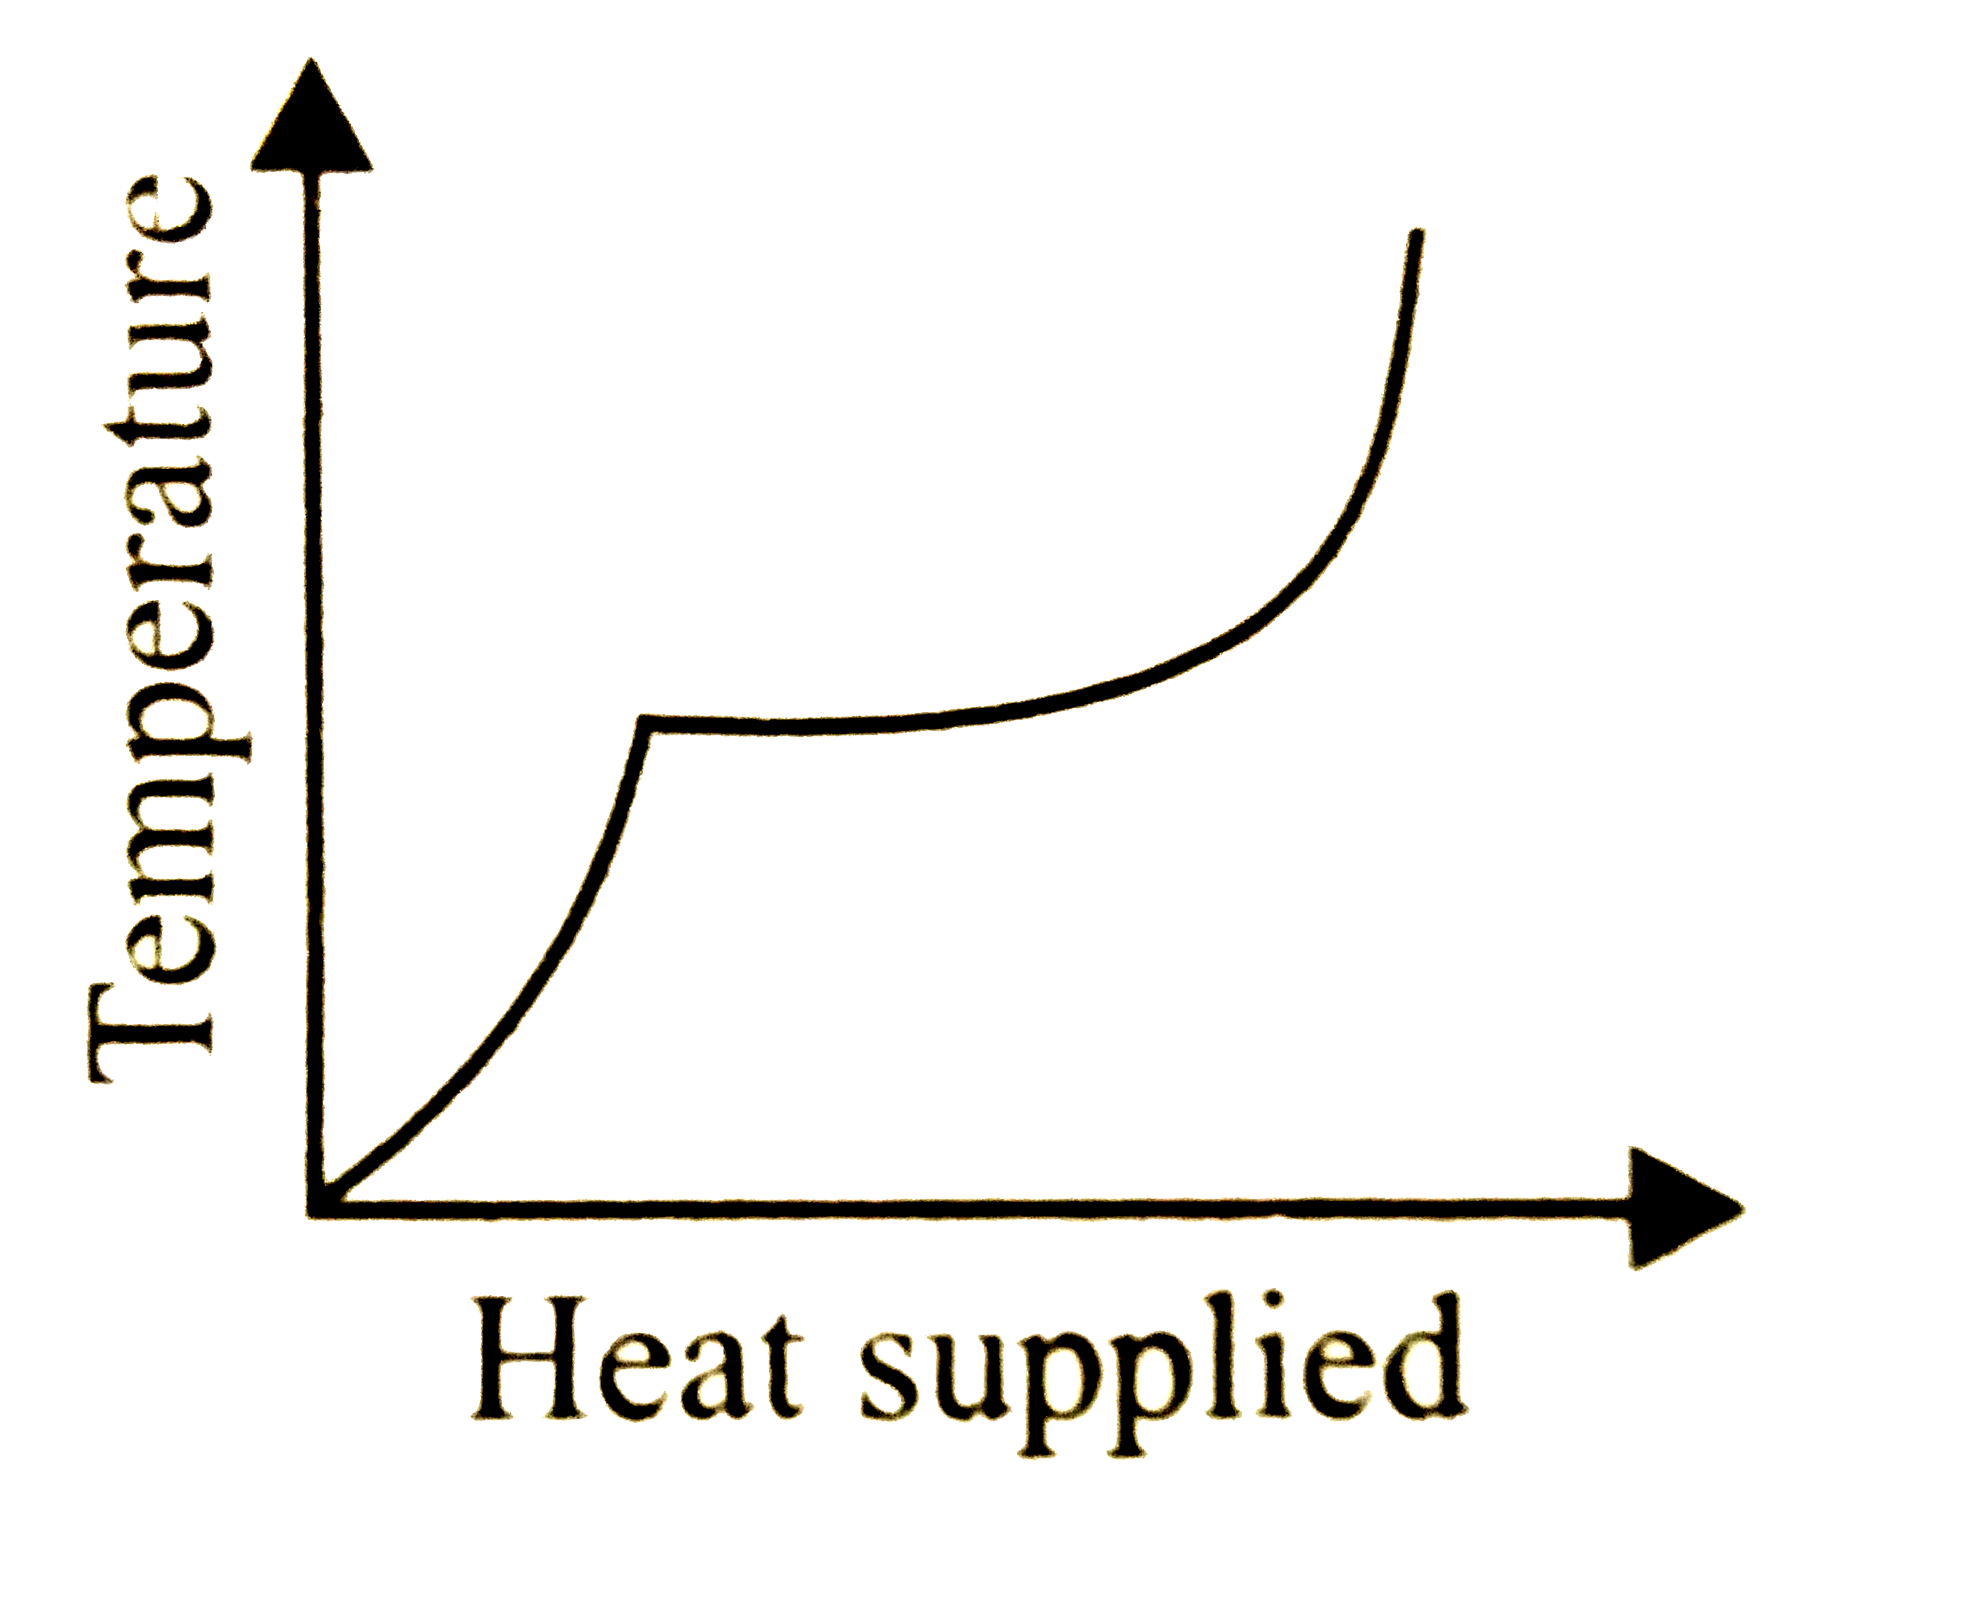
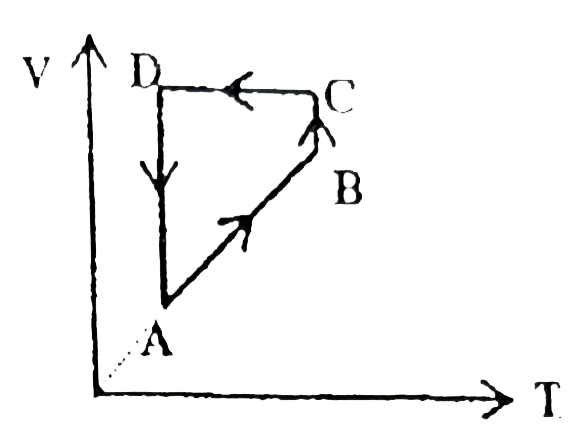
A cyclic process ABCD is shown in the V−T diagram. Which of the following curves represent the same process ?
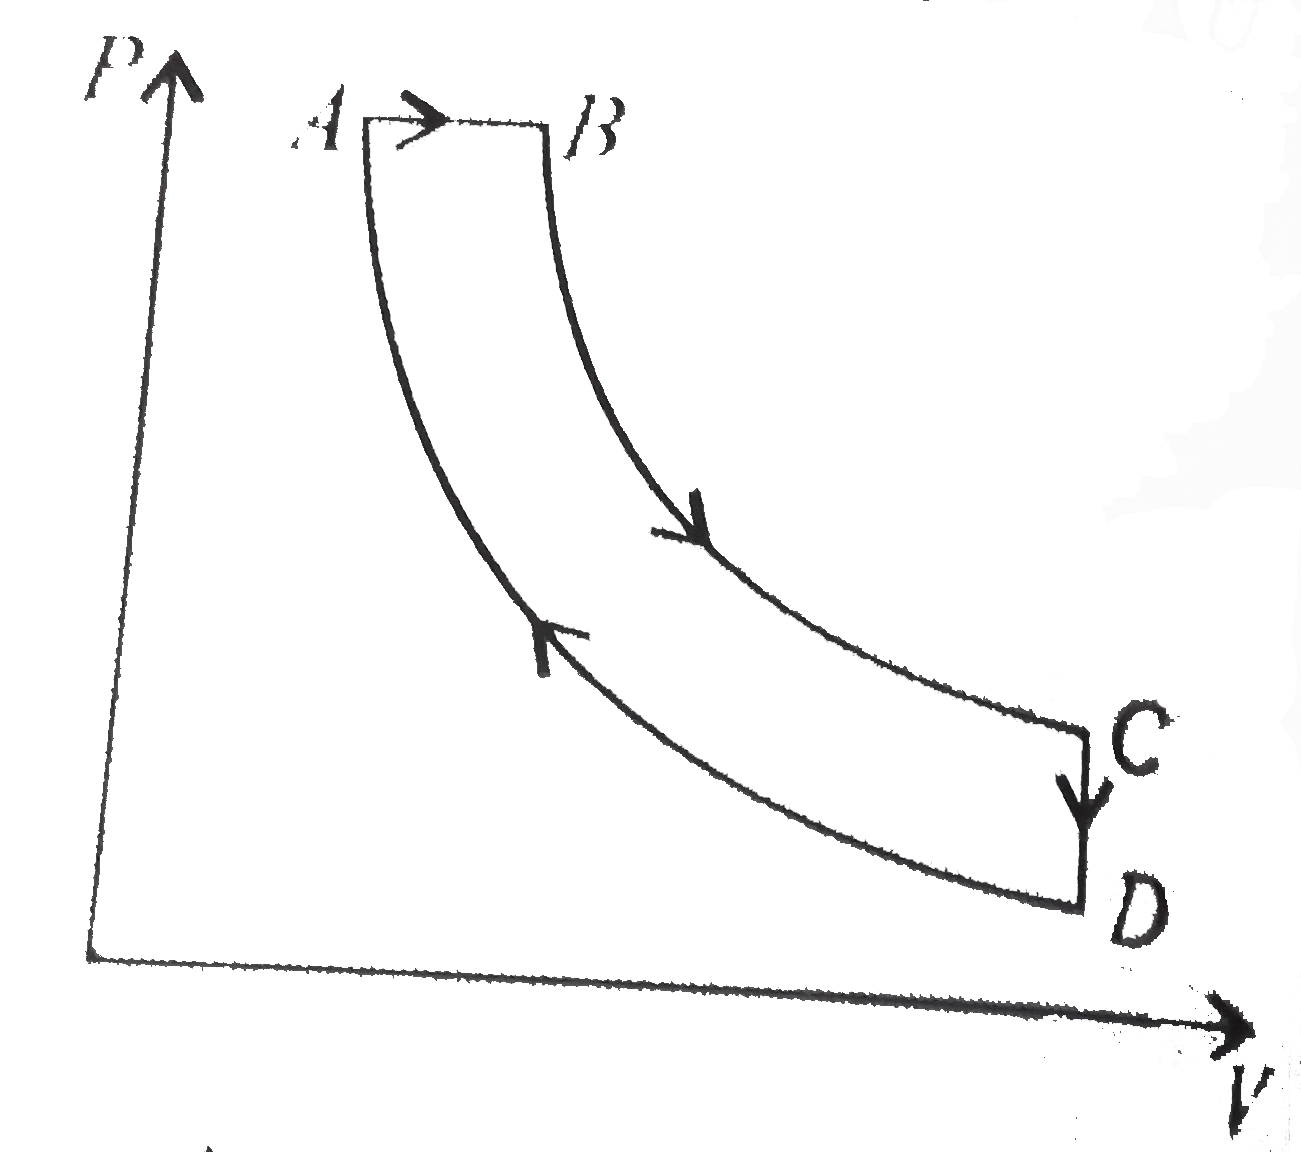
View SolutionA cyclic process ABCD is shown in the P−V diagram. Which of the following curves represents the same process?
View SolutionA block of ice at −12∘C is slowly heated and converted into steam at 100∘C. Which of the following curves best represents the event ?
View SolutionA cyclic process ABCD is shown in the P−V diagram. Which of the following curves represents the same process?

View SolutionA train is moving towards a stationary observer. Which of the following curve best represents the frequency recived by observer f as a function of time?
View Solution
A cyclic process ABCD is shown in the p-V diagram. Which of the following curves represent the same process?
View SolutionA cyclic process ABCD is shown in the figure P-V diagram. Which of the following curves represent the same process?
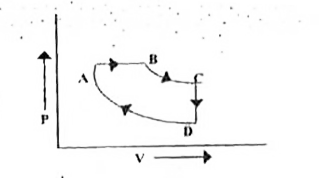
View Solution

