Graphs between pressure and volume are plotted at different temperatures . Which of the following isotherms represents Boyle's law as PV = constant ? (T1>T2>T3)
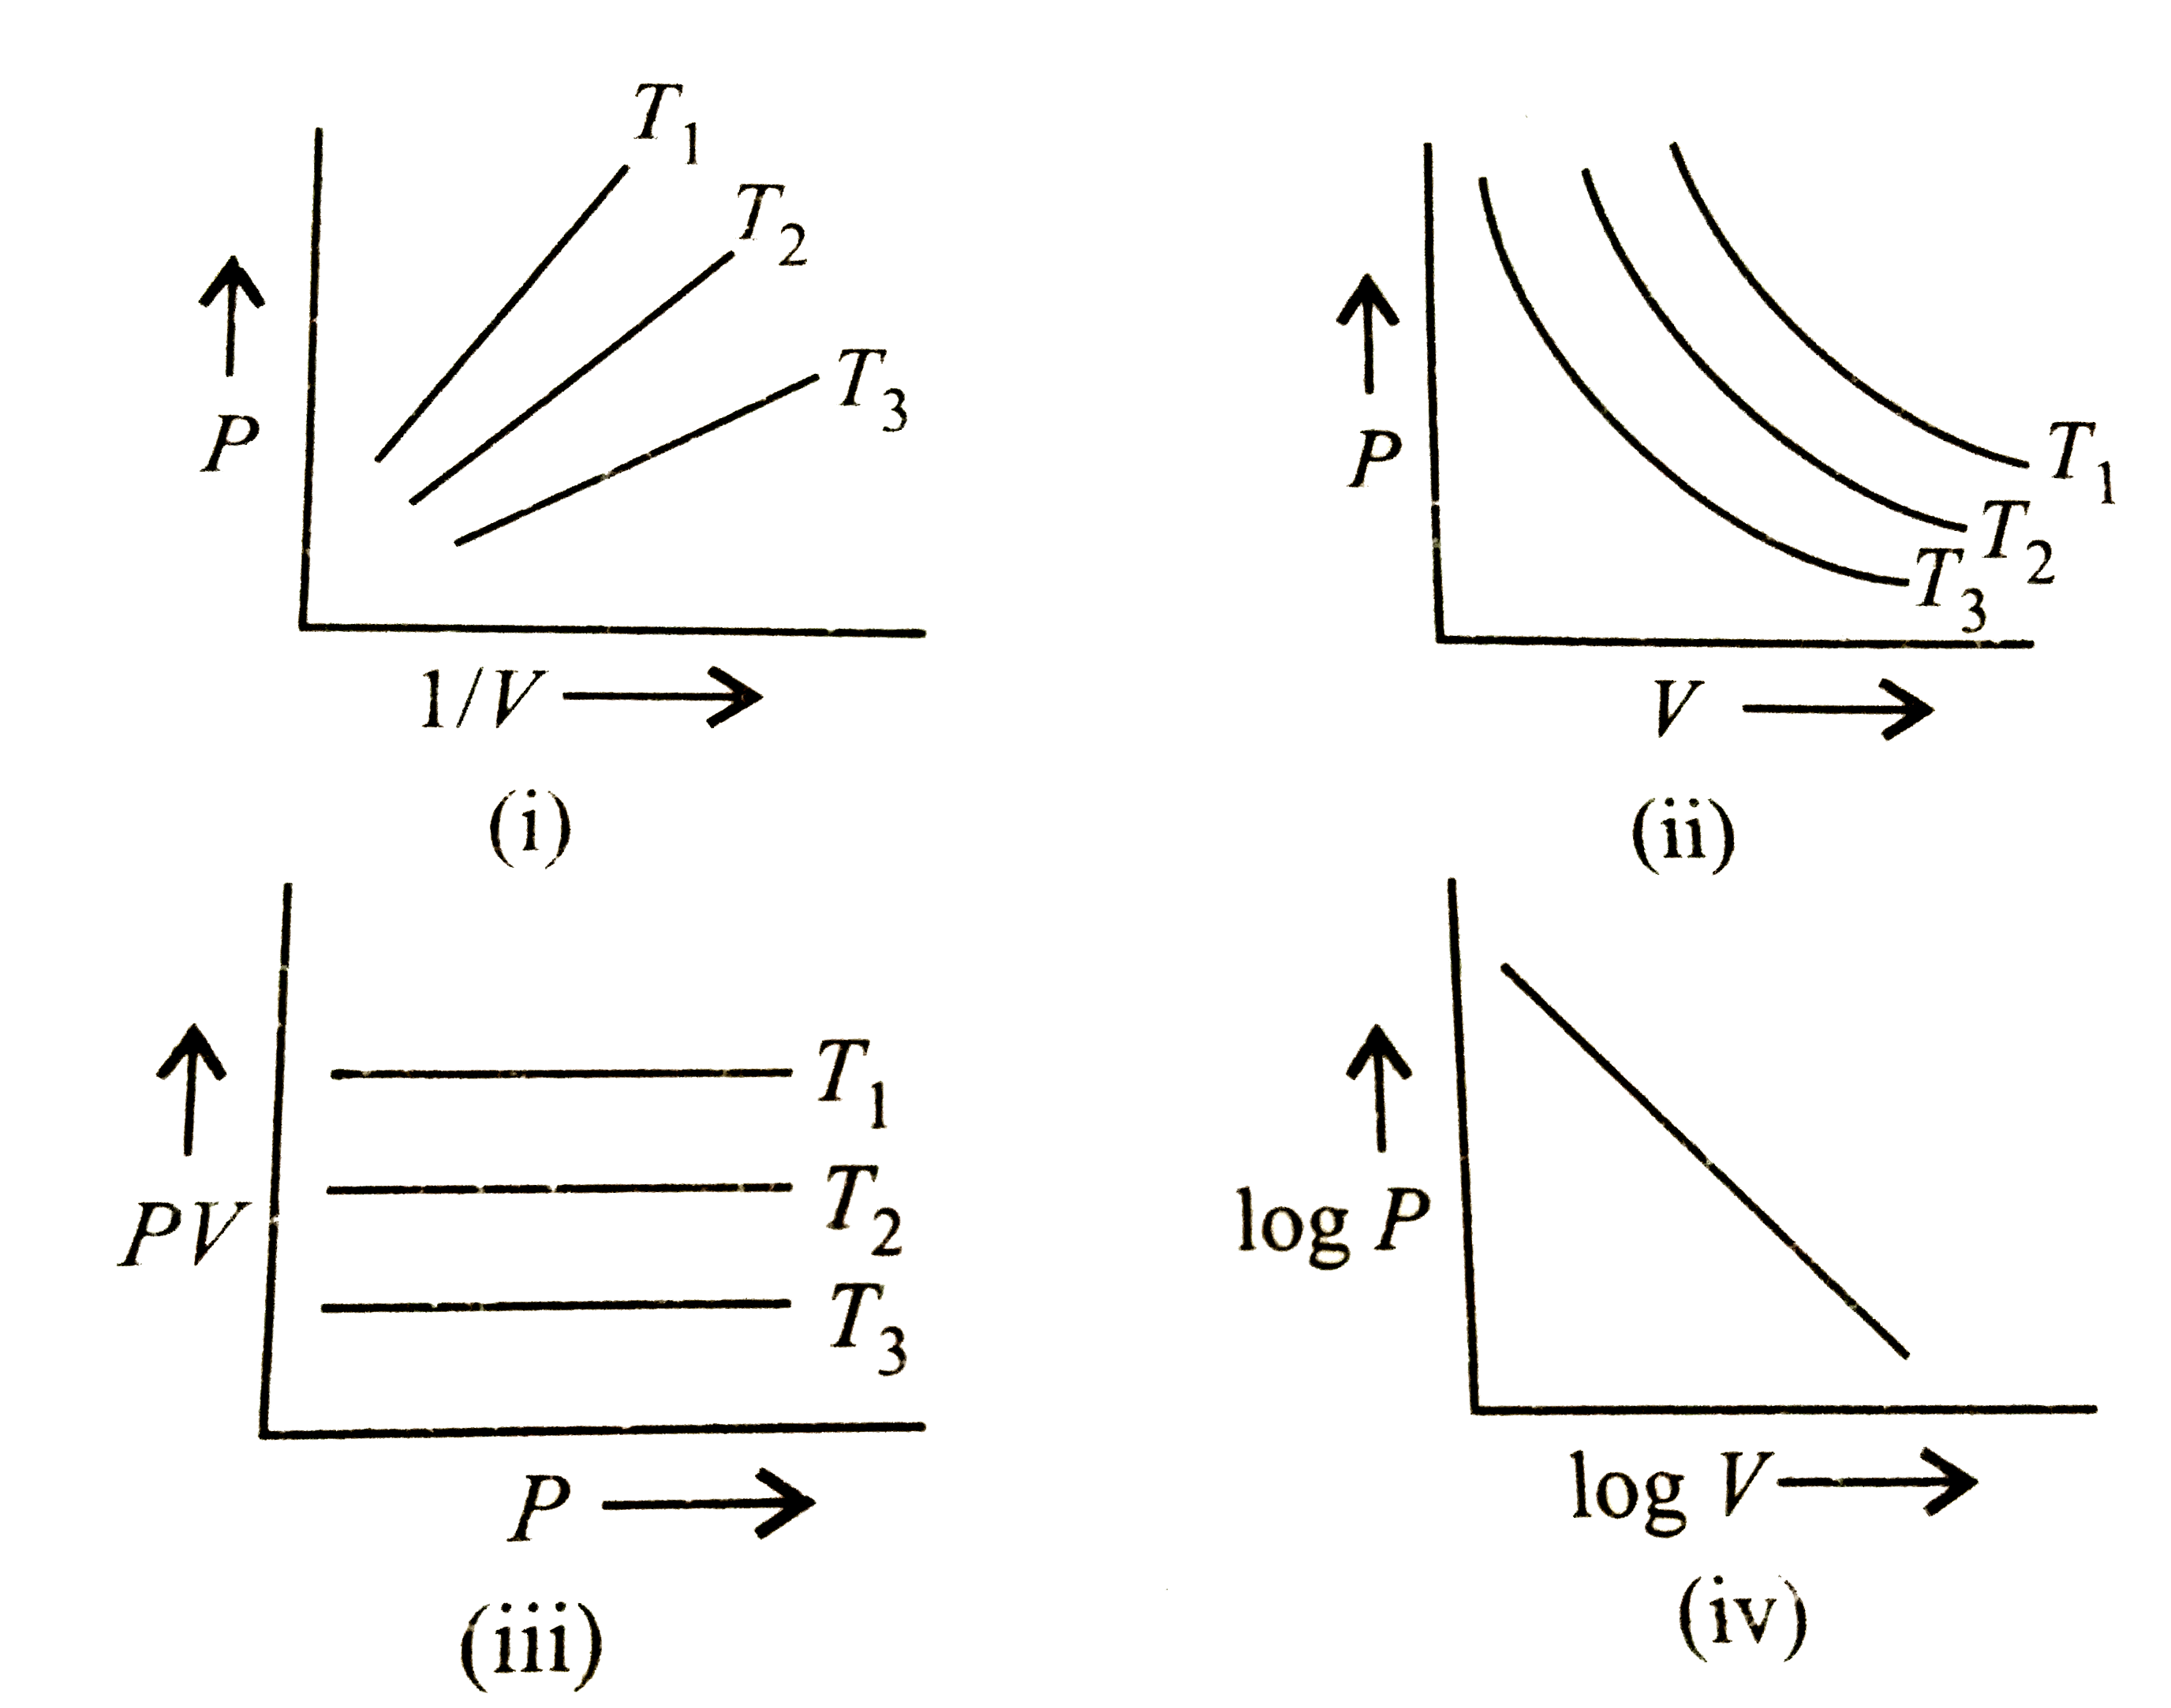
Only (ii) is correct representation of Boyle's law .
Only (iv) is correct representations of Boyle's law .
All are correct representations of Boyle's law.
None of these representations is correct for Boyle's law.
The correct Answer is:C
Step by step video & image solution for Graphs between pressure and volume are plotted at different temperatures . Which of the following isotherms represents Boyle's law as PV = constant ? (T_(1) gt T_(2) gt T_(3)) by Chemistry experts to help you in doubts & scoring excellent marks in Class 11 exams.
Updated on:21/07/2023Topper's Solved these Questions
- STATES OF MATTER BOOK - NCERT FINGERTPS ENGLISHCHAPTER - STATES OF MATTER EXERCISE - Ideal Gas Equation
33 Videos
- STATES OF MATTER BOOK - NCERT FINGERTPS ENGLISHCHAPTER - STATES OF MATTER EXERCISE - Kinetic Energy And Molecular Speeds
4 Videos
- STATES OF MATTER BOOK - NCERT FINGERTPS ENGLISHCHAPTER - STATES OF MATTER EXERCISE - The Gaseous State
1 Videos
- SOME BASIC CONCEPTS OF CHEMISTRY BOOK - NCERT FINGERTPS ENGLISHCHAPTER - SOME BASIC CONCEPTS OF CHEMISTRY EXERCISE - NCERT Exemplar
11 Videos
- STRUCTURE OF ATOM BOOK - NCERT FINGERTPS ENGLISHCHAPTER - STRUCTURE OF ATOM EXERCISE - Assertion And Reason
15 Videos
Similar Questions
Knowledge Check
If P,V,andT represent pressure, volume and temperature of the gas, the correct representation of Boyle's law is
AV∝1T (P constant)BV∝1P (T constant)CPV = RTDPV = nRTThe gas law (PV/T) = constant is true for
Aisothermal changes onlyBadiabatic changeCboth isothermal and adiabaticDneither isothermal nor adiabatic
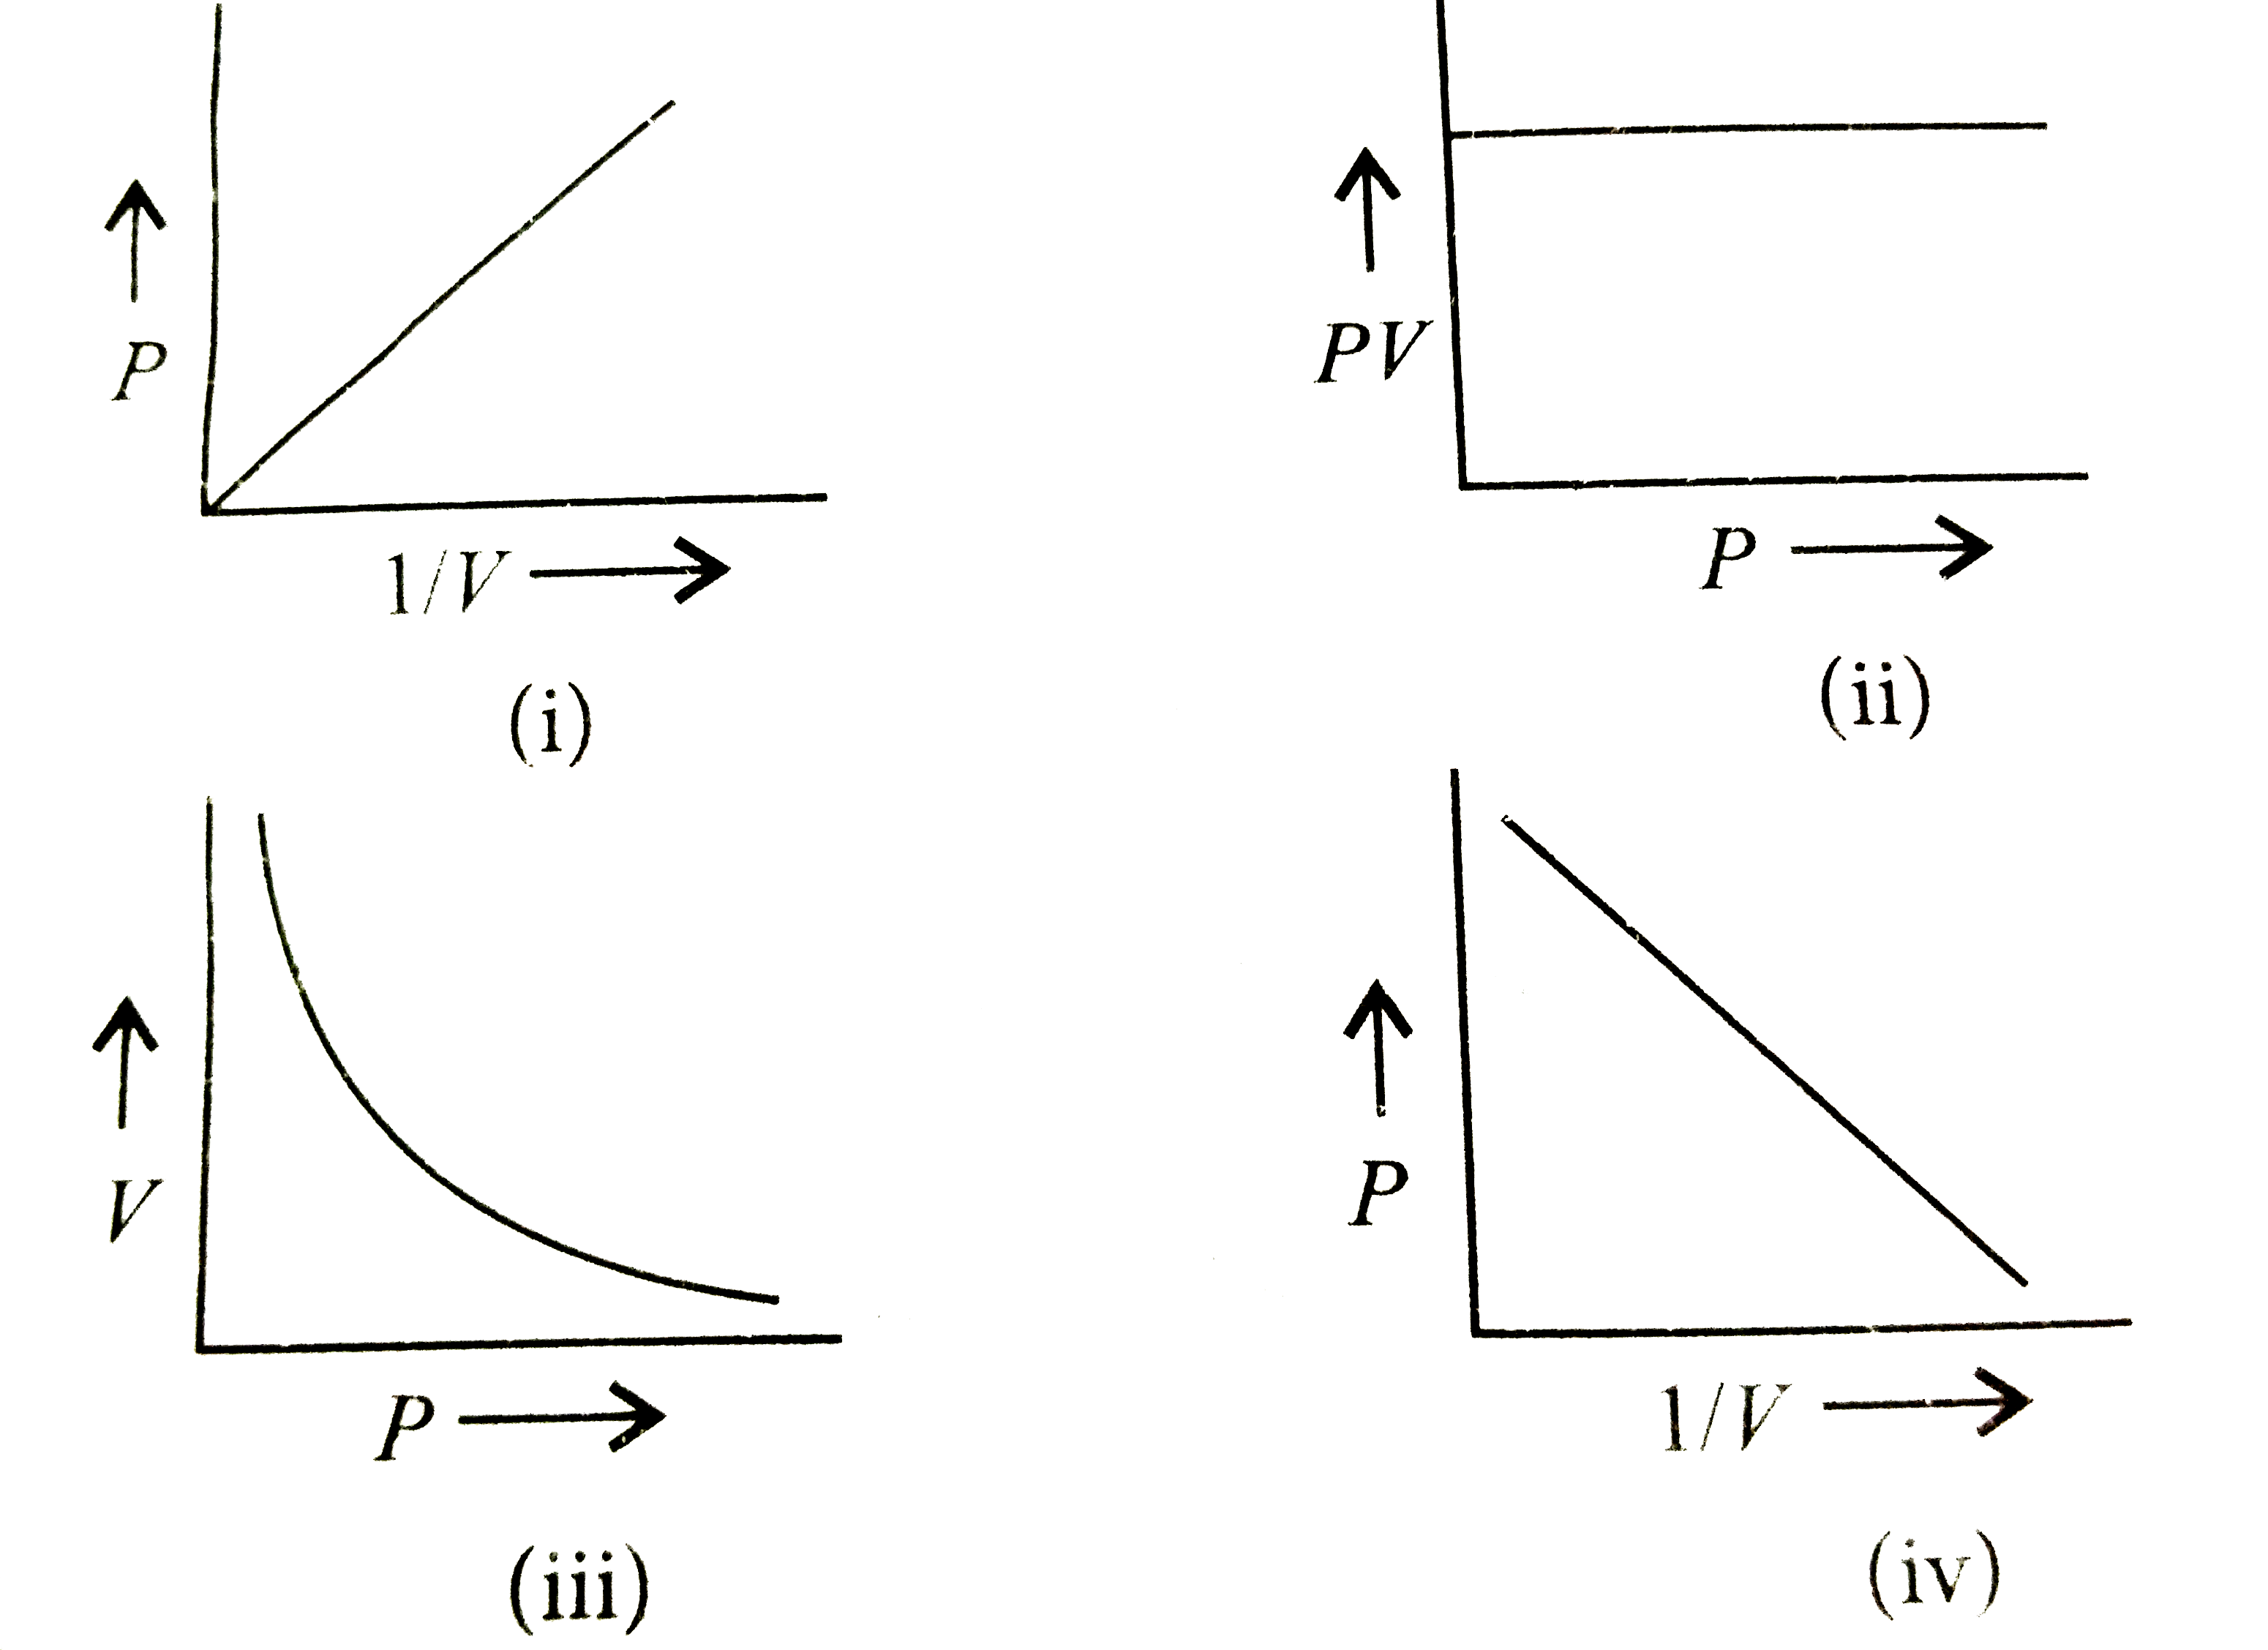
Which of the following graphs represents the correct Boyle's law ?
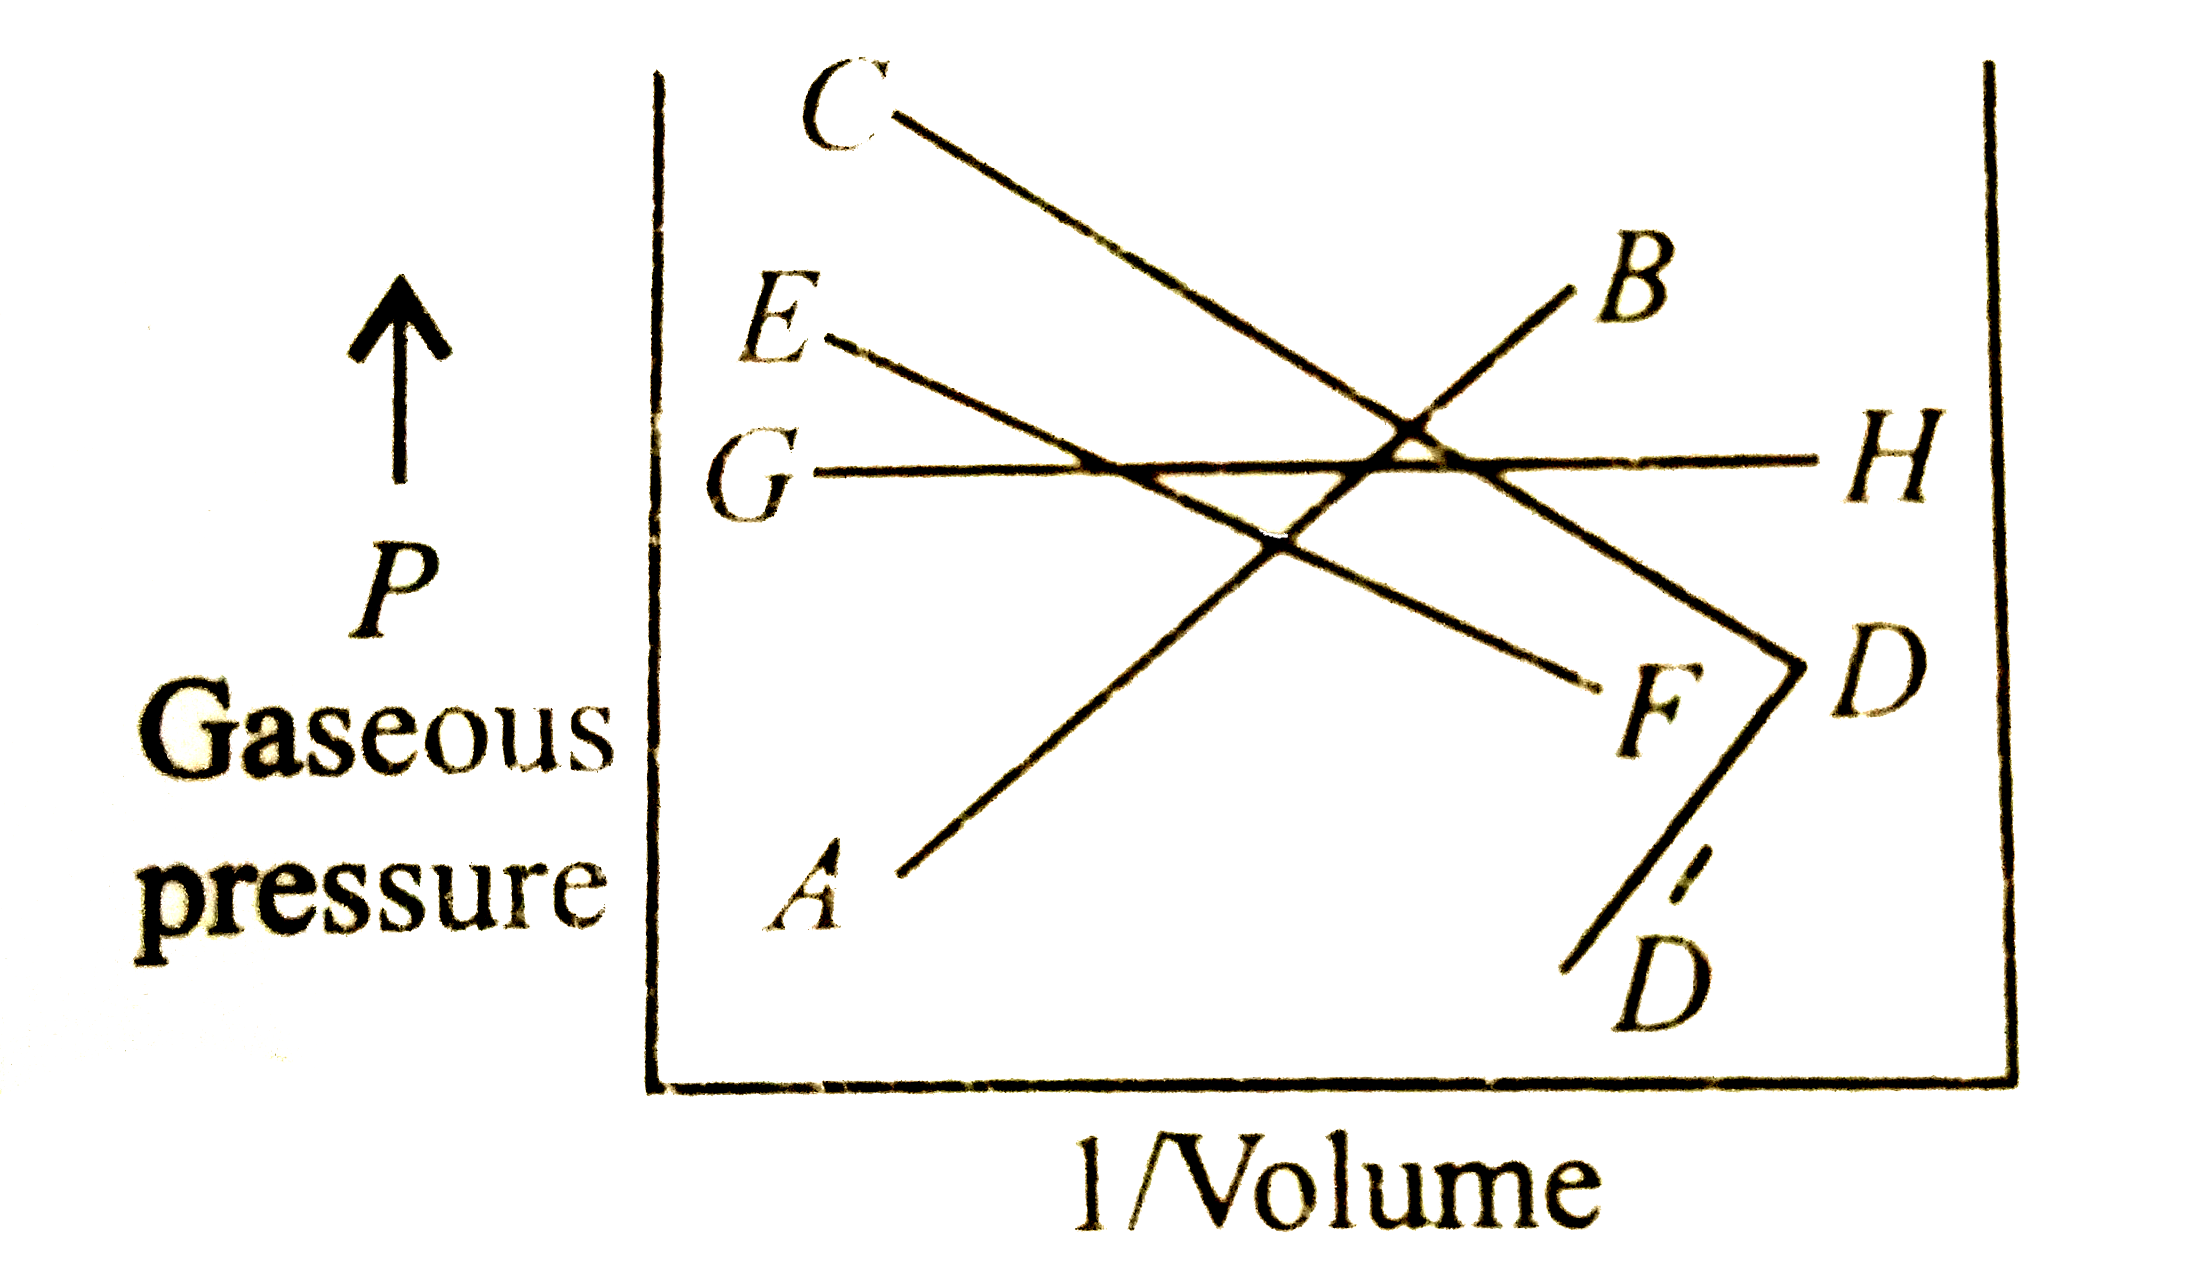
View SolutionWhich one of the given pressure versus volume plots represents Boyle's law ?
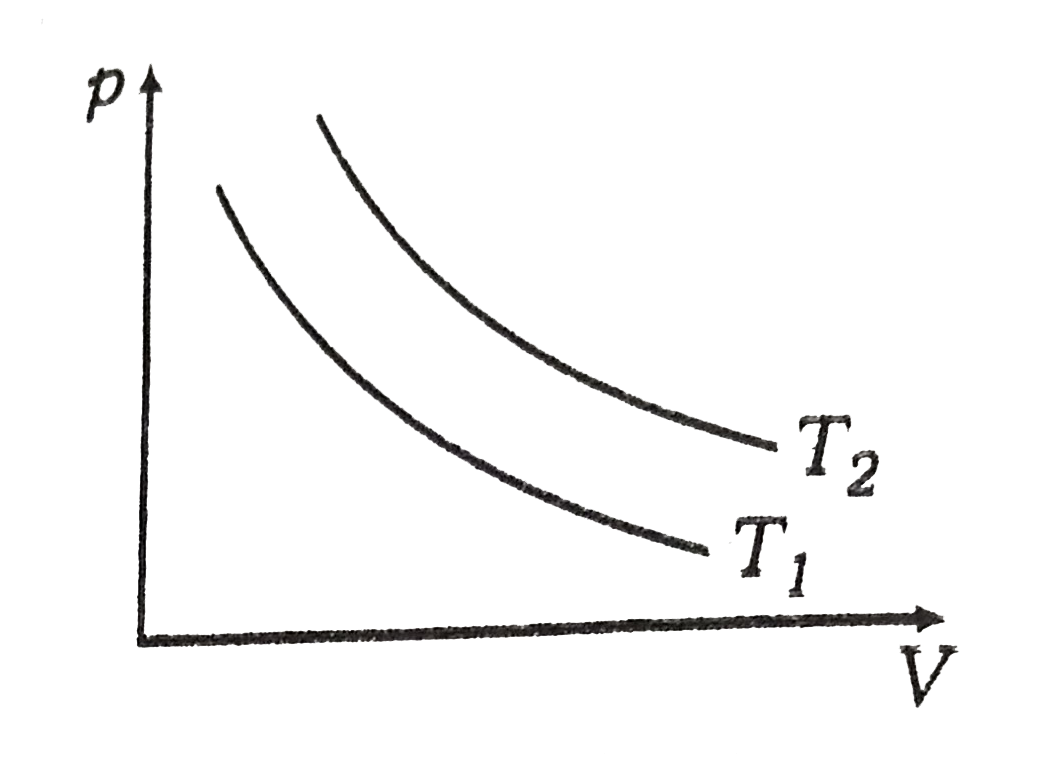
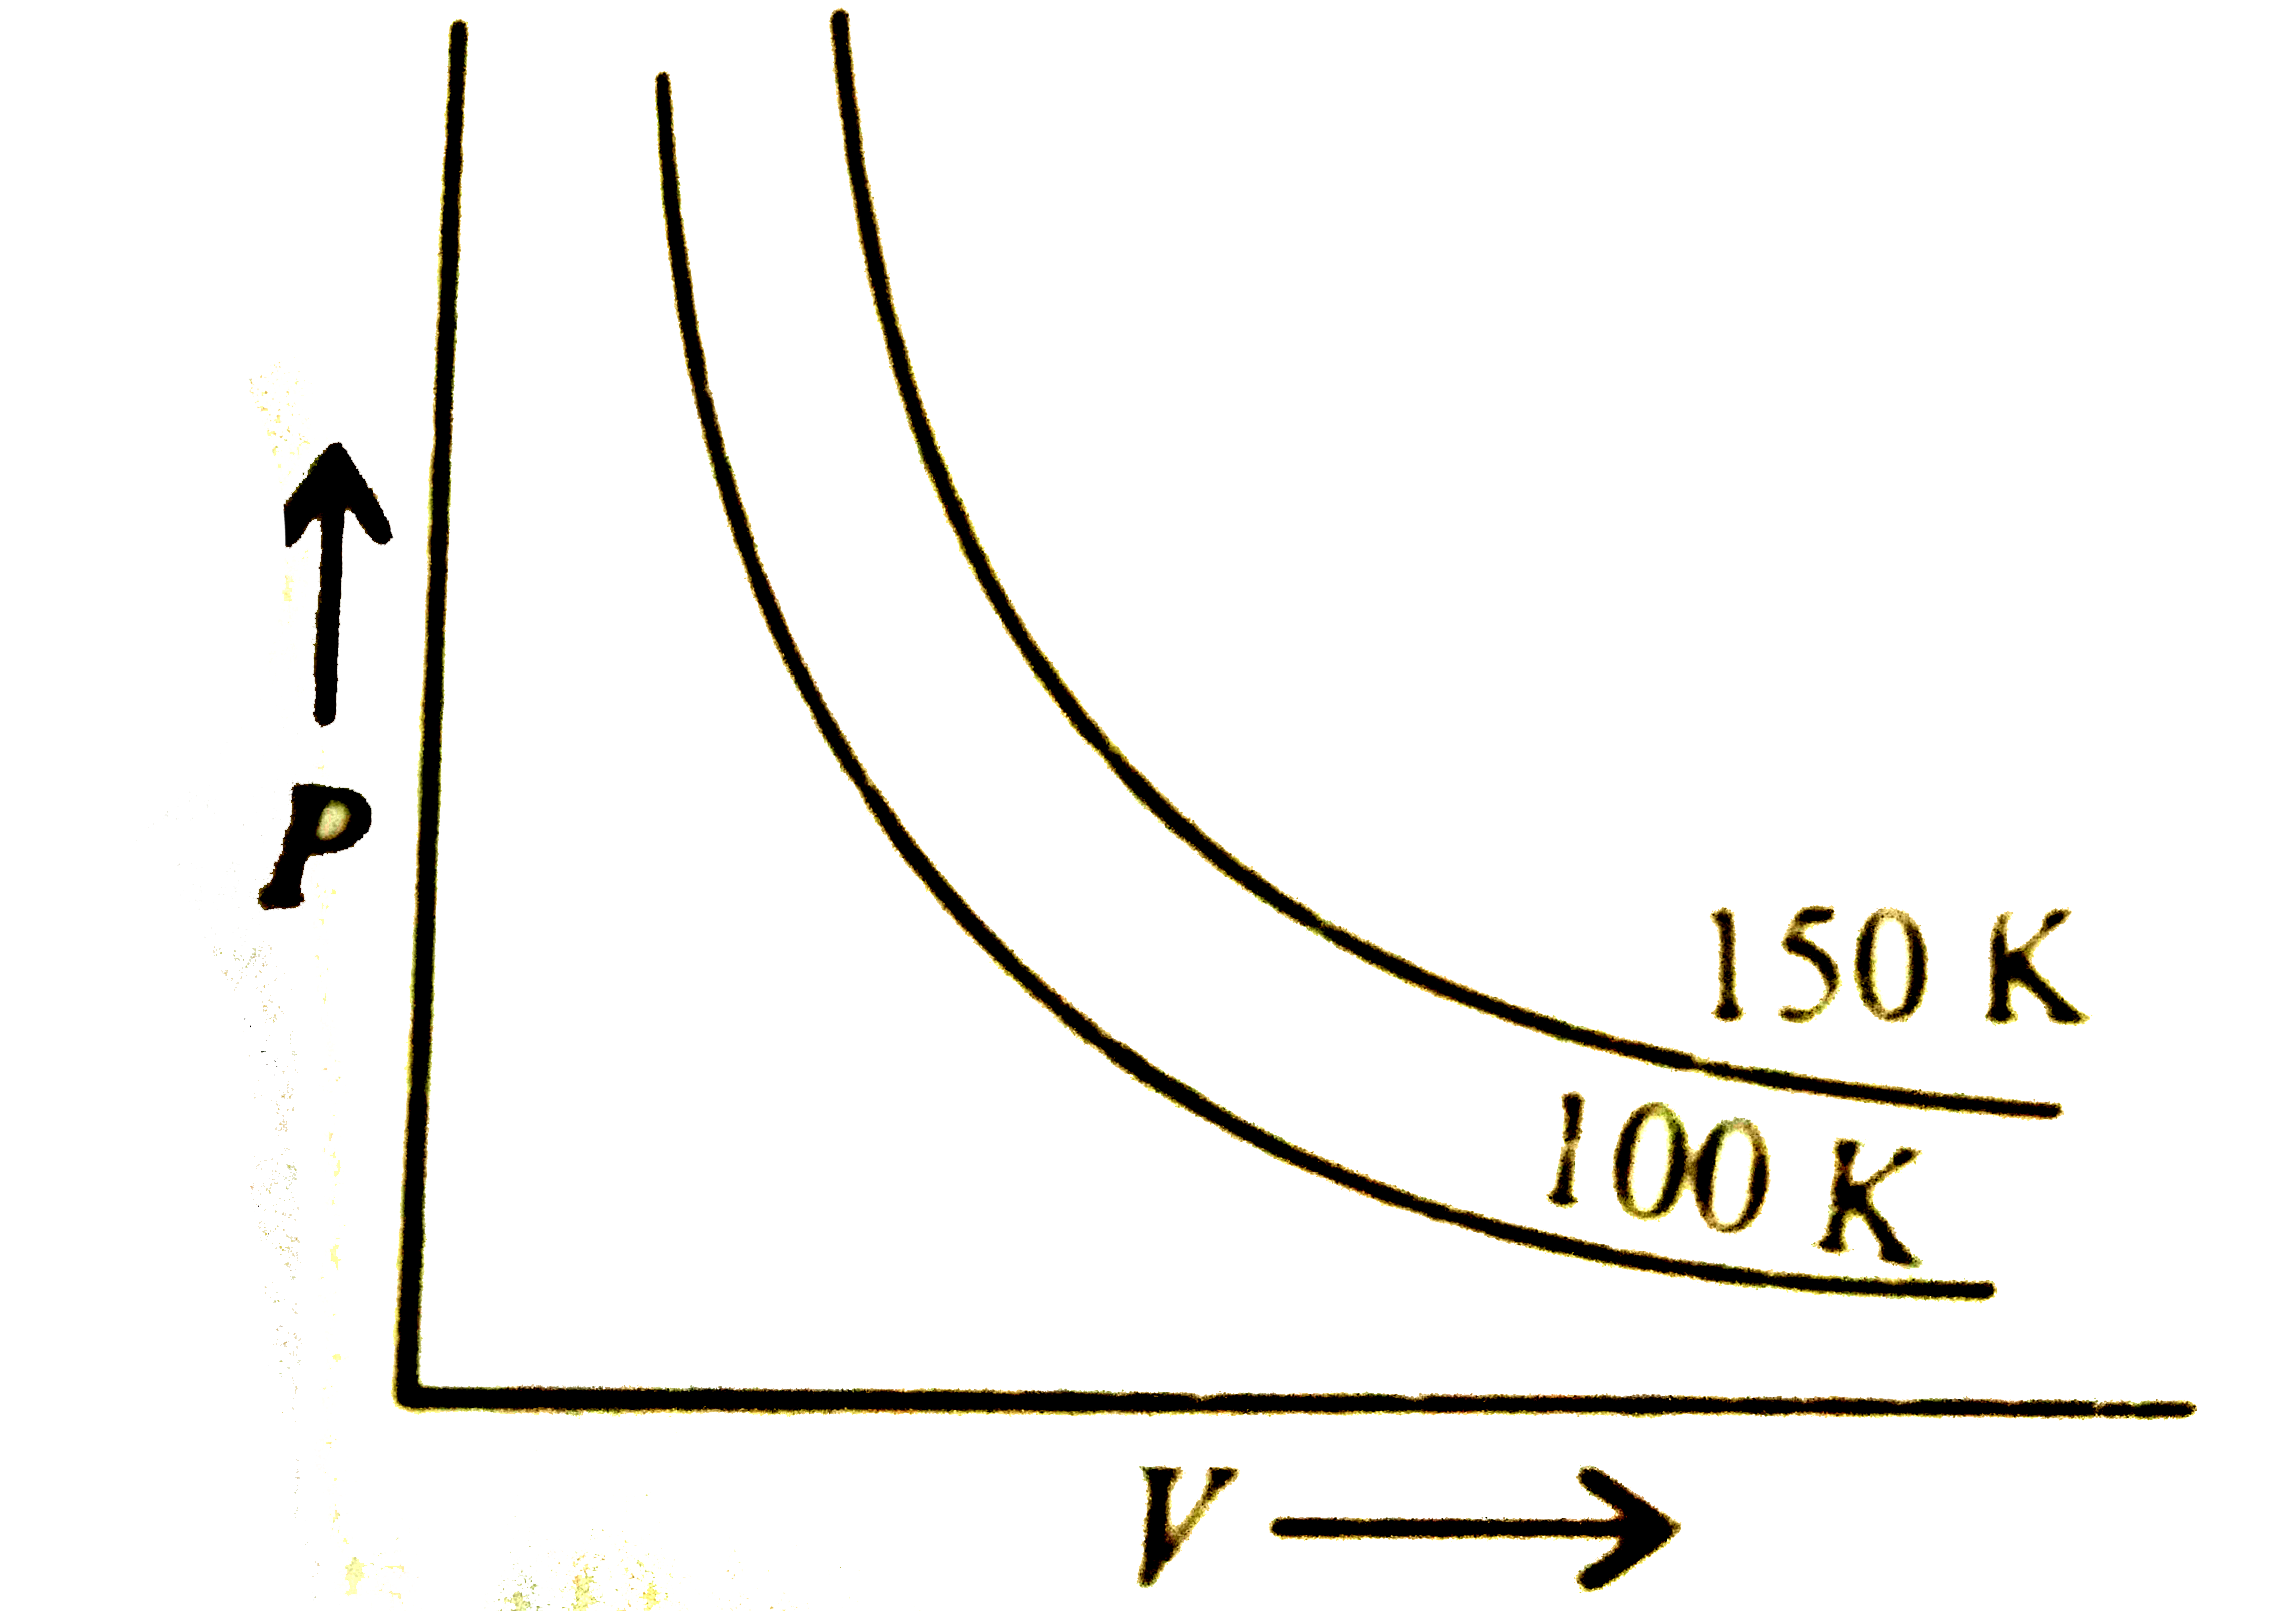
View SolutionThe adjoining fgure shows graph of pressure and volume of a gas at two temperatures T1 and T2 Which one the following is correct
View Solutionfor the given PV isotherms , which of the following is correct for T1,T2,T3 ?
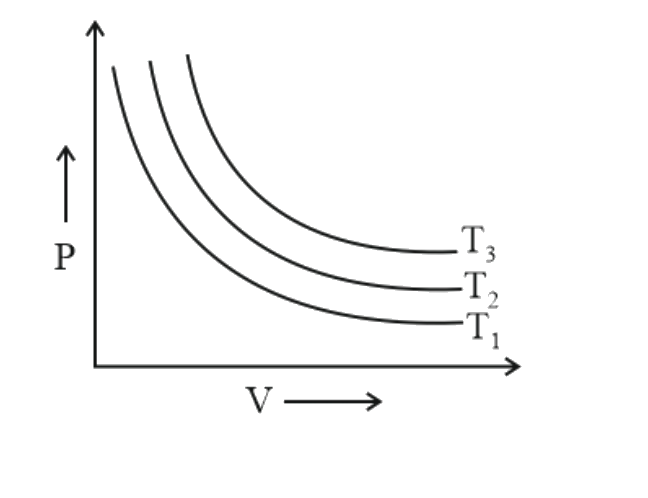
View SolutionA graph is plotted between pressure and volume at different temperatures . On the basis of the graph what changes will you observe in the volume if
(i) the pressure is increased at constant temperature .
(ii) the temperature is decreased at constant pressure .
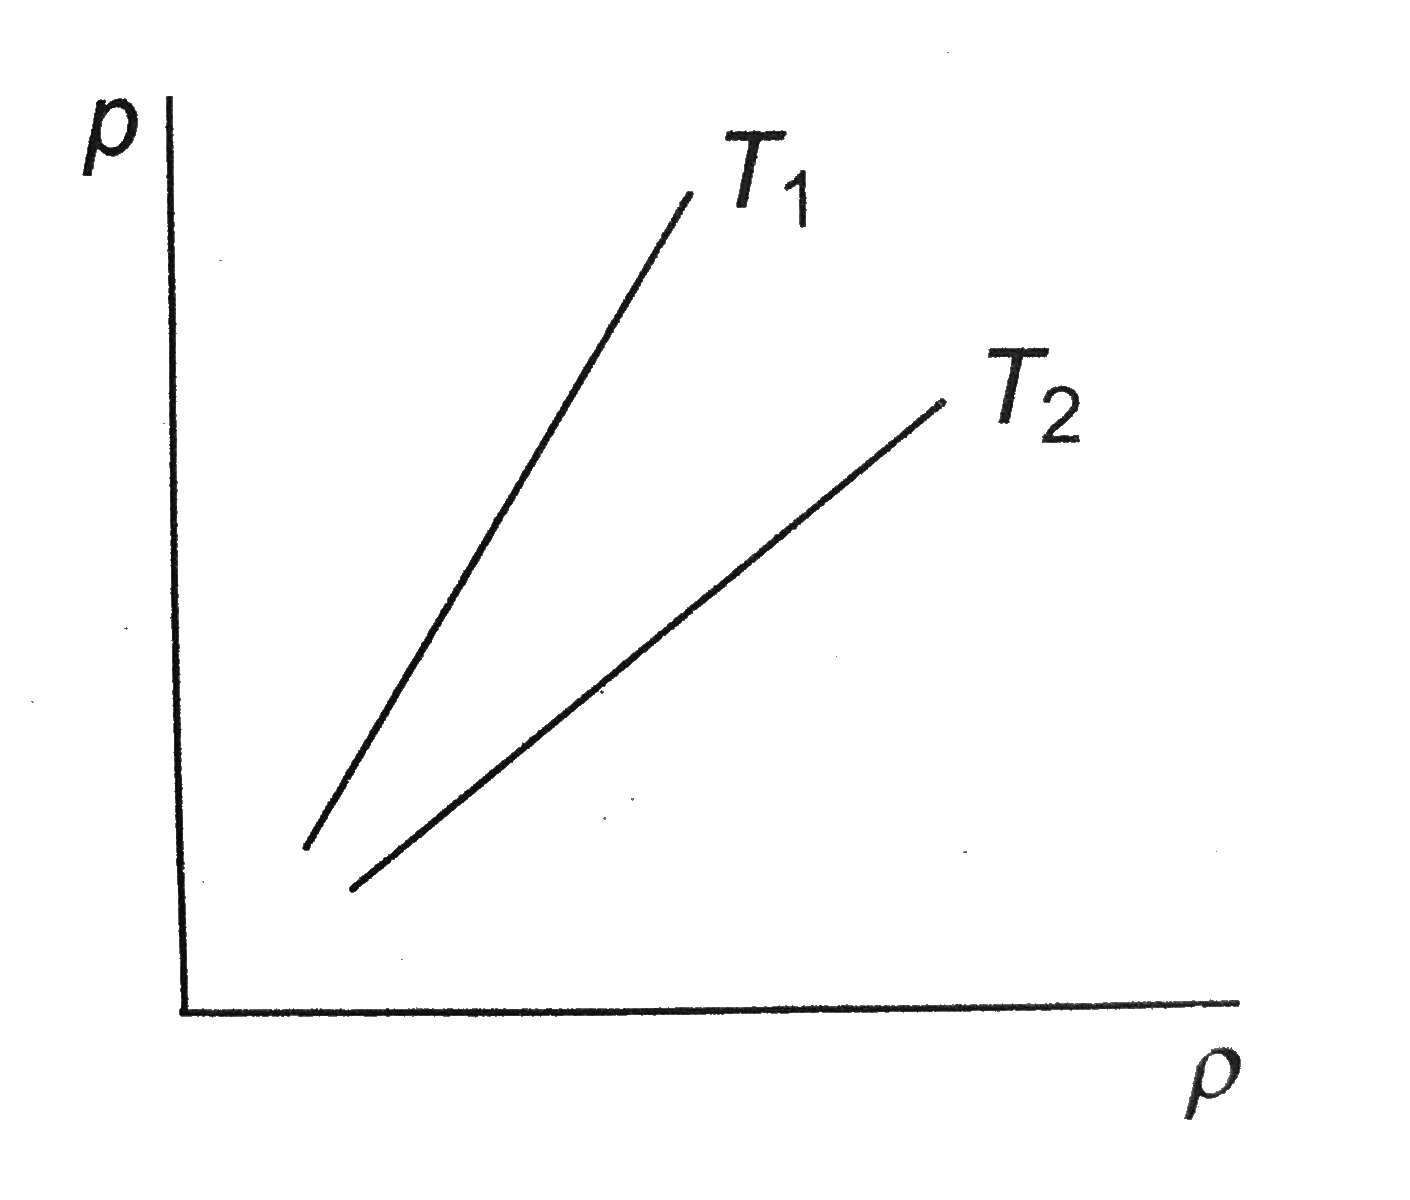
View SolutionFigure shows graphs of pressure vs density for an ideal gas at two temperature T1andT2. Which of the following is correct?
View Solution
