(a) Draw graph showing the variation of current versus voltage in an electroyte when an external resistance is also connceted.
(b) (i) The graph between resistance (R ) and temperature (T) for Hg is shown in the figure (a). Explain the behaviour of Hg near 4k.
(ii) In which region of the graph shown in the figure (b) is the resistance negative and why?

Step by step video & image solution for (a) Draw graph showing the variation of current versus voltage in an electroyte when an external resistance is also connceted. (b) (i) The graph between resistance (R ) and temperature (T) for Hg is shown in the figure (a). Explain the behaviour of Hg near 4k. (ii) In which region of the graph shown in the figure (b) is the resistance negative and why? by Physics experts to help you in doubts & scoring excellent marks in Class 12 exams.
Updated on:21/07/2023Similar Questions
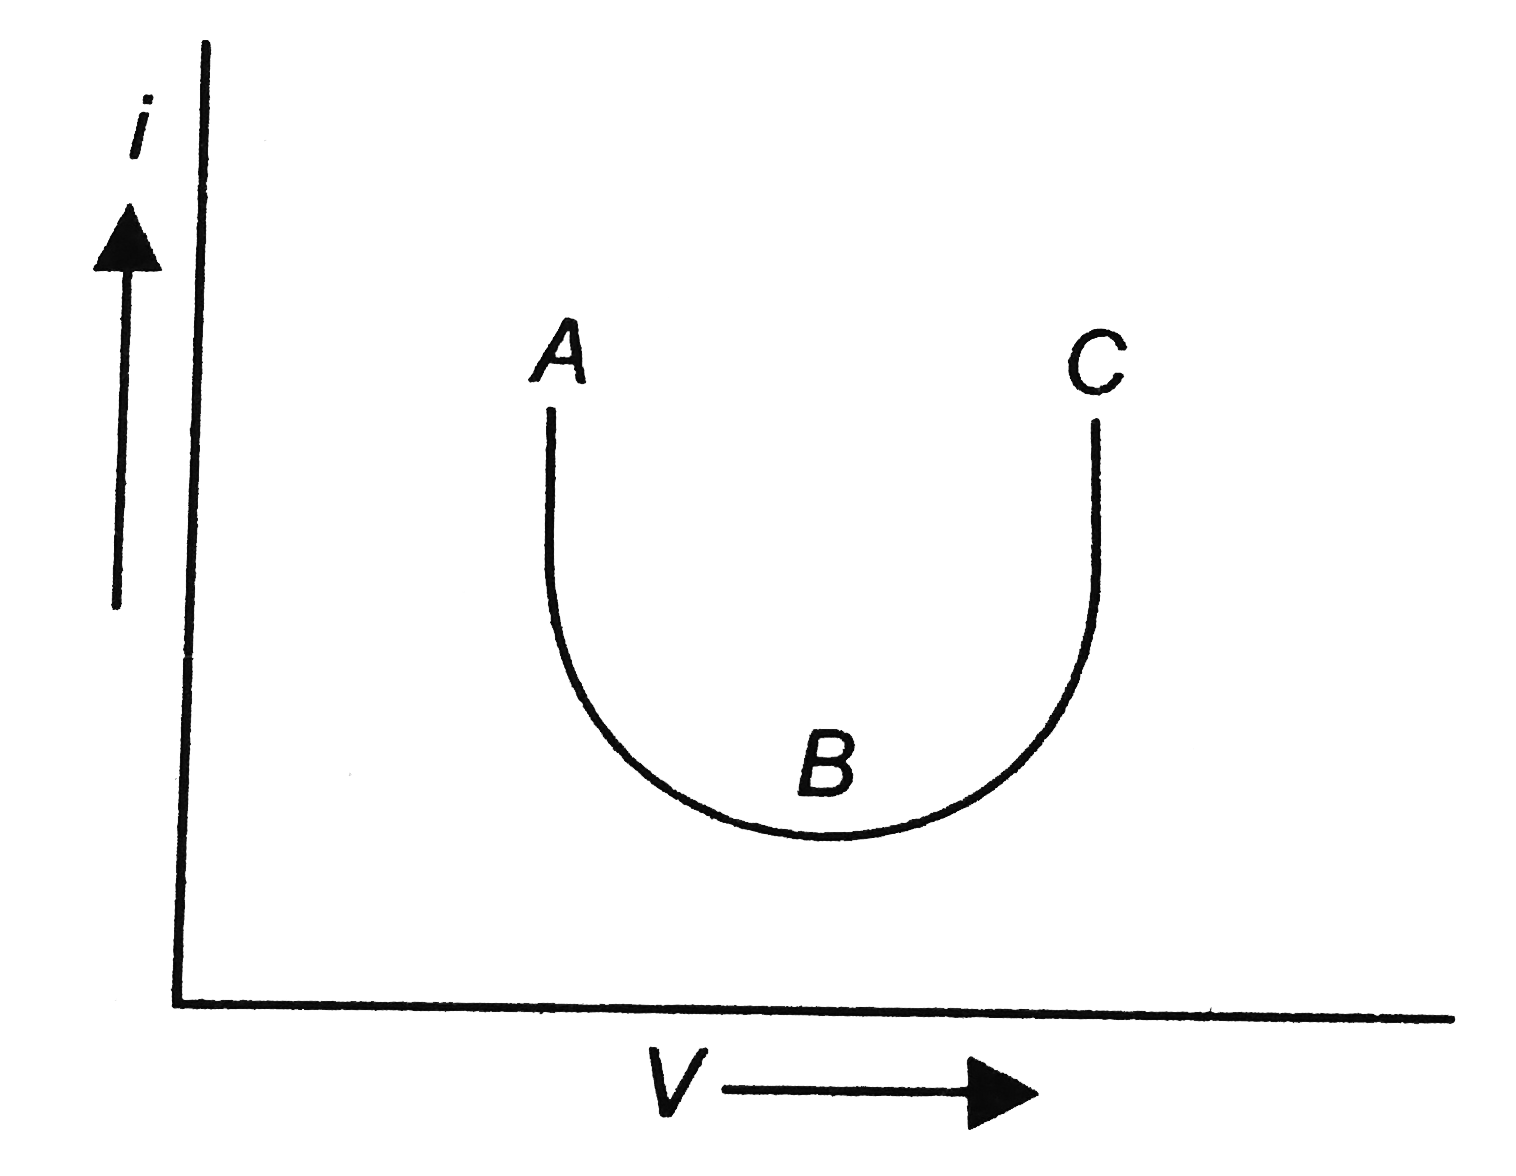
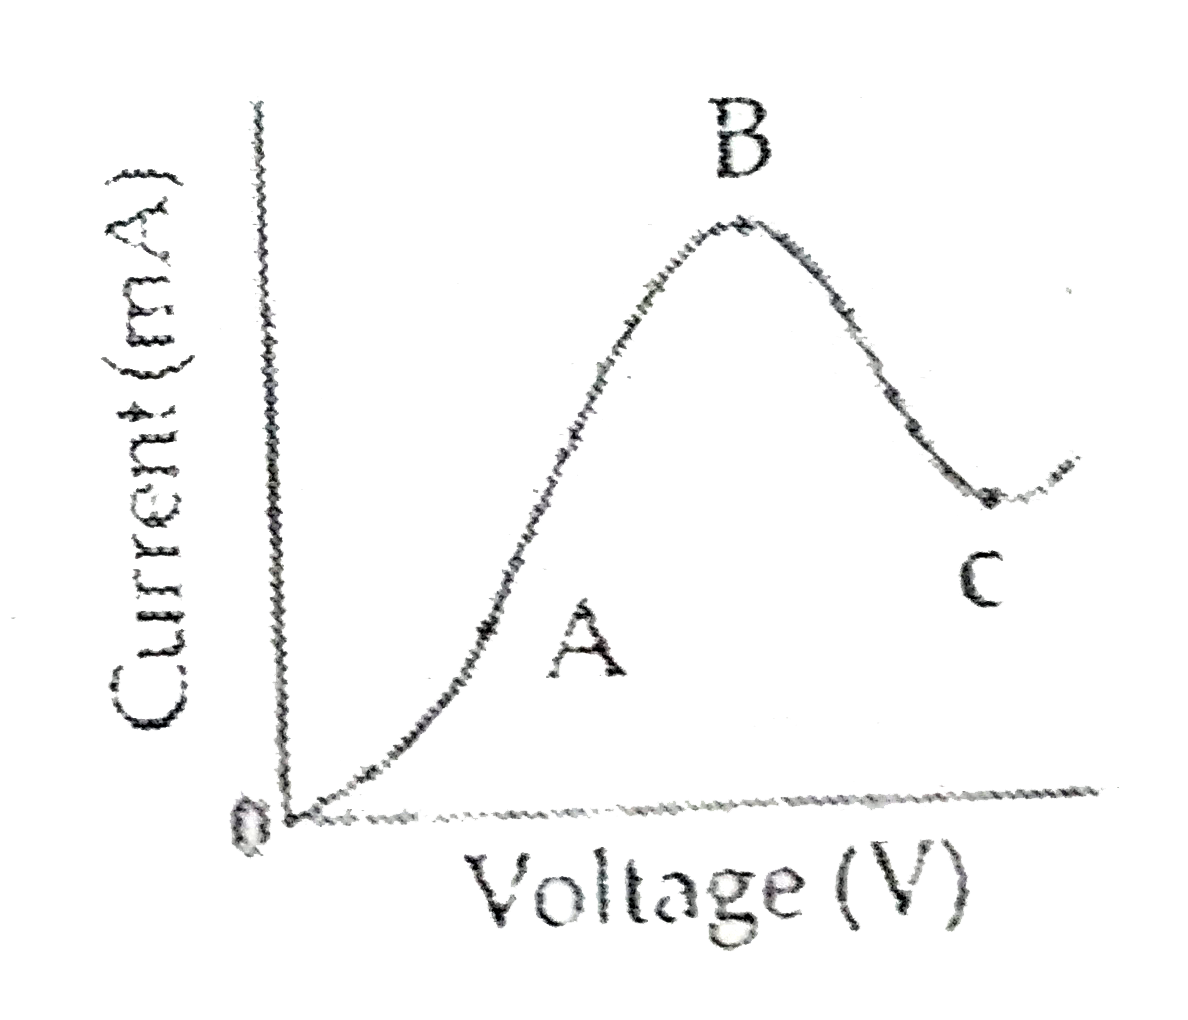
The current-voltage graph of a device is shown in figure. The resistance is negative in region.
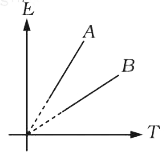
View SolutionThere are two samples A and B, which contains two different gases. Each sample has one mole of a gas. Graph between internal energy (E) and temperature (T) as shown in figure, then:
View Solution
Knowledge Check
An ac source of voltage V=Vmsinωt is connected across the resistance R as shown in figure. The phase relation between current and voltage for this circuit is
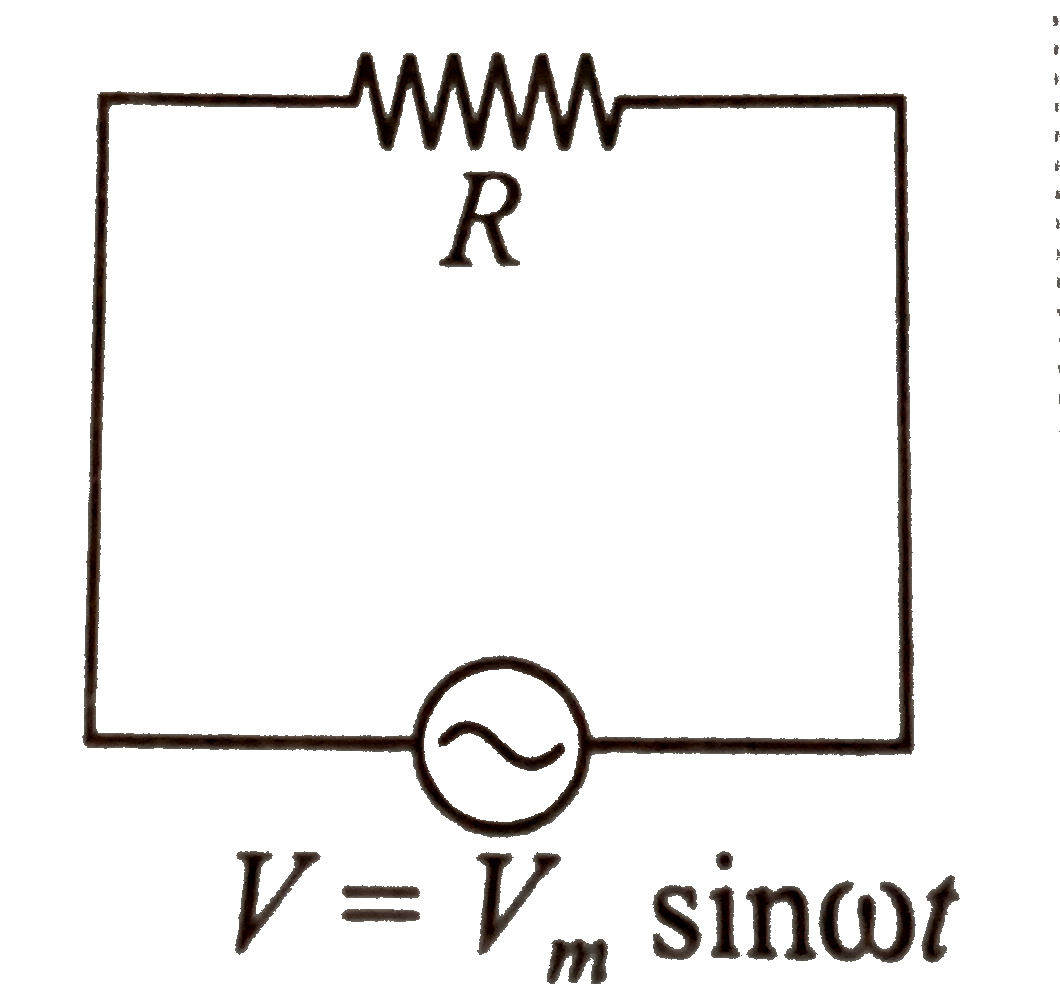 Aboth are in phaseBboth are out of phase by 90∘Cboth are out of phase by 120∘Dboth are out of phase by 180∘
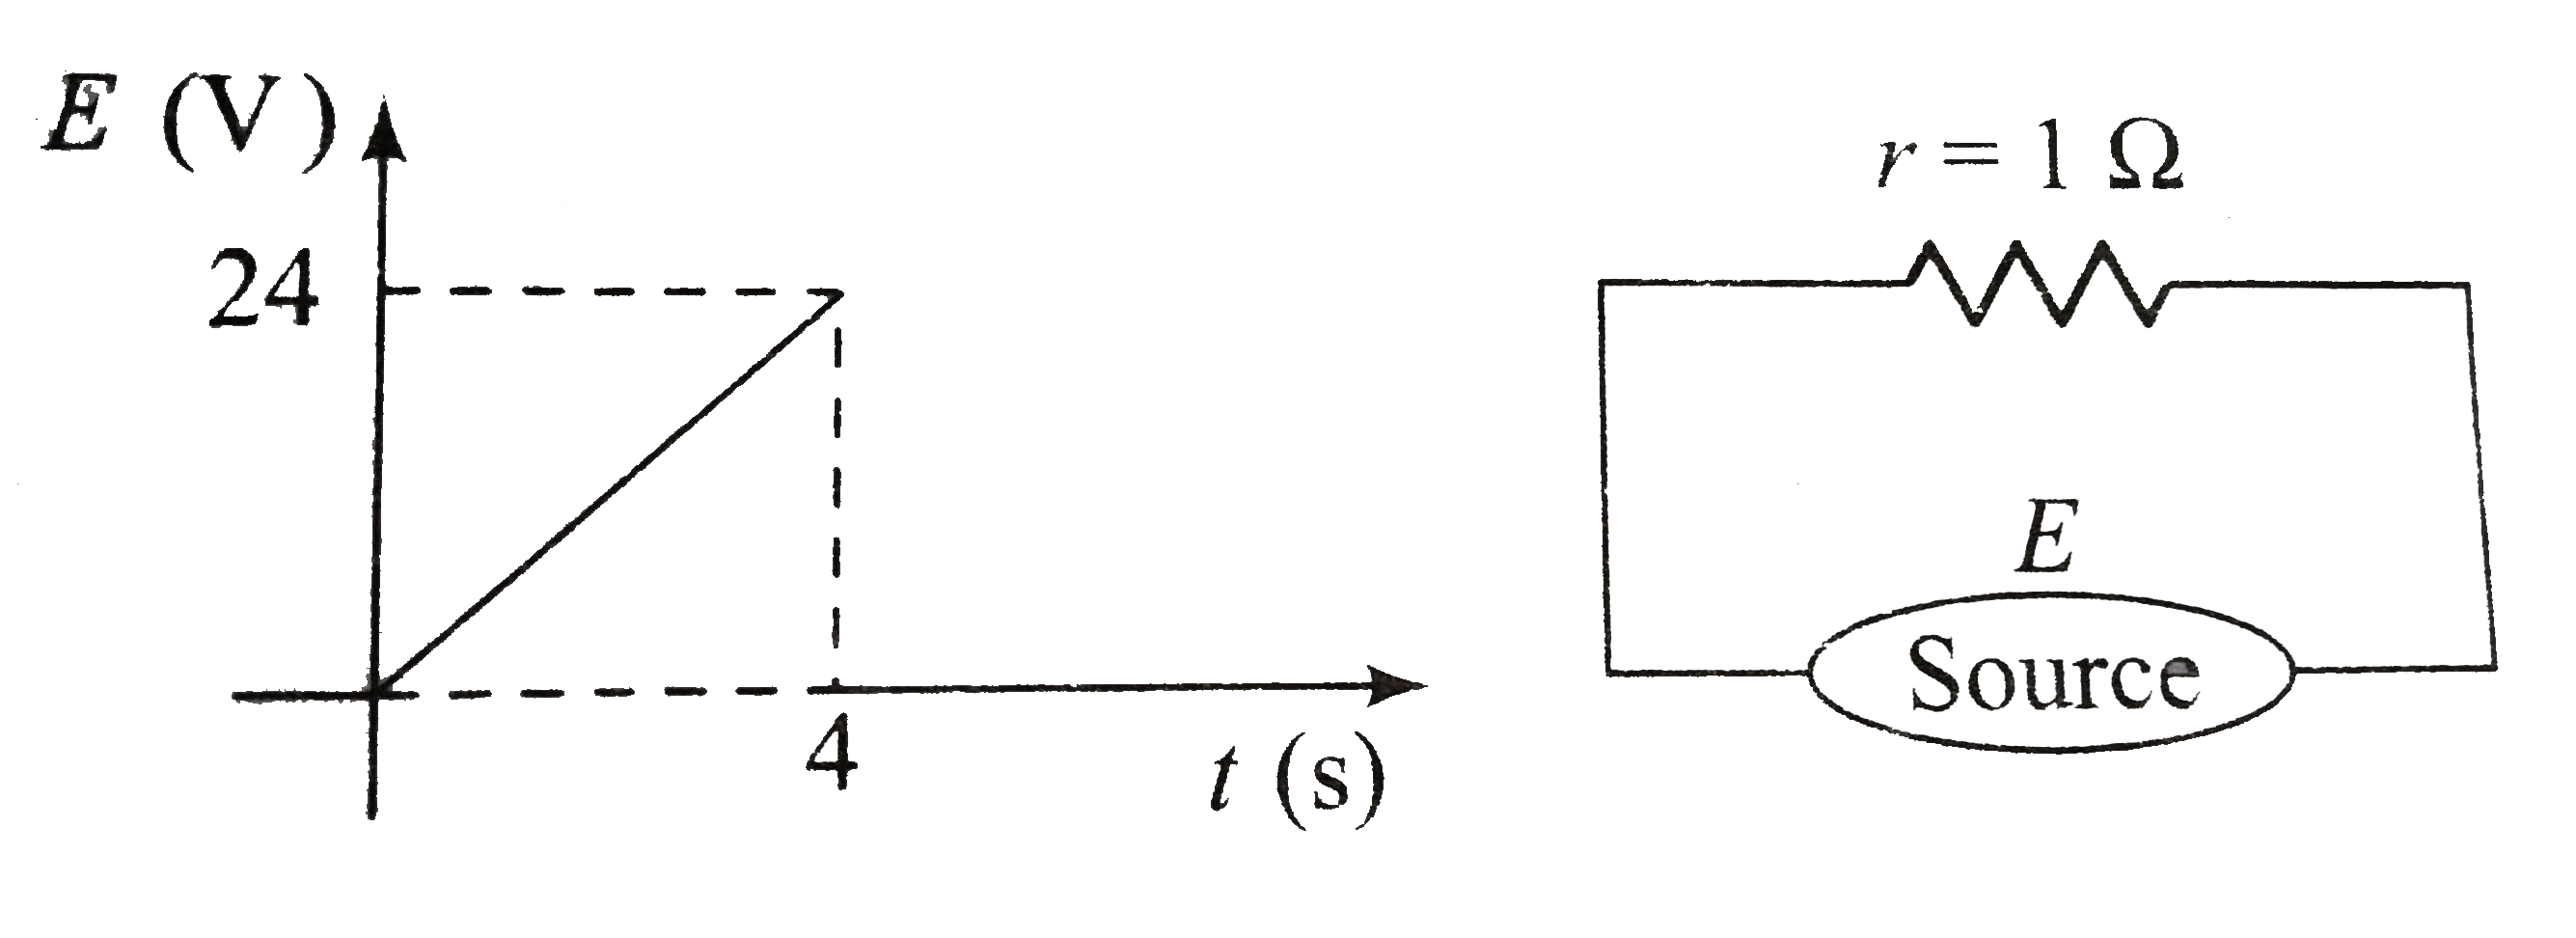
A resistance R=12Ω is connected across a source of emf as shown in the figure. Its emf changes with time as shown in the graph. What is the heat developed in the resistance in the first 4 s. ?
View SolutionThe graph shown in the figure represents a plot of current versus voltage for a given semi-conductor. Identify the region, if any, over which the semicondutor has a negative resistance.
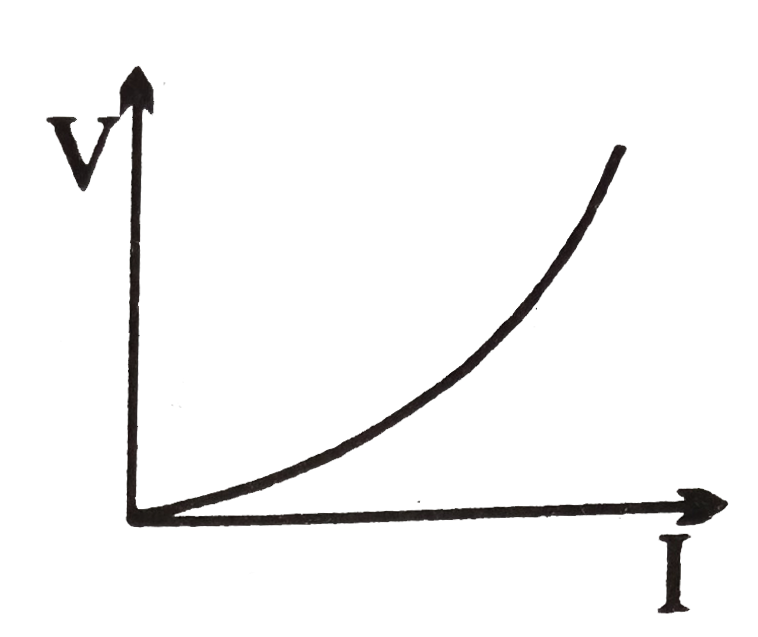
View SolutionThe variation of current (I) and voltage (V) is as shown in figure A. The variation of power P with current I is best shown by which of the following graph
View SolutionA projectile is projected with a velocity u at an angle θ with the horizontal. For a fixed θ, which of the graphs shown in the following figure shows the variation of range R versus u?
View SolutionA cell of emf ε and internal resistance r is connected across a variable resistor R. Plot a graph showing variation of terminal voltage V of the cell versus the current I. Using the plot, show how the emf of the cell and its internal resistance can be determined.
View SolutionI-V graph for a metallie wire at two different tempearture, T1andT2 is as shown in the figure. Which of the two temperatures is lower and why ?

View Solution(i) State the two Kirchhoff's laws, Explain of the briefly how these rules are justified.
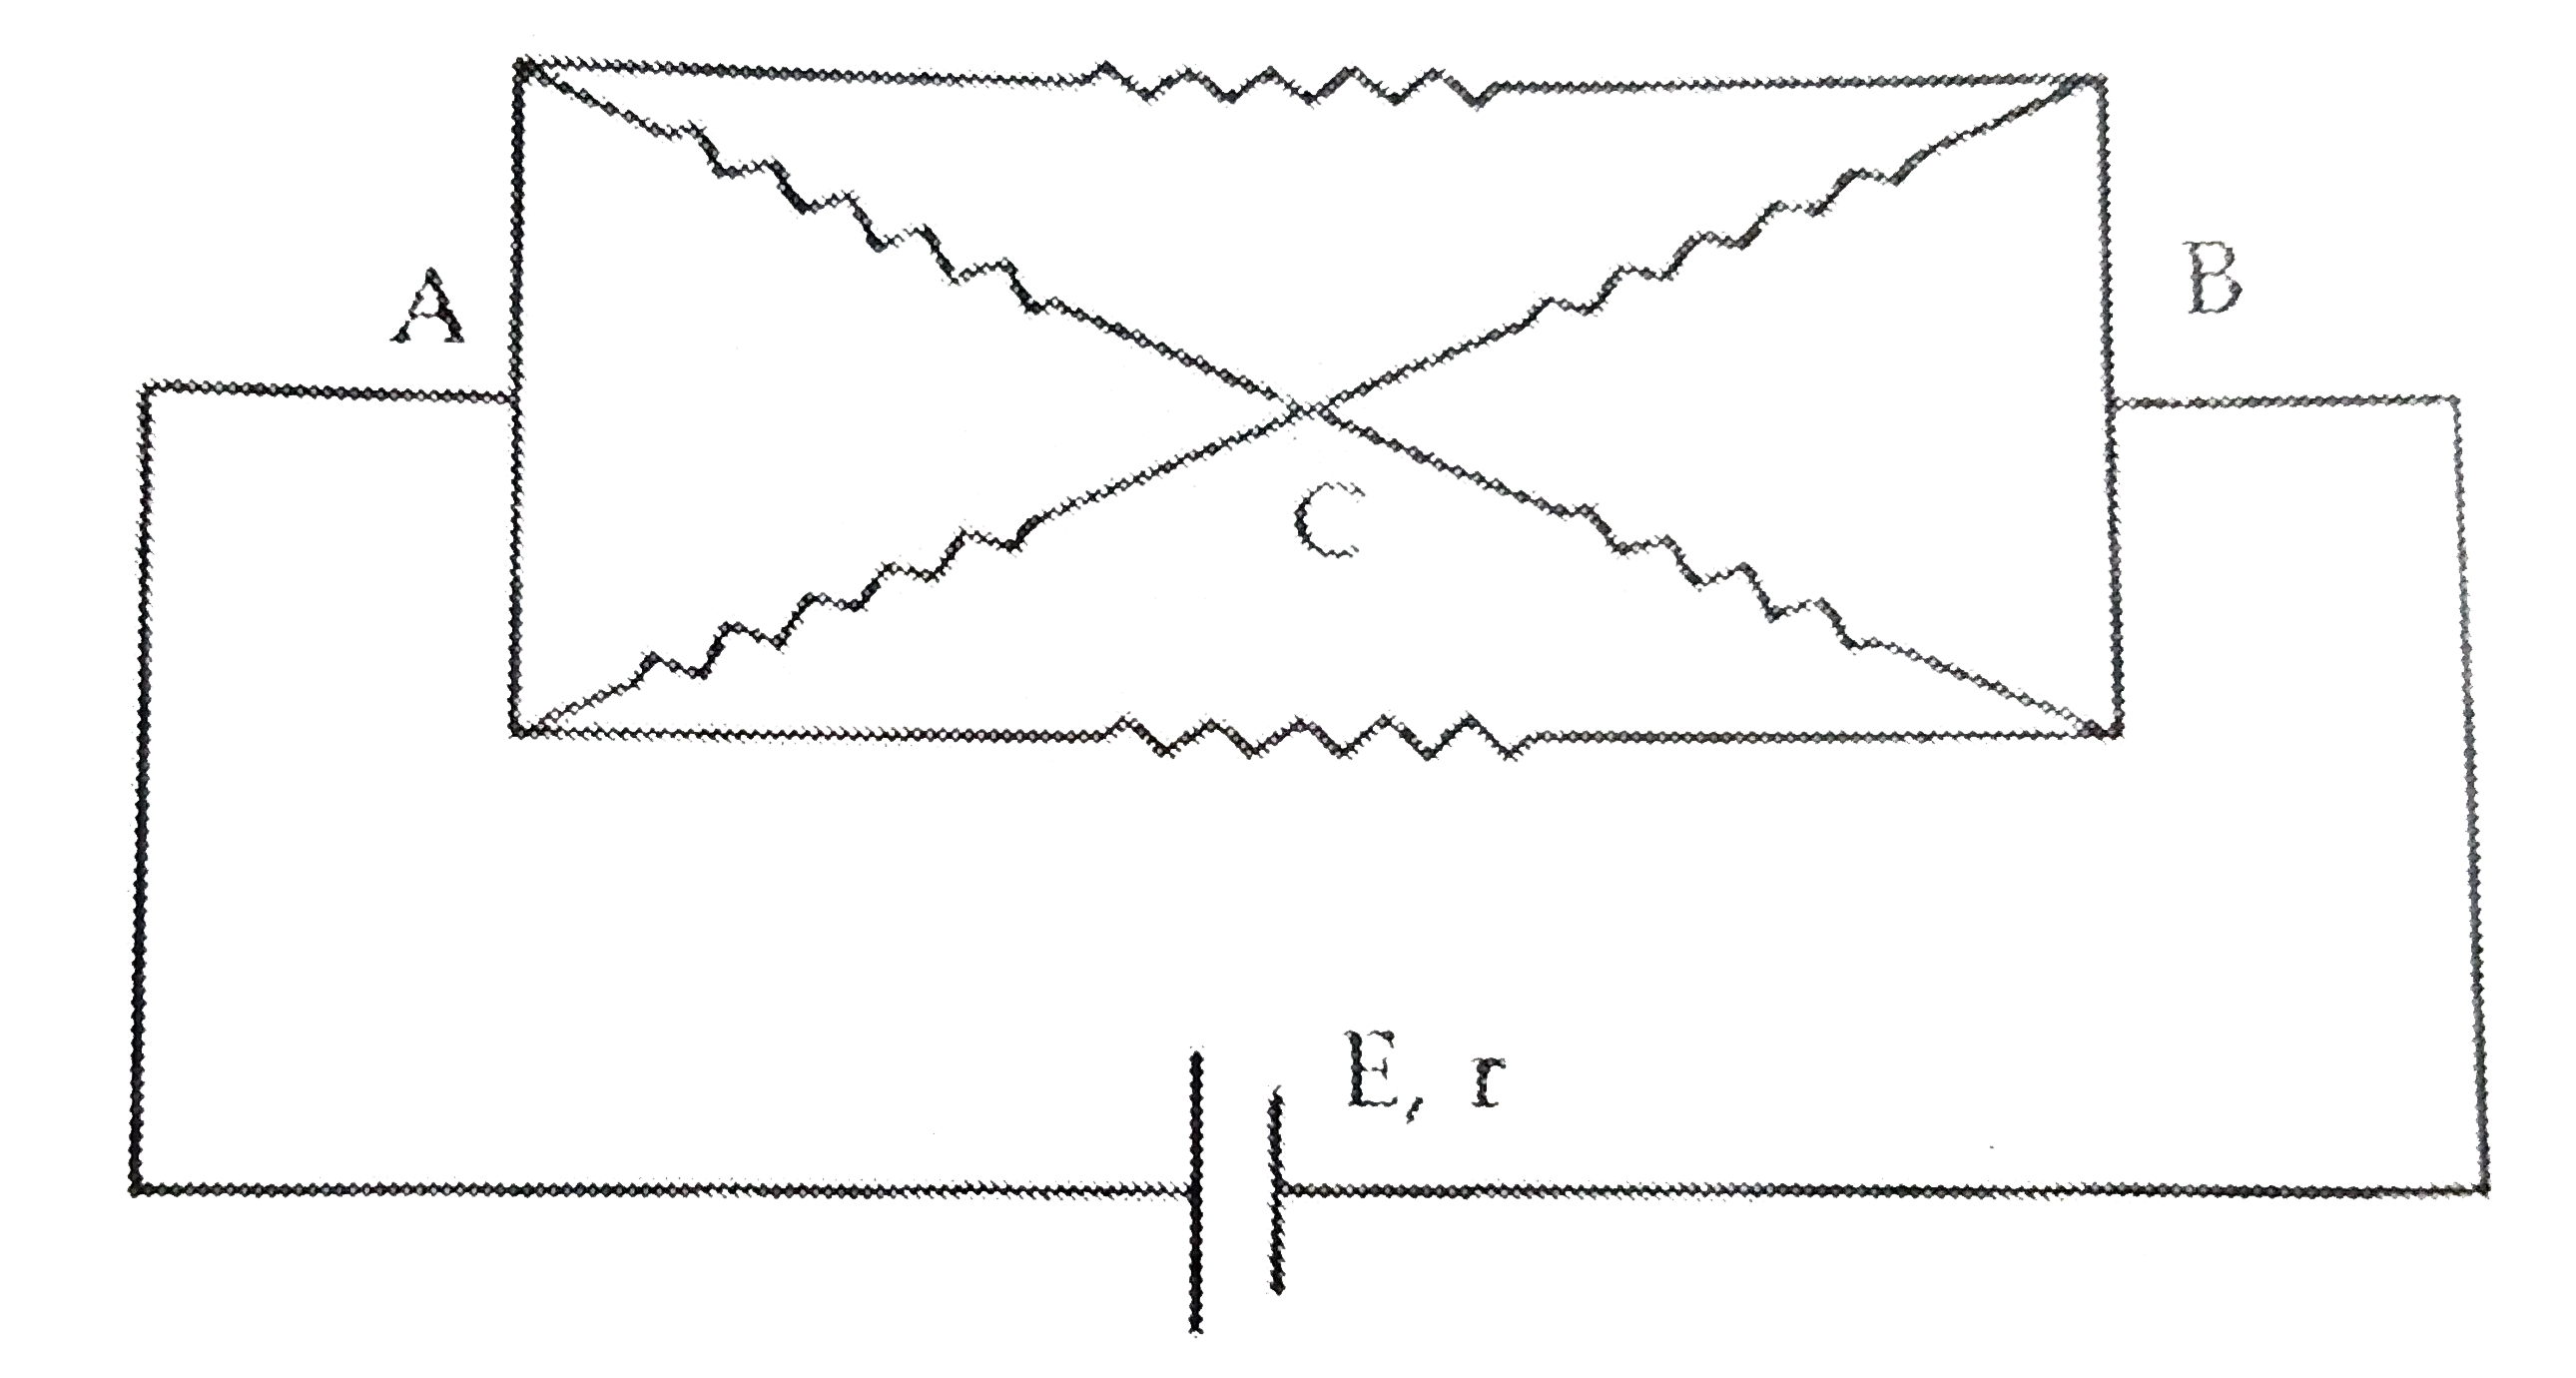
(ii) The current is drawn from a cell of emf E andinternal resistance r connected to the network of resistors each of resistance r as shown in the figure. Obtain the expression for (i) The current draw from the cell and (ii) the power consumed in the network .
View Solution
