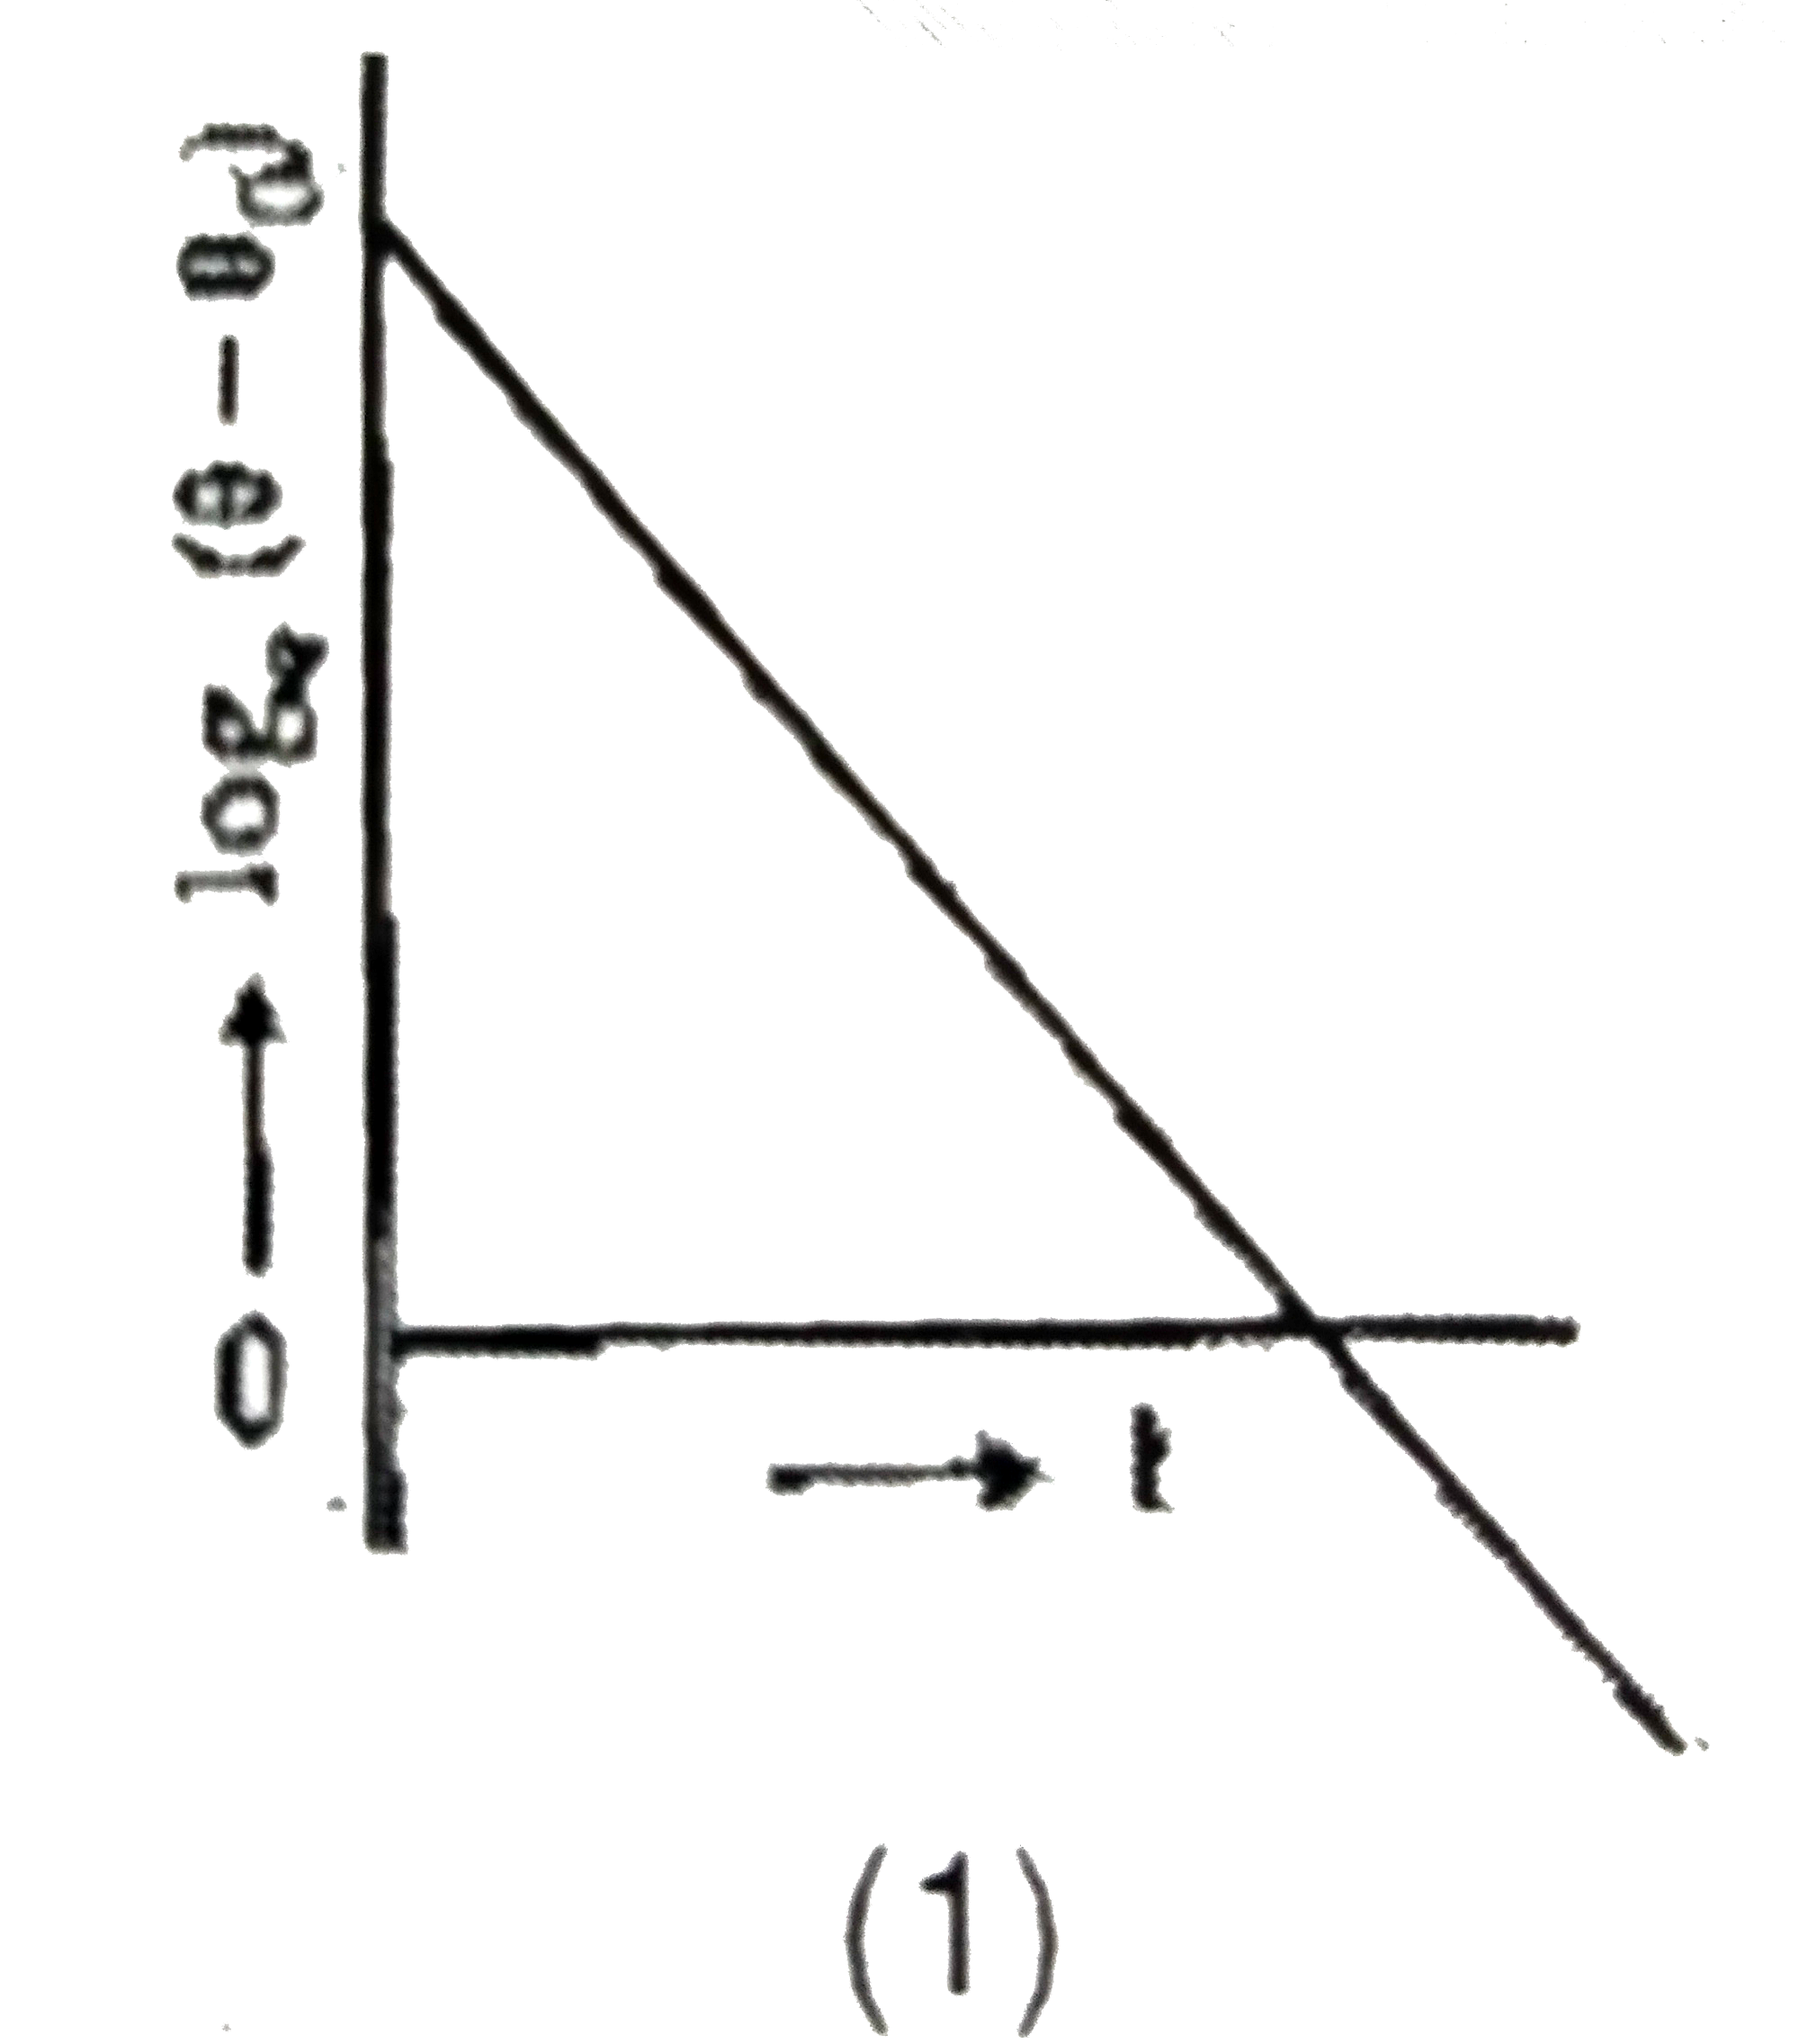
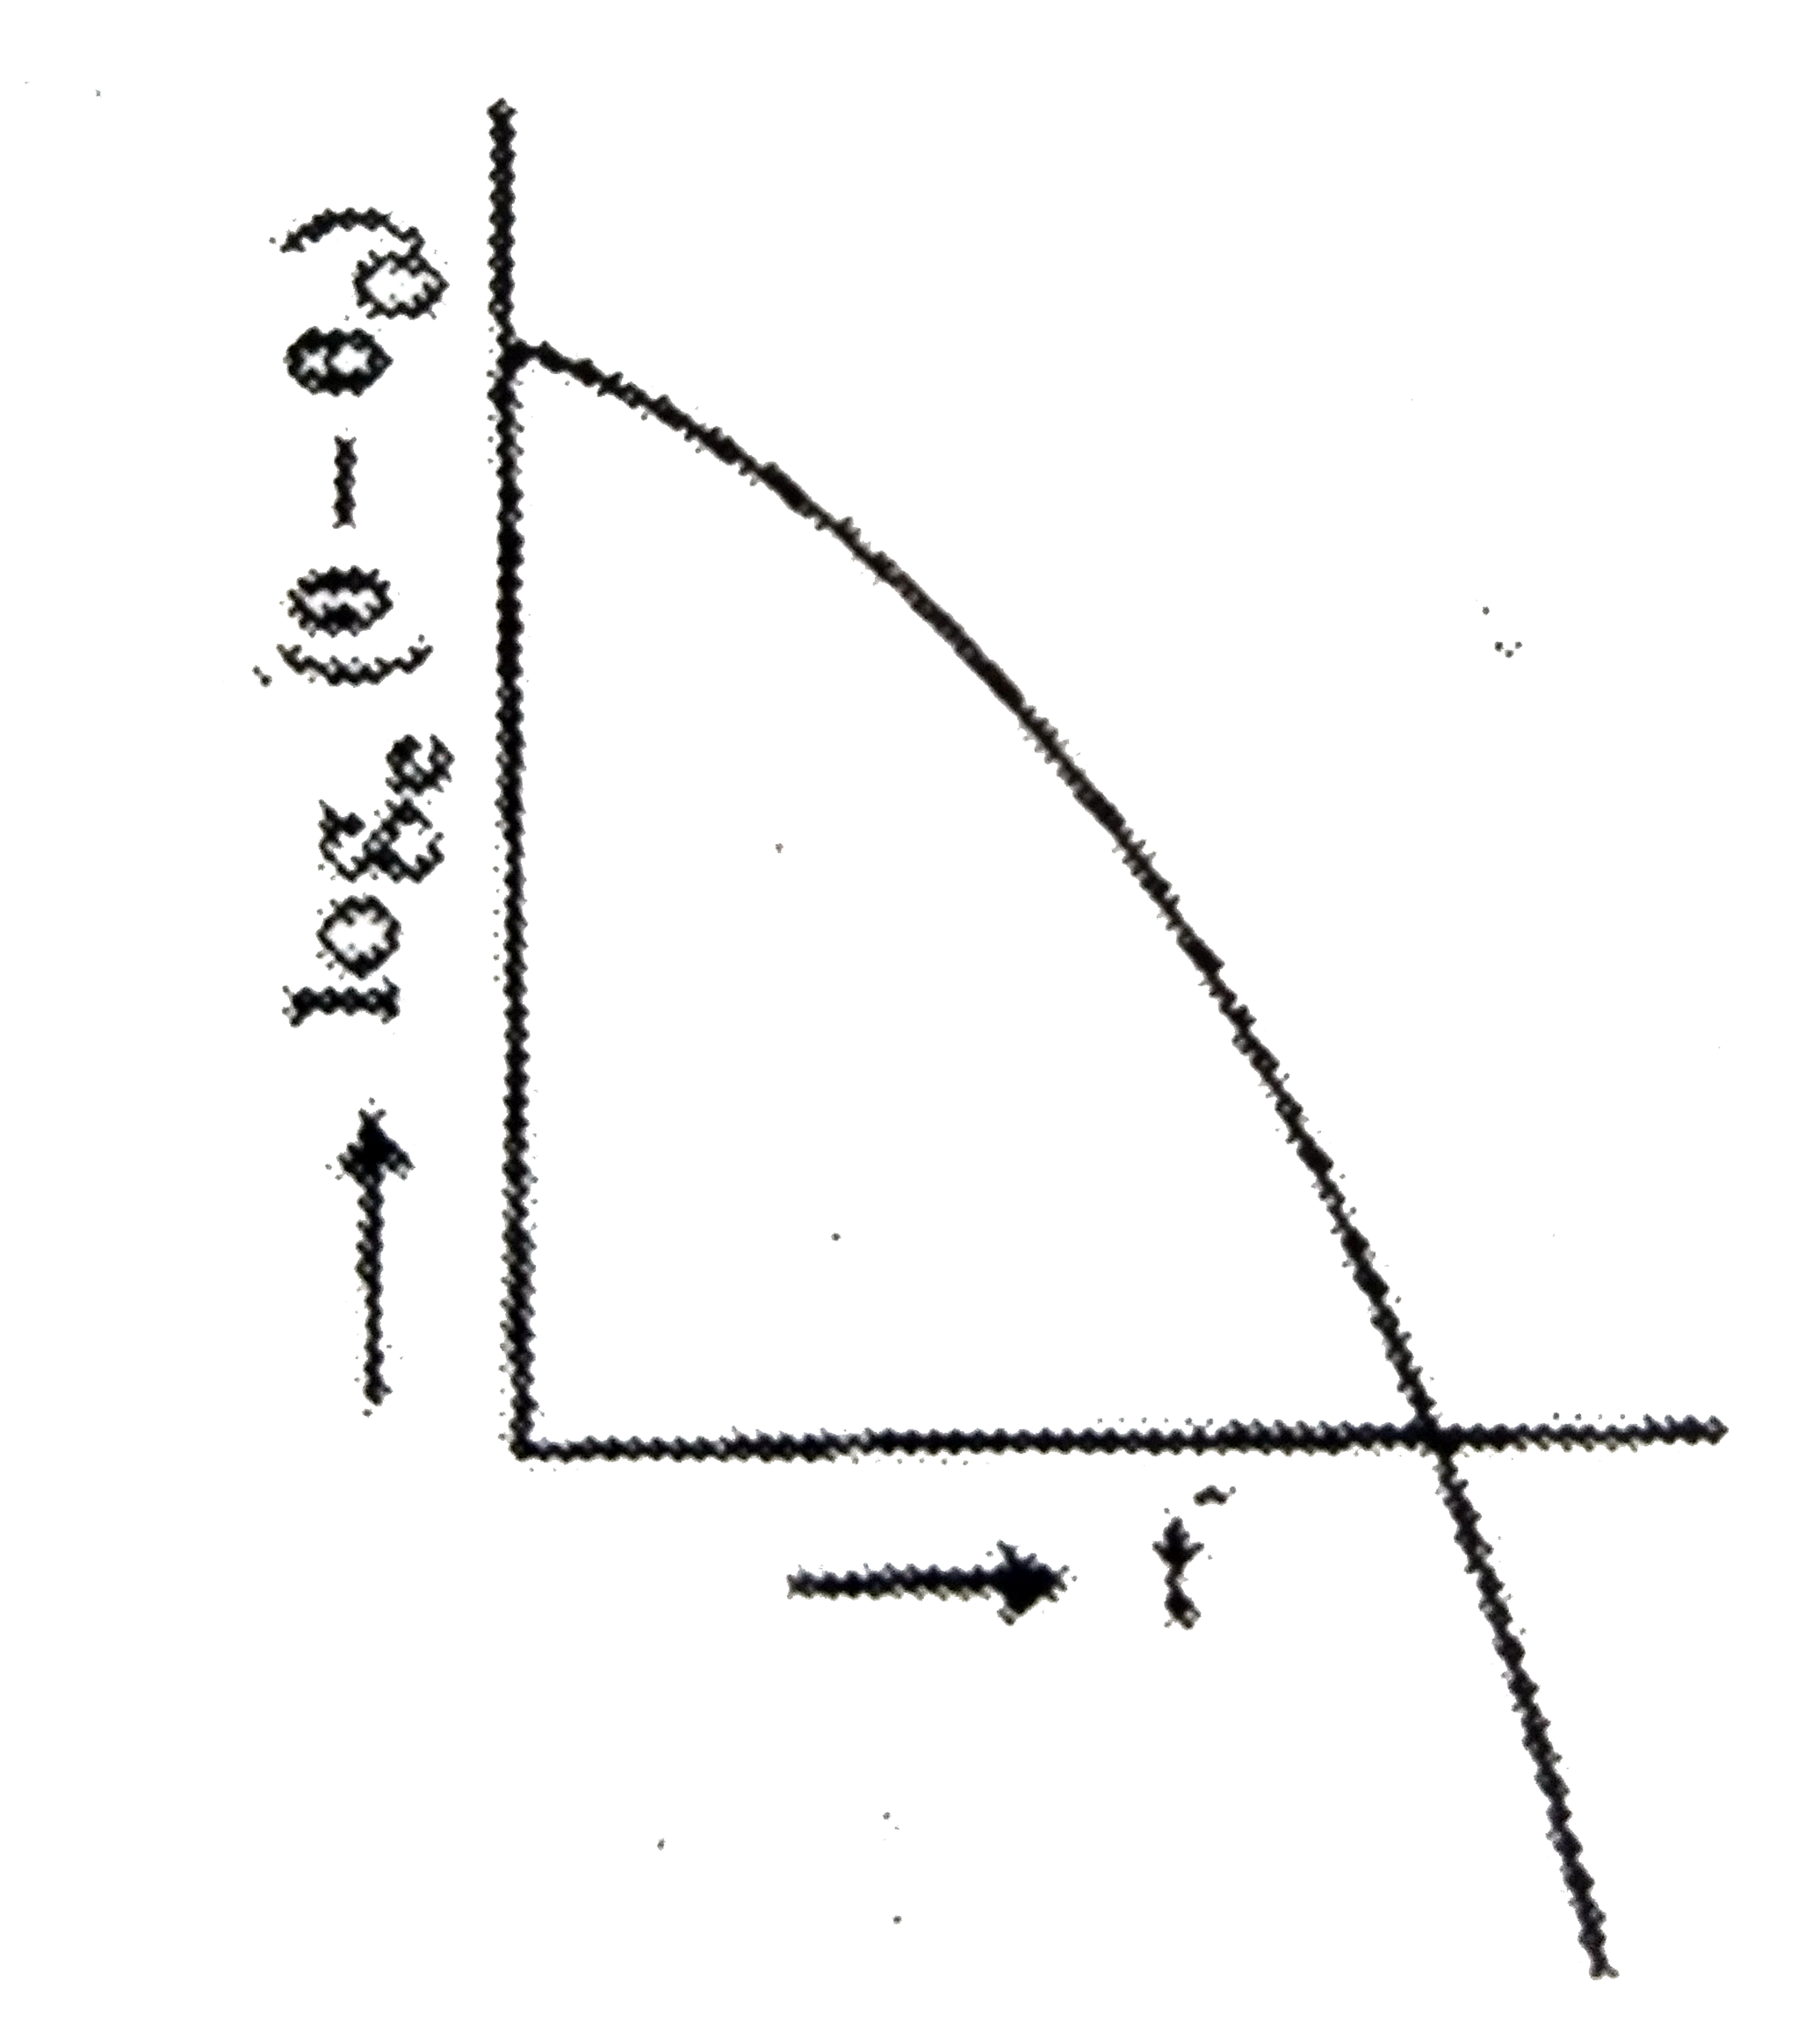
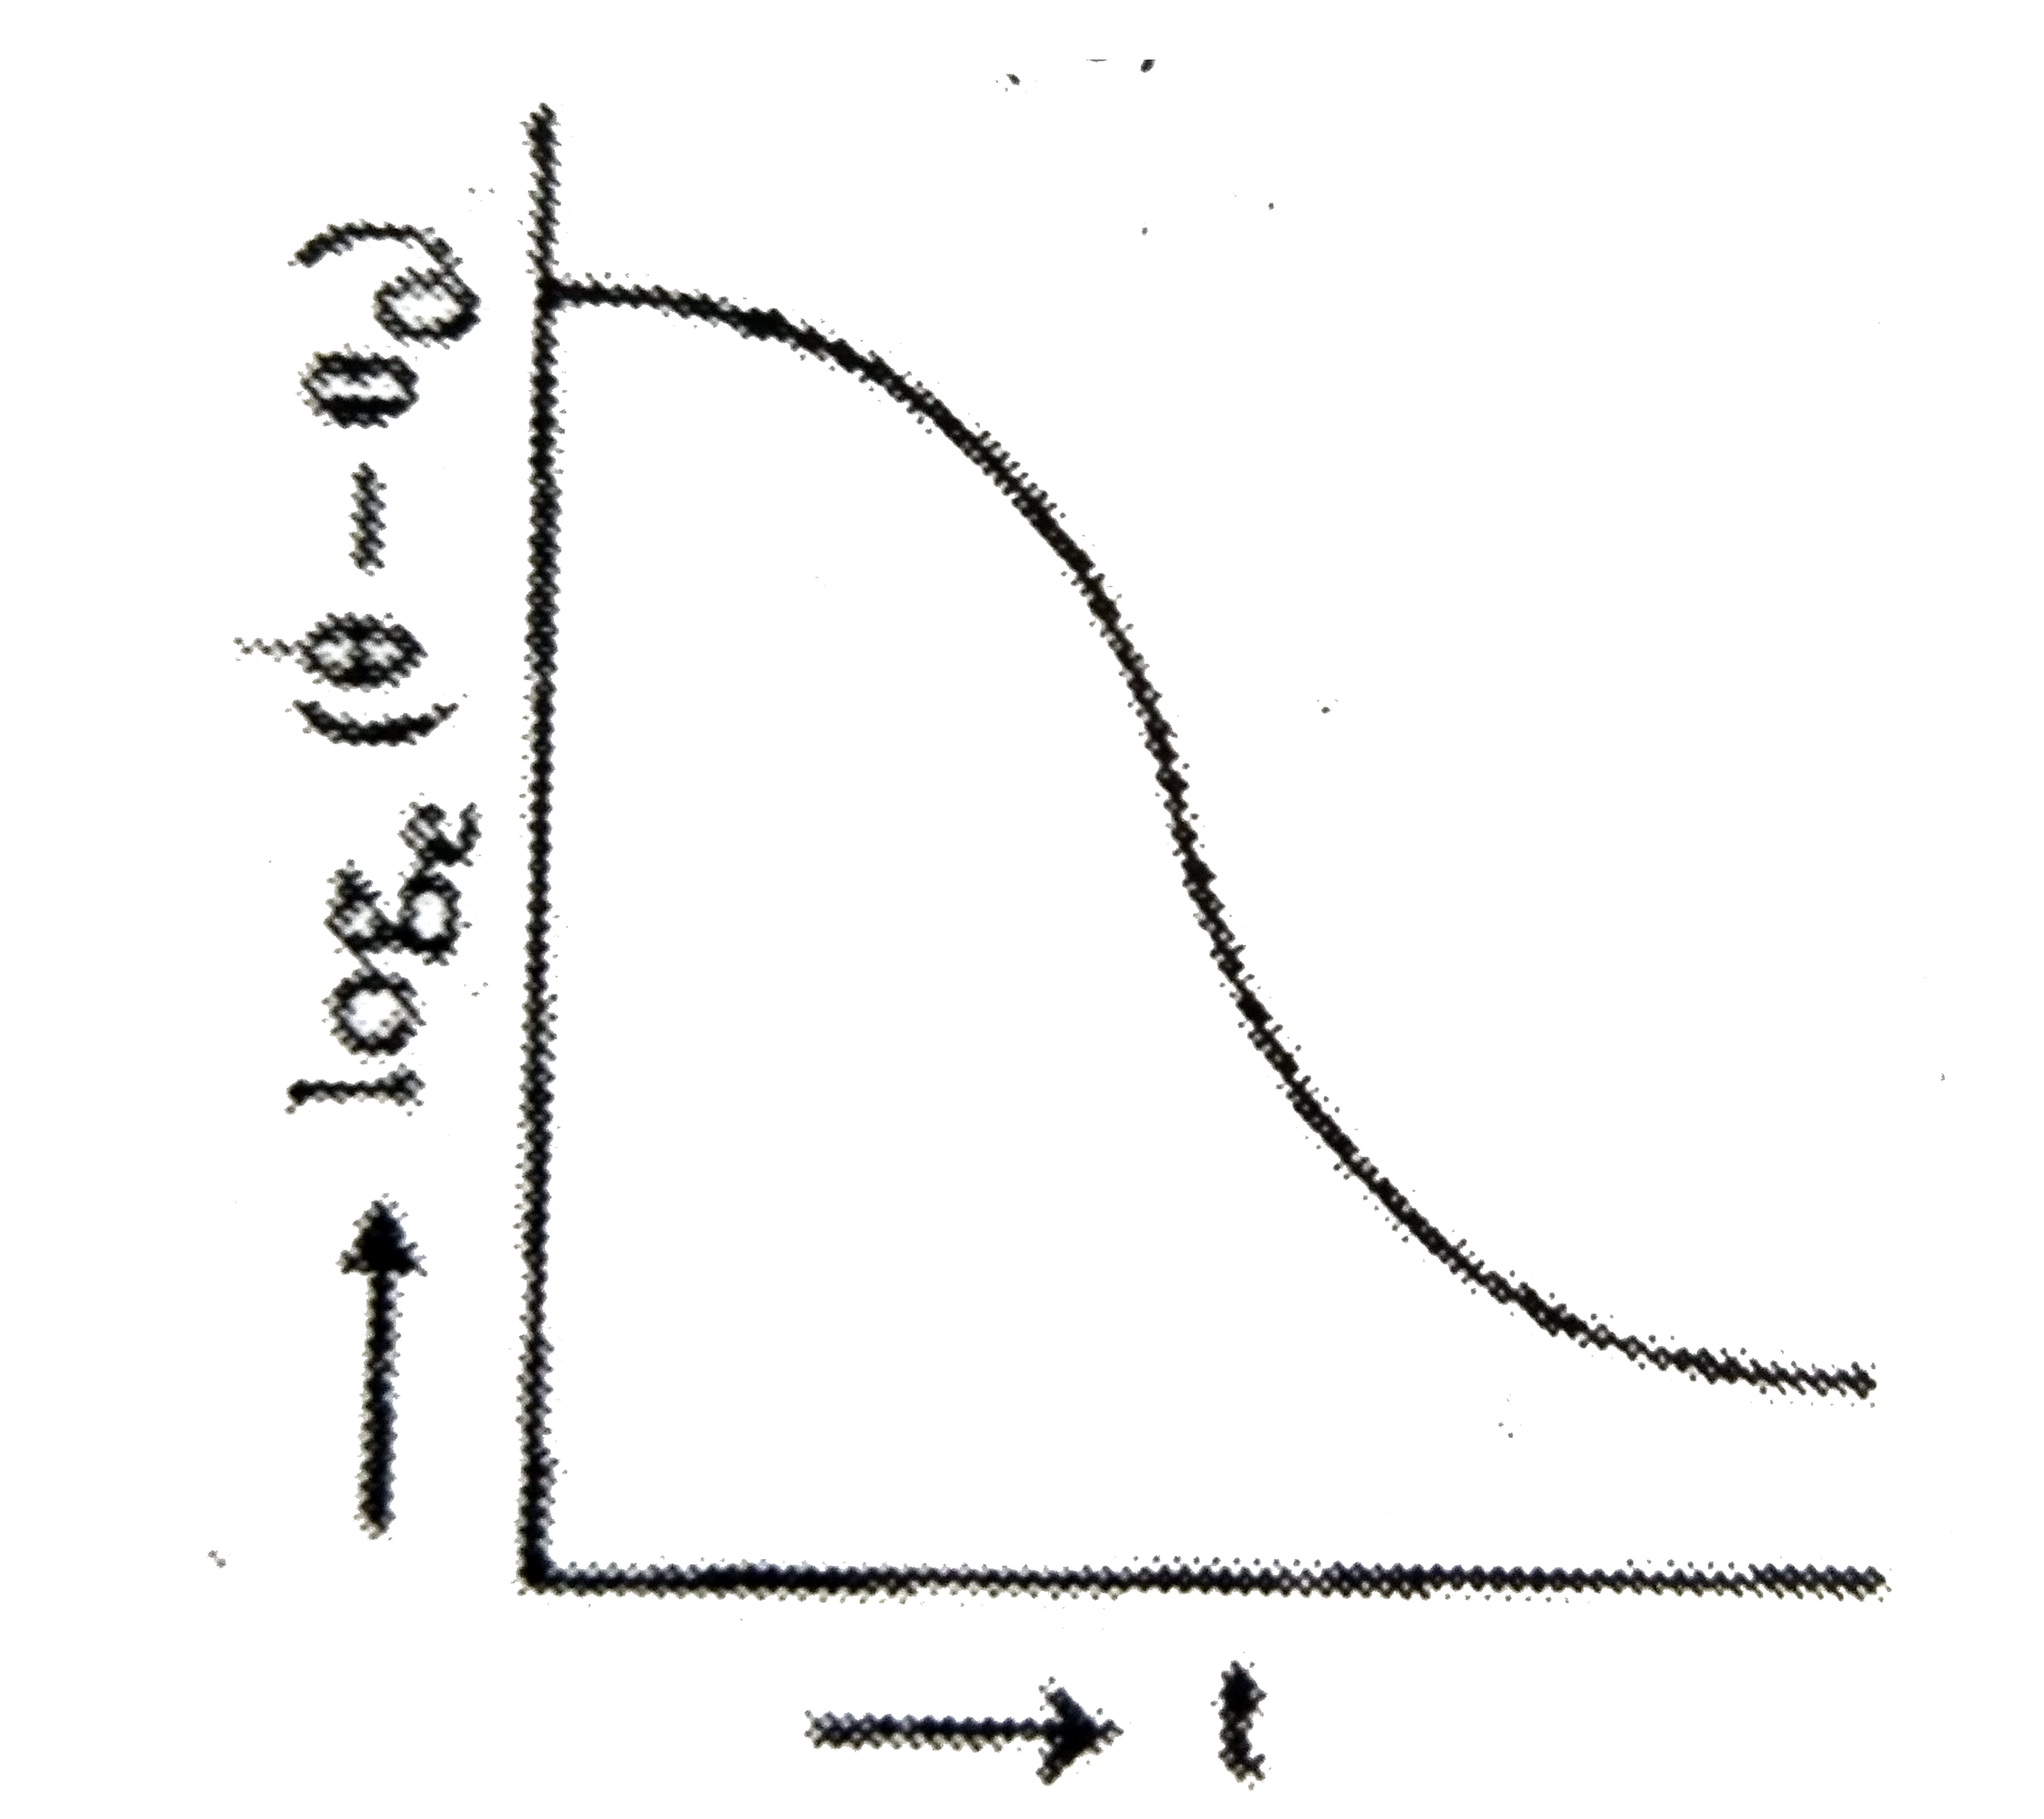
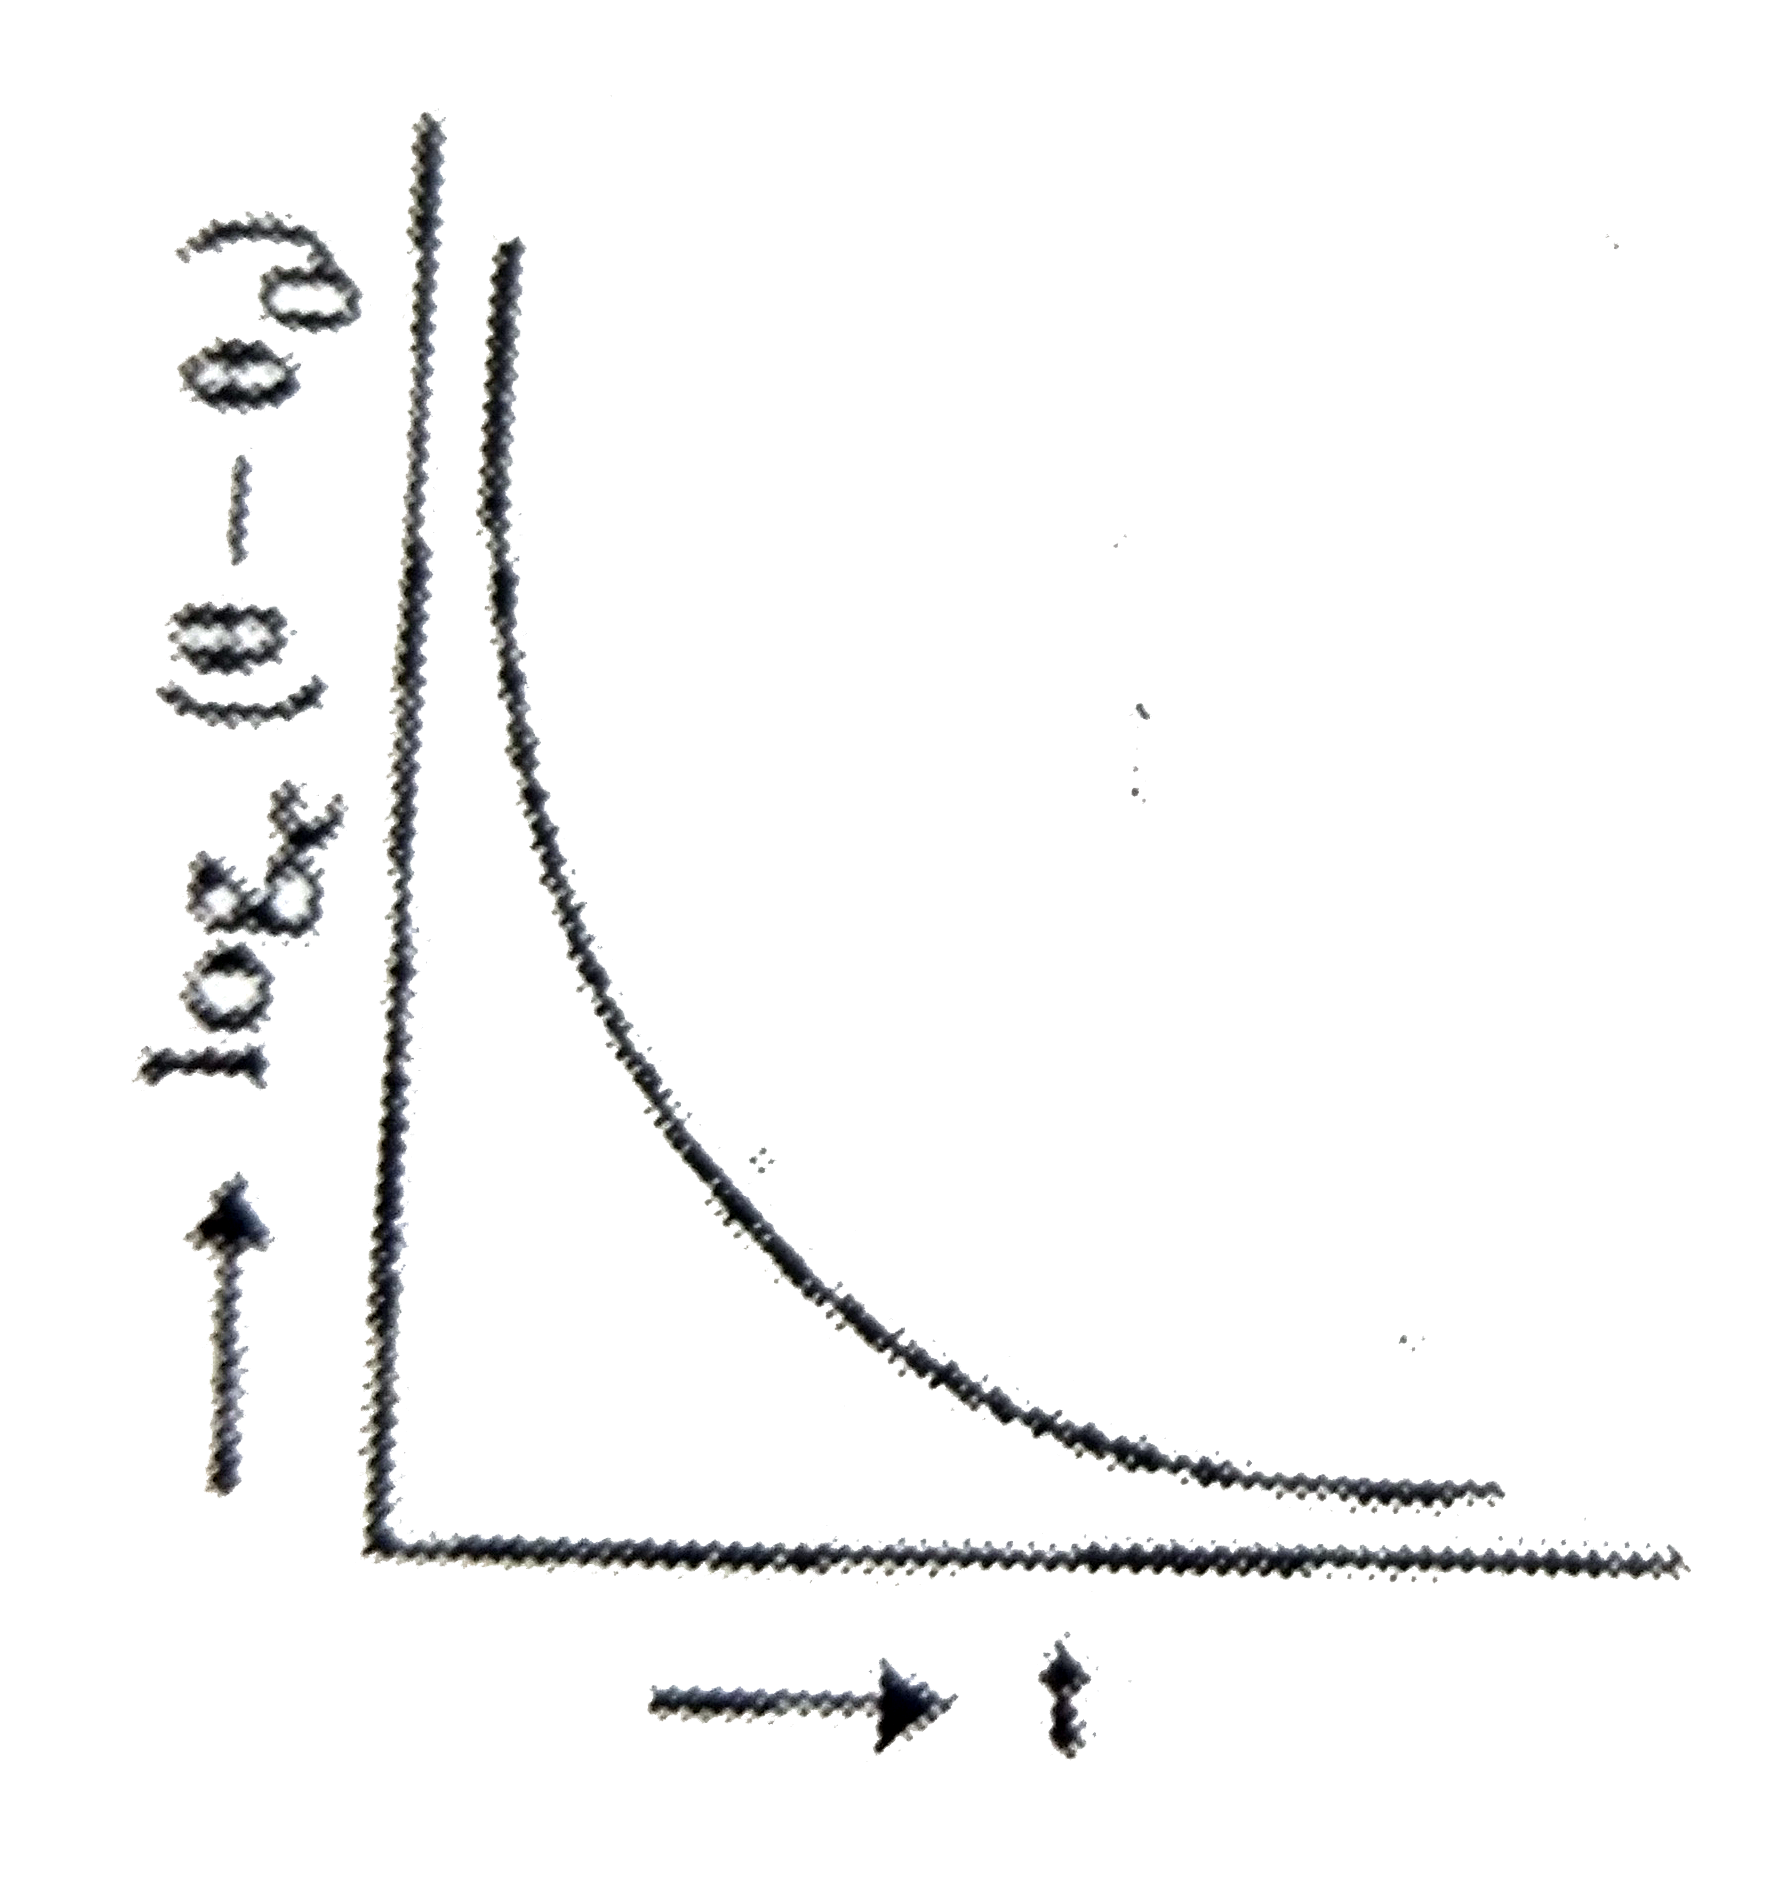
A liquid in a beaker has temperature θ(t) at time t and θ0 is temperature of surroundings, then according to Newton's law of cooling the correct graph between loge(θ−θ0) and t is :


The correct Answer is:A
To solve the problem, we will use Newton's Law of Cooling, which states that the rate of heat loss of a body is directly proportional to the difference in temperature between the body and its surroundings. Let's go through the steps to derive the relationship and determine the correct graph.
1. Understanding Newton's Law of Cooling:
According to Newton's Law of Cooling, the rate of change of temperature of the liquid is given by:
dθdt=−k(θ−θ0)
where θ is the temperature of the liquid at time t, θ0 is the temperature of the surroundings, and k is a positive constant.
2. Rearranging the Equation:
We can rearrange the equation to separate the variables:
dθθ−θ0=−kdt
3. Integrating Both Sides:
Now we will integrate both sides. The left side integrates with respect to θ and the right side with respect to t:
∫dθθ−θ0=−k∫dt
This gives us:
log(θ−θ0)=−kt+C
where C is the constant of integration.
4. Exponentiating Both Sides:
To eliminate the logarithm, we exponentiate both sides:
θ−θ0=e−kt+C=eCe−kt
Let C′=eC, then:
θ−θ0=C′e−kt
5. Taking the Logarithm:
We can express log(θ−θ0) in terms of t:
log(θ−θ0)=log(C′)−kt
6. Identifying the Form:
This equation can be rearranged to:
log(θ−θ0)=−kt+log(C′)
This is in the form of a linear equation y=mx+b where:
- y=log(θ−θ0)
- x=t
- m=−k (the slope)
- b=log(C′) (the y-intercept)
7. Graph Characteristics:
The graph of log(θ−θ0) versus t will be a straight line with a negative slope (since k>0).
8. Conclusion:
Therefore, the correct graph will be a straight line that slopes downwards. Among the given options, the first graph represents this relationship correctly.
Final Answer:
The correct graph between log(θ−θ0) and t is the first option.
According to Newton's Law of Cooling, the rate of change of temperature of the liquid is given by:
dθdt=−k(θ−θ0)
where θ is the temperature of the liquid at time t, θ0 is the temperature of the surroundings, and k is a positive constant.
We can rearrange the equation to separate the variables:
dθθ−θ0=−kdt
Now we will integrate both sides. The left side integrates with respect to θ and the right side with respect to t:
∫dθθ−θ0=−k∫dt
This gives us:
log(θ−θ0)=−kt+C
where C is the constant of integration.
To eliminate the logarithm, we exponentiate both sides:
θ−θ0=e−kt+C=eCe−kt
Let C′=eC, then:
θ−θ0=C′e−kt
We can express log(θ−θ0) in terms of t:
log(θ−θ0)=log(C′)−kt
This equation can be rearranged to:
log(θ−θ0)=−kt+log(C′)
This is in the form of a linear equation y=mx+b where:
- y=log(θ−θ0)
- x=t
- m=−k (the slope)
- b=log(C′) (the y-intercept)
The graph of log(θ−θ0) versus t will be a straight line with a negative slope (since k>0).
Therefore, the correct graph will be a straight line that slopes downwards. Among the given options, the first graph represents this relationship correctly.
The correct graph between log(θ−θ0) and t is the first option.
Topper's Solved these Questions
- JEE MAINSBook:JEE MAINS PREVIOUS YEAR ENGLISHChapter:JEE MAINSExercise:Chemistry
Explore 1 Video
- JEE MAINBook:JEE MAINS PREVIOUS YEAR ENGLISHChapter:JEE MAINExercise:All Questions
Explore 452 Videos
- JEE MAINS 2020Book:JEE MAINS PREVIOUS YEAR ENGLISHChapter:JEE MAINS 2020Exercise:PHYSICS
Explore 250 Videos
Similar Questions
Two liquids of specific heat ratio 1:2 are at temperature 2θandθ
View SolutionIn Newton's law of cooling dθdt=−k(θ−θ0) the constant k is proportional to .
View SolutionThe correct graph between the temperature of a hot body kept in cooler surrounding and time is (Assume newton's law of cooling)
View SolutionThe temperature of water in calorimeter is θ and the temperature of surrounding is θ0(<θ). Observation are recorded for temperature difference (θ−θ0) and time t. The cooling curve is best represented in graph.
View SolutionThemperature of a body θ is slightly more than the temperature of the surrounding θ0 its rate of cooling (R) versus temperature of body (θ) is plotted its shape would be .
View SolutionEvaluate: ∫√tanθ dθ
View SolutionInstantaneous temperature difference between cooling body and the surroundings obeying Newton's law of cooling is θ. Which of the following represents the variation of In θ with time t?
View SolutionTwo bodies A and B of equal masses, area and emissivity cooling under Newton's law of cooling from same temperature are represented by the graph: If θ is the instantaneous temperature of the body and θ0, is the temperature of surroundings, then relationship between their specific heats is
View SolutionIf the system were lossing heat according to Newton's cooling law the temperature of the mixture would change with time according to (while heater was on) .
View SolutionWrite Stefan.s law, define emissivity of a material. Derive Newton.s law of cooling and plot of a graph between temperature and time.
View Solution