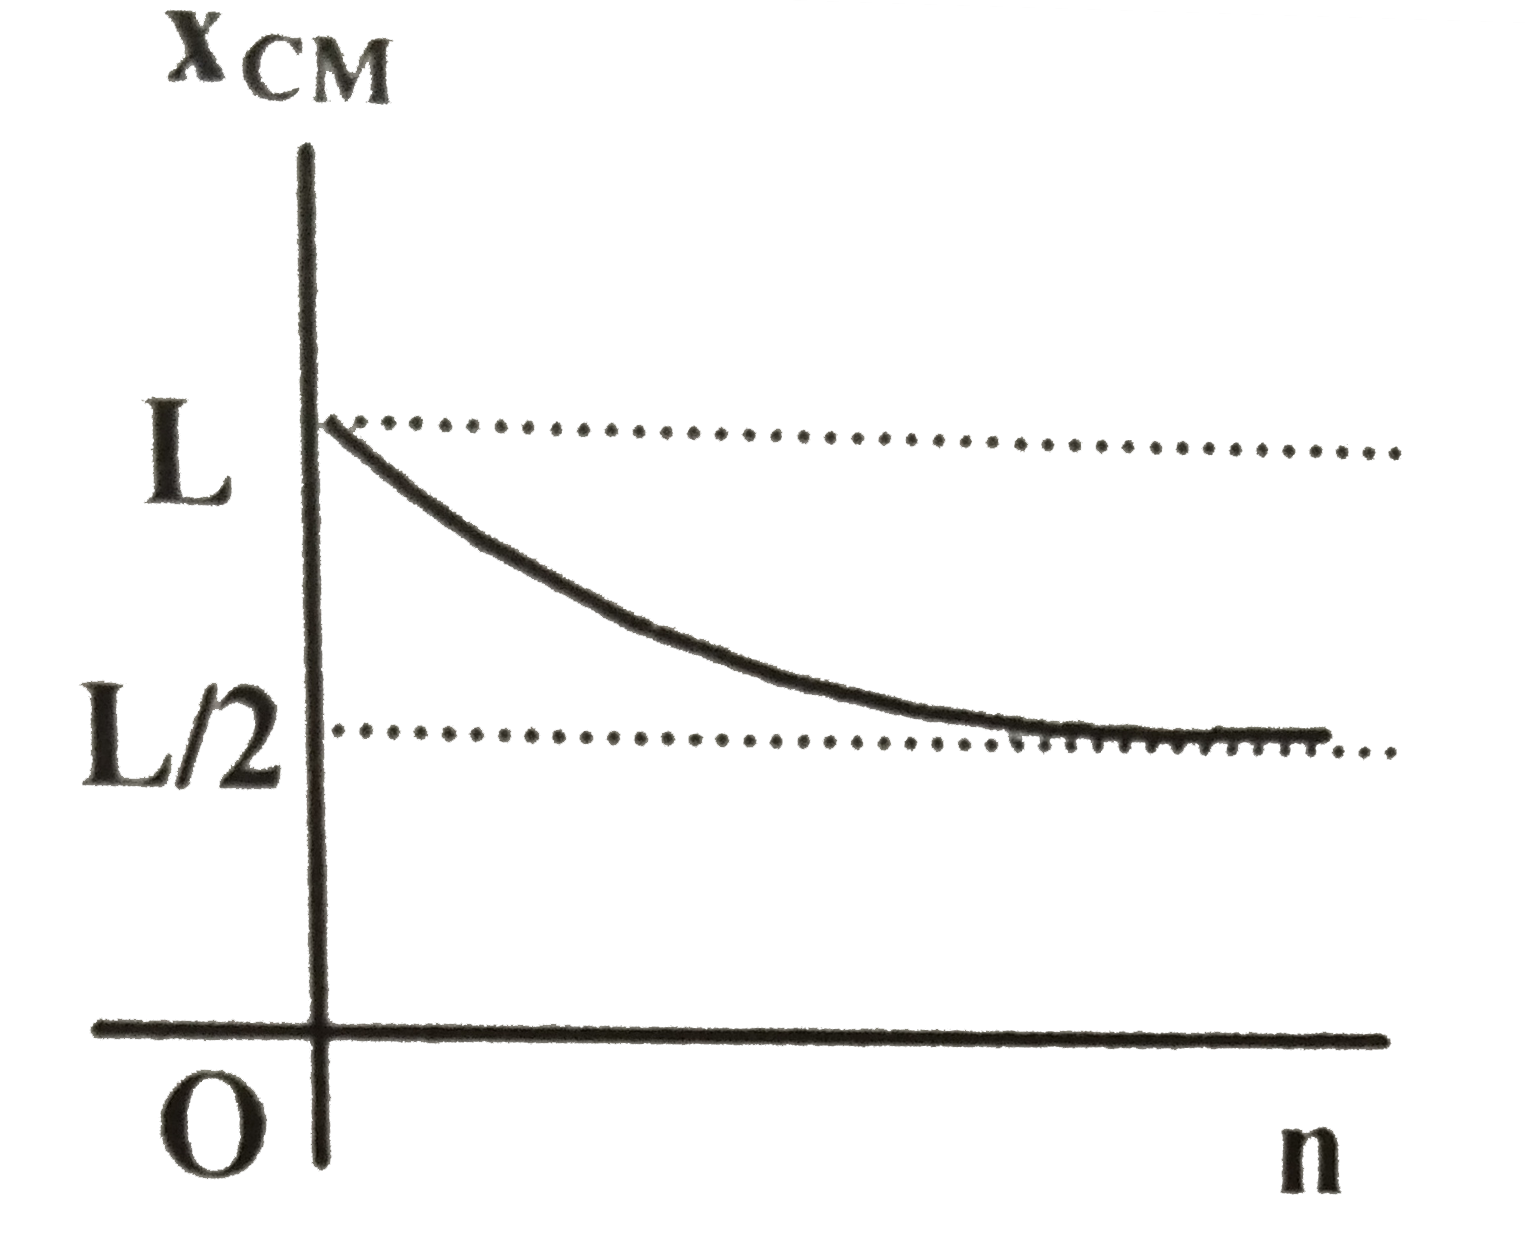
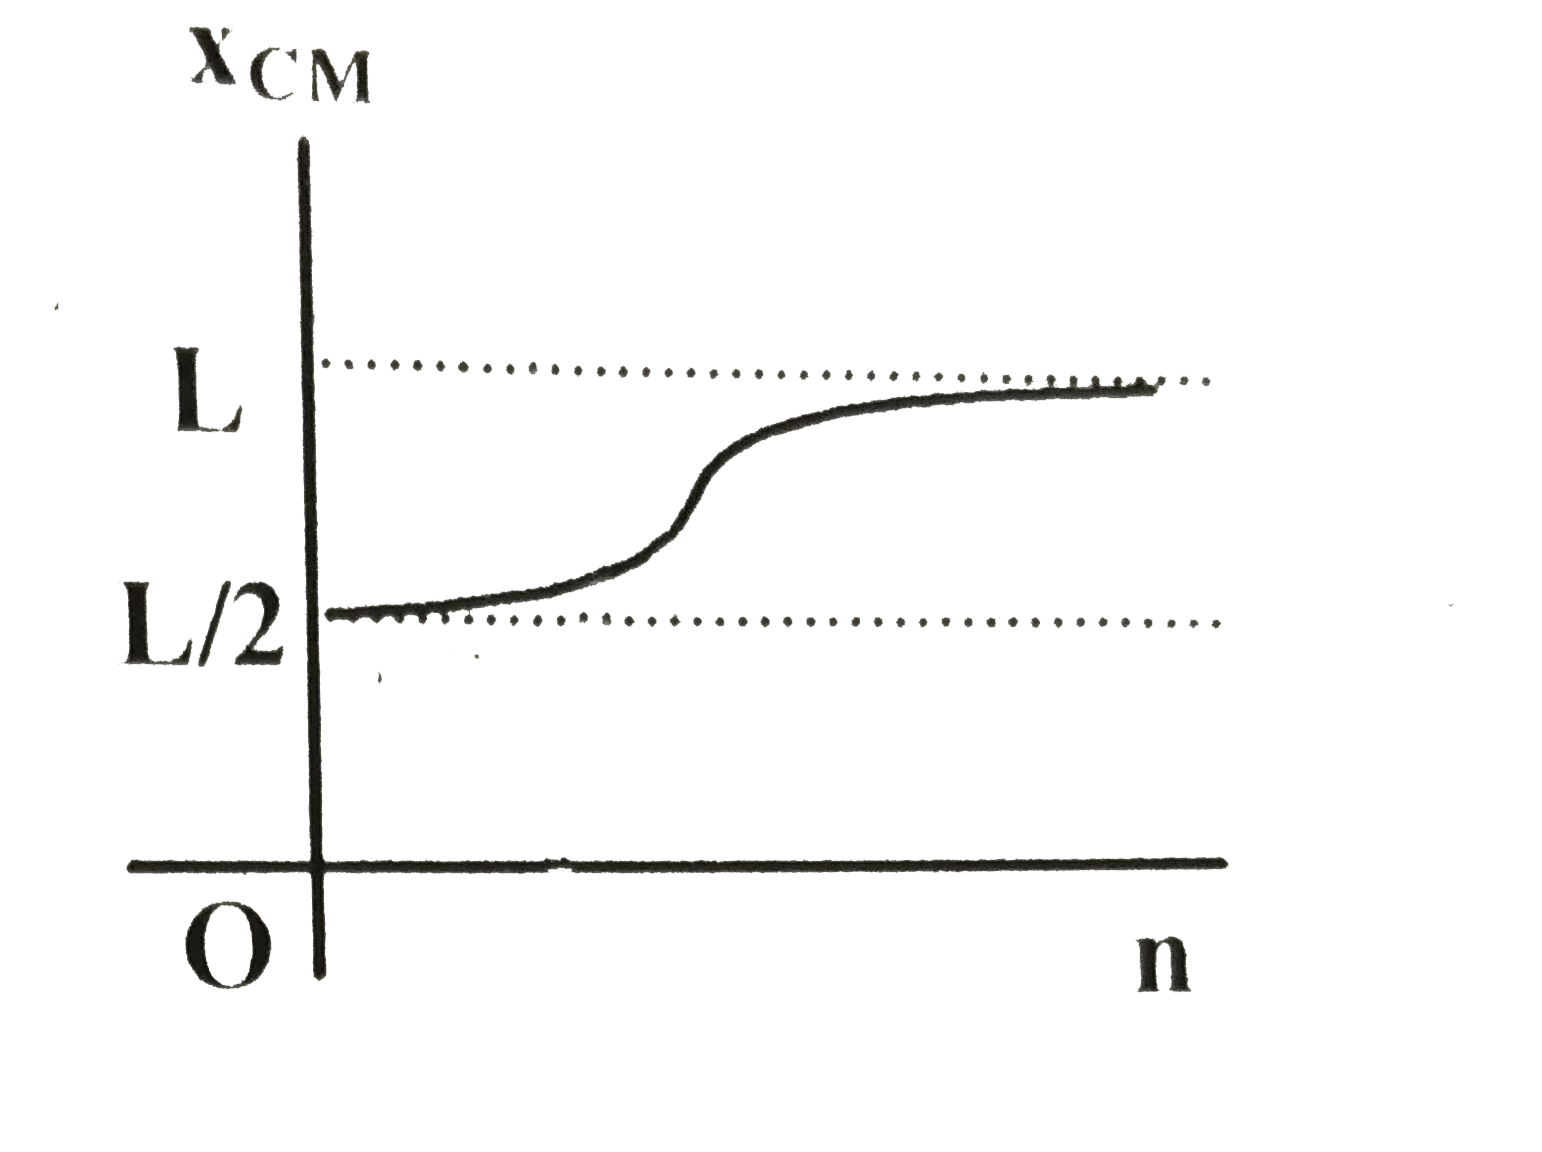
A thin rod of length L is lying along the x-axis with its ends at x=0 and x=L its linear (mass/length) varies with x as k(xL)n, where n can be zero of any positive number. If to position xCM of the centre of mass of the rod is plotted against 'n', which of the following graphs best apporximates the dependence of xCM on n?


The correct Answer is:A
To solve the problem of finding the center of mass xCM of a thin rod with a varying linear density, we will follow these steps:
Step 1: Define the linear density
The linear density λ(x) of the rod is given by:
λ(x)=k(xL)n
where k is a constant, L is the length of the rod, and n can be 0 or any positive number.
Step 2: Express the mass element
A small element of the rod dx at position x has mass dm given by:
dm=λ(x)dx=k(xL)ndx
Step 3: Set up the center of mass formula
The center of mass xCM is defined as:
xCM=∫L0xdm∫L0dm
Step 4: Calculate the numerator
Substituting dm into the numerator:
∫L0xdm=∫L0x⋅k(xL)ndx=k∫L0xn+11Lndx
This simplifies to:
kLn∫L0xn+1dx
Calculating the integral:
∫L0xn+1dx=(xn+2n+2)L0=Ln+2n+2
Thus, the numerator becomes:
∫L0xdm=kLn+2Ln(n+2)=kL2n+2
Step 5: Calculate the denominator
Now, we calculate the denominator:
∫L0dm=∫L0k(xL)ndx=k∫L0xnLndx=kLn∫L0xndx
Calculating the integral:
∫L0xndx=(xn+1n+1)L0=Ln+1n+1
Thus, the denominator becomes:
∫L0dm=kLn+1Ln(n+1)=kLn+1
Step 6: Combine to find xCM
Now substituting back into the formula for xCM:
xCM=kL2n+2kLn+1=L2n+2⋅n+1L=L(n+1)n+2
Step 7: Analyze the relationship with n
From the expression xCM=L(n+1)n+2, we can analyze how xCM behaves as n changes:
- When n=0:
xCM=L(0+1)0+2=L2
- As n→∞:
xCM→L
This indicates that as n increases, xCM increases from L2 to L.
Conclusion
The graph of xCM versus n will start at L2 when n=0 and approach L as n increases. Thus, the graph will be an increasing function of n.
The linear density λ(x) of the rod is given by:
λ(x)=k(xL)n
where k is a constant, L is the length of the rod, and n can be 0 or any positive number.
A small element of the rod dx at position x has mass dm given by:
dm=λ(x)dx=k(xL)ndx
The center of mass xCM is defined as:
xCM=∫L0xdm∫L0dm
Substituting dm into the numerator:
∫L0xdm=∫L0x⋅k(xL)ndx=k∫L0xn+11Lndx
This simplifies to:
kLn∫L0xn+1dx
Calculating the integral:
∫L0xn+1dx=(xn+2n+2)L0=Ln+2n+2
Thus, the numerator becomes:
∫L0xdm=kLn+2Ln(n+2)=kL2n+2
Now, we calculate the denominator:
∫L0dm=∫L0k(xL)ndx=k∫L0xnLndx=kLn∫L0xndx
Calculating the integral:
∫L0xndx=(xn+1n+1)L0=Ln+1n+1
Thus, the denominator becomes:
∫L0dm=kLn+1Ln(n+1)=kLn+1
Now substituting back into the formula for xCM:
xCM=kL2n+2kLn+1=L2n+2⋅n+1L=L(n+1)n+2
From the expression xCM=L(n+1)n+2, we can analyze how xCM behaves as n changes:
- When n=0:
xCM=L(0+1)0+2=L2
- As n→∞:
xCM→L
This indicates that as n increases, xCM increases from L2 to L.
The graph of xCM versus n will start at L2 when n=0 and approach L as n increases. Thus, the graph will be an increasing function of n.
Topper's Solved these Questions
Similar Questions
A thin rod of length 6 m is lying along the x-axis with its ends at x=0 and x=6m. Its linear density *mass/length ) varies with x as kx4. Find the position of centre of mass of rod in meters.
View SolutionA rod of length L is placed along the x-axis between x=0 and x=L. The linear mass density (mass/length) ρ of the rod varies with the distance x from the origin as ρ=a+bx. Here, a and b are constants. Find the position of centre of mass of this rod.
View SolutionA rod of length L is placed along the X-axis between x=0andx=L. The linear density (mass/length) ρ of the rod varies with the distance x from the origin as ρ=a+bx. a.) Find the SI units of a and b b.) Find the mass of the rod in terms of a,b, and L.
View SolutionA conductor of length L is placed along the x - axis , with one of its ends at x = 0 and the other at x = L. If the rate of flow of heat energy through the conduct is constant and its thermal resistance per unit length is also constant , then Which of the following graphs is/are correct ?
View SolutionIf linear density of a rod of length 3m varies as λ=2+x, them the position of the centre of gravity of the rod is
View SolutionA non–uniform thin rod of length L is placed along x-axis as such its one of ends at the origin. The linear mass density of rod is λ=λ0x. The distance of centre of mass of rod from the origin is :
View SolutionA rod of length L lies along the x-axis with its left end at the origin. It has a non-uniform charge density λ=αx, where a is a positive constant.
(a) What are the units of α?
(b) Calculate the electric potential at point A where x=−d .
View SolutionThe density of a thin rod of length l varies with the distance x from one end as ρ=ρ0x2l2. Find the position of centre of mass of rod.
View SolutionA uniform rod of length l is being rotated in a horizontal plane with a constant angular speed about an axis passing through one of its ends. If the tension generated in the rod due to rotation is T(x) at a distance x from the axis. Then which of the following graphs depicts it most closely?
View SolutionA straight rod of length L has one of its end at the origin and the other at X=L. If the mass per unit length of the rod is given by Ax where A is constant, where is its centre of mass?
View Solution
