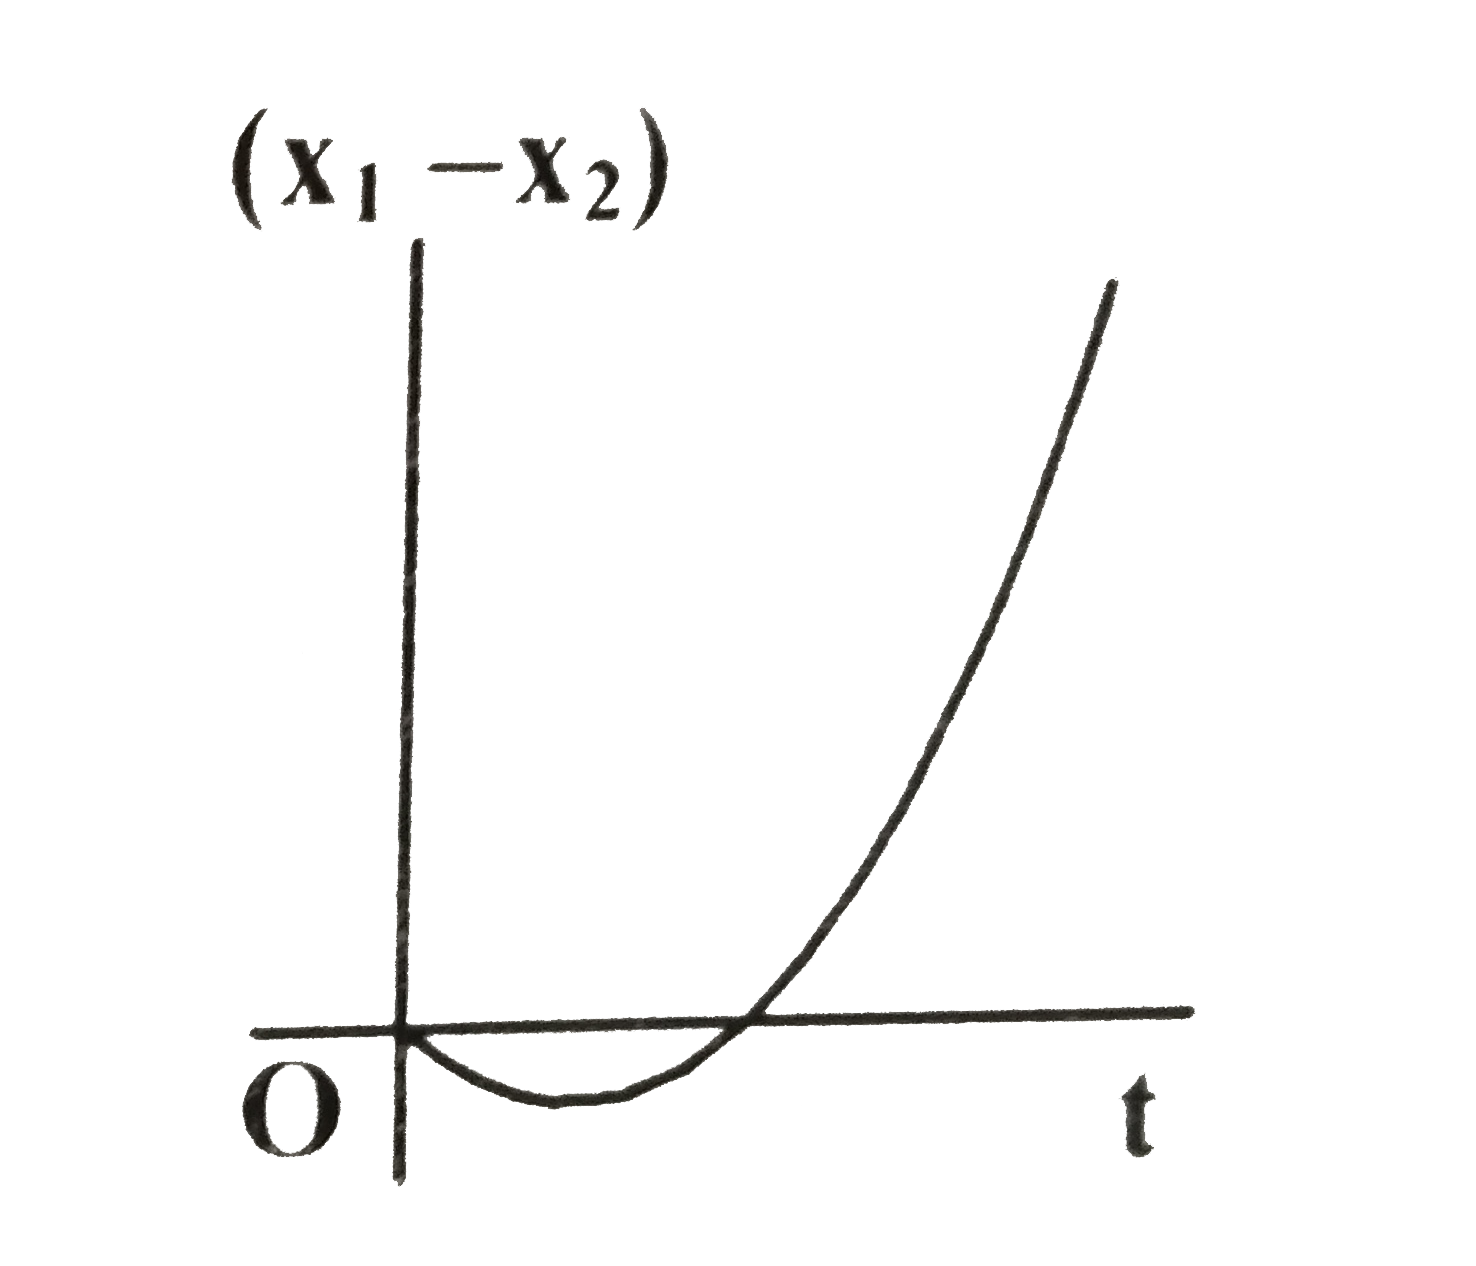
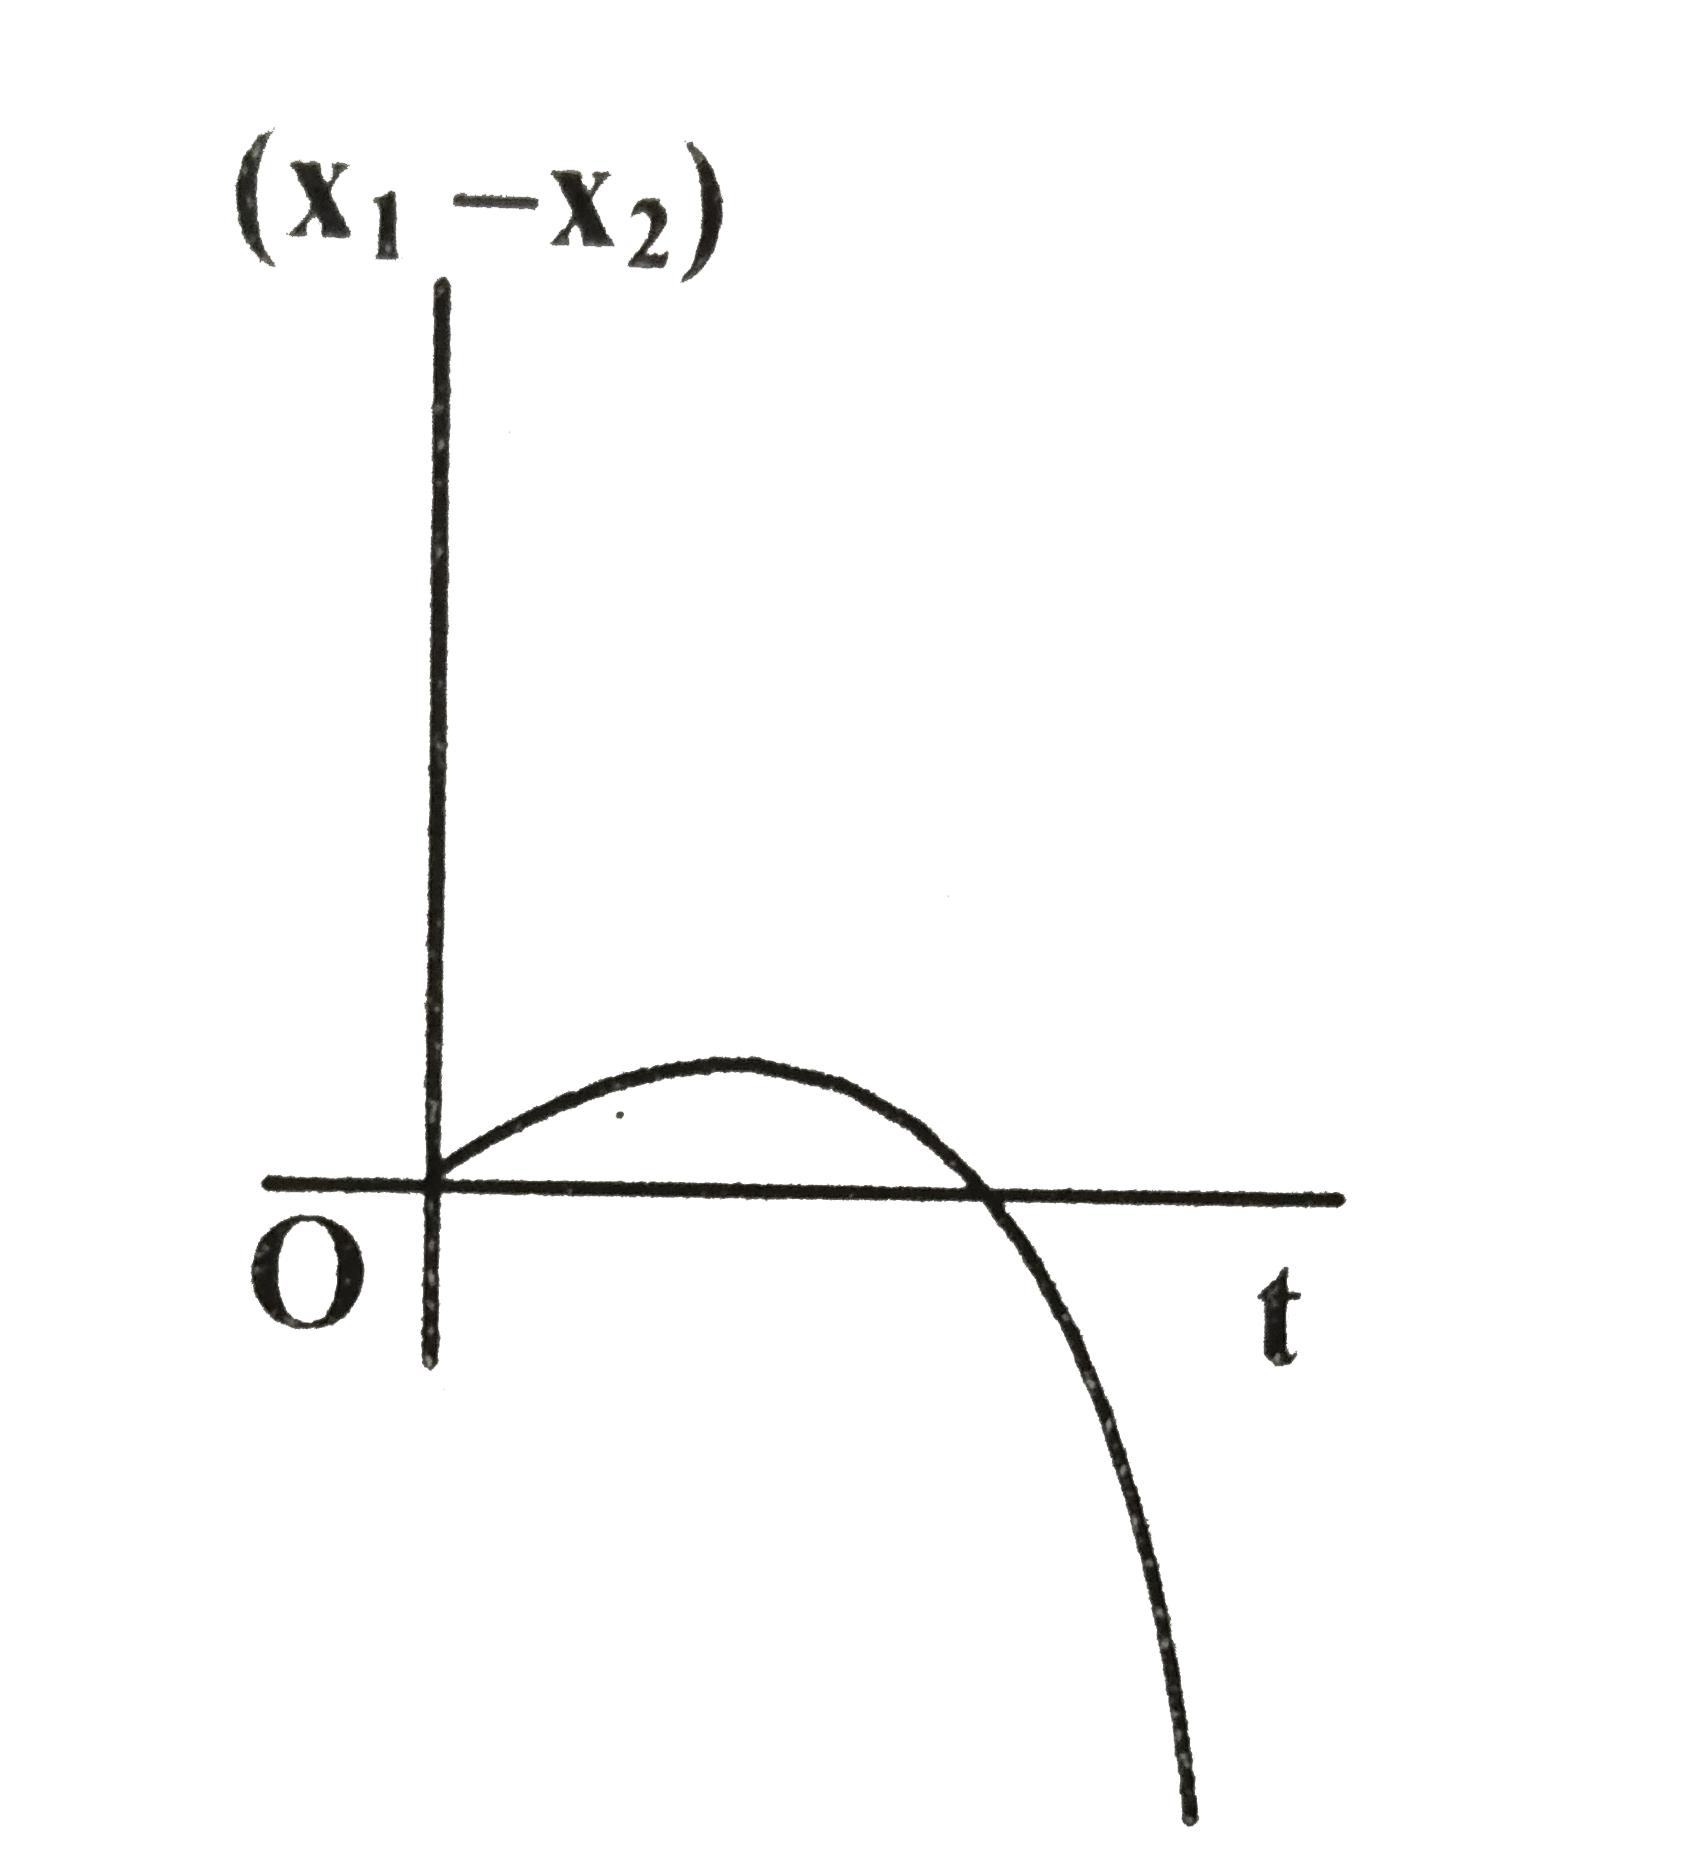
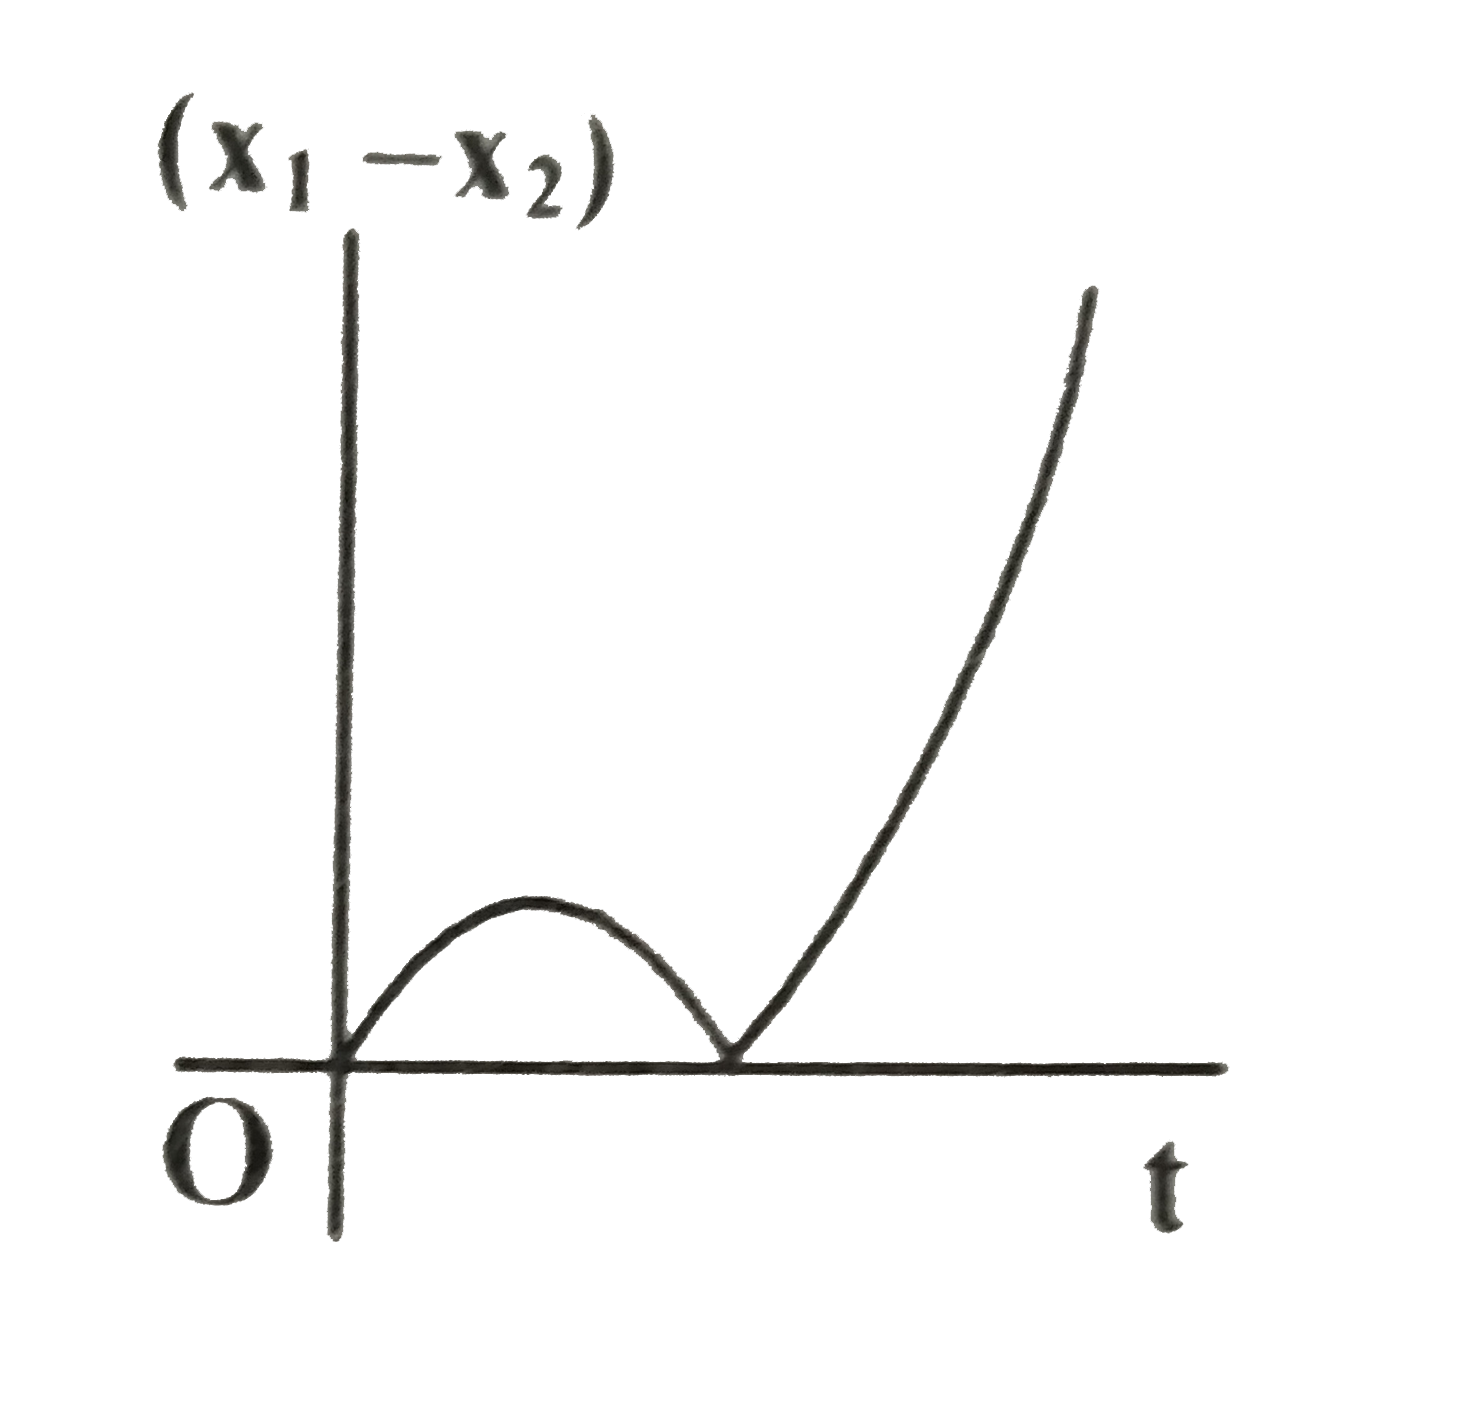
A body is at rest at x=0 . At t=0, it starts moving in the positive x−direction with a constant acceleration . At the same instant another body passes through x=0 moving in the positive x−direction with a constant speed . The position of the first body is given by x1(t) after time 't', and that of the second body by x2(t) after the same time interval . which of the following graphs correctly describes (x1−x2) as a function of time 't' ?


The correct Answer is:B
To solve the problem, we need to analyze the motion of two bodies: one that starts from rest with constant acceleration and another that moves with constant speed. We will derive the positions of both bodies as functions of time and then find the difference between these positions.
1. Define the Motion of Body A (Accelerating Body):
- Body A starts from rest at x=0 at t=0 with a constant acceleration a.
- The position of Body A after time t is given by the equation of motion:
x1(t)=12at2
2. Define the Motion of Body B (Constant Speed Body):
- Body B passes through x=0 at t=0 and moves with a constant speed v.
- The position of Body B after time t is given by:
x2(t)=vt
3. Find the Difference in Position:
- We need to find x1(t)−x2(t):
x1(t)−x2(t)=12at2−vt
4. Rearranging the Expression:
- The expression can be rearranged as:
x1(t)−x2(t)=12at2−vt=12at2−vt
5. Analyzing the Expression:
- The expression 12at2−vt is a quadratic function in terms of t.
- The graph of this expression will be a parabola that opens upwards because the coefficient of t2 is positive (12a>0).
6. Finding the Slope:
- To find the slope of the curve at any time t, we differentiate:
ddt(x1(t)−x2(t))=at−v
- At t=0:
ddt(x1(t)−x2(t))∣∣∣t=0=a⋅0−v=−v
- This indicates that at t=0, the slope is negative.
7. Behavior of the Function:
- Initially, x1(t)−x2(t) is negative (since the accelerating body has not gained enough speed to catch up with the constant speed body).
- As time progresses, the term 12at2 will eventually dominate the linear term vt, causing x1(t)−x2(t) to increase and eventually become positive.
Conclusion:
The graph of x1(t)−x2(t) starts below the x-axis (negative) and eventually rises above it (positive), indicating a parabolic shape that opens upwards. The only graph that matches this behavior is option number 2, which has a negative slope at t=0 and eventually becomes positive.
- Body A starts from rest at x=0 at t=0 with a constant acceleration a.
- The position of Body A after time t is given by the equation of motion:
x1(t)=12at2
- Body B passes through x=0 at t=0 and moves with a constant speed v.
- The position of Body B after time t is given by:
x2(t)=vt
- We need to find x1(t)−x2(t):
x1(t)−x2(t)=12at2−vt
- The expression can be rearranged as:
x1(t)−x2(t)=12at2−vt=12at2−vt
- The expression 12at2−vt is a quadratic function in terms of t.
- The graph of this expression will be a parabola that opens upwards because the coefficient of t2 is positive (12a>0).
- To find the slope of the curve at any time t, we differentiate:
ddt(x1(t)−x2(t))=at−v
- At t=0:
ddt(x1(t)−x2(t))∣∣∣t=0=a⋅0−v=−v
- This indicates that at t=0, the slope is negative.
- Initially, x1(t)−x2(t) is negative (since the accelerating body has not gained enough speed to catch up with the constant speed body).
- As time progresses, the term 12at2 will eventually dominate the linear term vt, causing x1(t)−x2(t) to increase and eventually become positive.
The graph of x1(t)−x2(t) starts below the x-axis (negative) and eventually rises above it (positive), indicating a parabolic shape that opens upwards. The only graph that matches this behavior is option number 2, which has a negative slope at t=0 and eventually becomes positive.
Topper's Solved these Questions
Similar Questions
A particle located at x = 0 at time t = 0, starts moving along the positive x-direction with a velocity that varies as v=p√x. The displacement of the particle varies with time as (where, p is constant)
View SolutionA particle located at x=0 at time t=0, starts moving along with the positive x−direction with a velocity 'v' that varies as v=a√x. The displacement of the particle varies with time as
View SolutionA particle located at x=0 at time t=0, starts moving along with the positive x-direction with a velocity v that varies as v=α√x. The displacement of the particle varies with time as
View SolutionA particle located at position x=0, at time t=0, starts moving along the positive x-direction with a velocity v2=αx (where alpha is a positive constant). The displacement of particle is proportional to
View SolutionA wave propagates in a string in the positive x-direction with velocity v. The shape of the string at t=t0 is given by
f(x,t0)=Asin(x2a2). Then the wave equation at any instant t is given by
View SolutionA particle starts moving from position of rest under a constant acceleration. If it travels a distance x in t second, what distance will it travel in next t second?
View SolutionA particle of mass m moving with speed v in position x - direction collides perfectly inelastically with another identical particle moving with same speed in positive y - direction . Find final velocity of the combination.
View SolutionA body lying initially at point (3,7) starts moving with a constant acceleration of 4ˆi. Its position after 3s is given by the coordinates
View SolutionA body of mass m moving with a constant velocity v hits another body of the same mass moving with the same velocity v but in the opposite direction and sticks to it. The velocity of the compound body after collision is
View SolutionA solid metal cube of edge length 2 cm is moving in a positive y-direction at a constant speed of 6 m/s. There is a uniform magnetic field of 0.1 T in the positive z-direction. The potential difference between the two faces of the cube perpendicular to the x-axis, is :
View Solution
