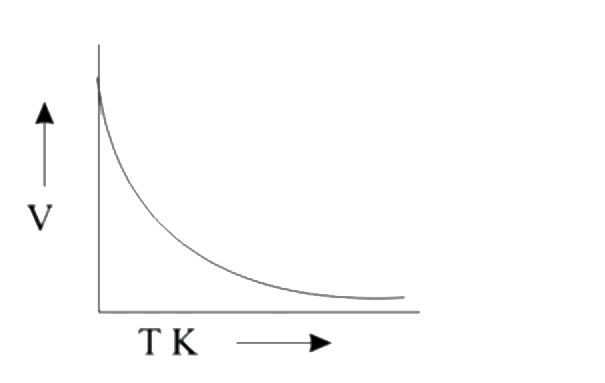
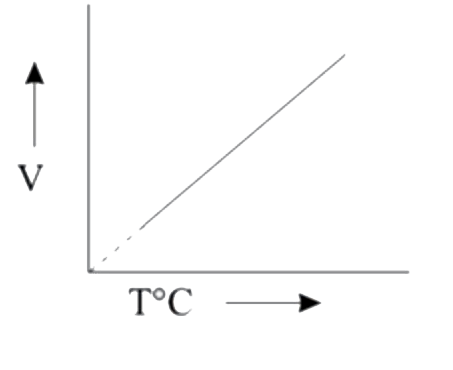
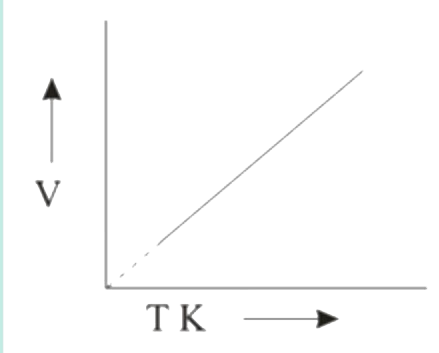
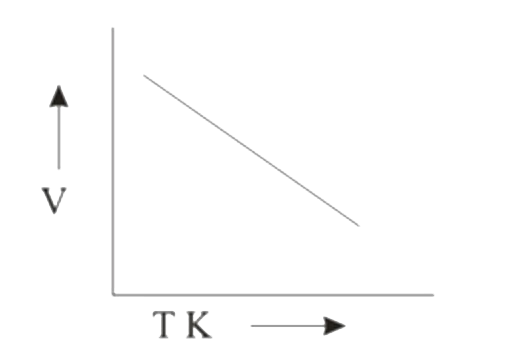
Which of the following is a correct plot of the volume of fixed amount of ideal gas as a function of temperature (at constant pressure)


The correct Answer is:C
To solve the question regarding the correct plot of the volume of a fixed amount of ideal gas as a function of temperature at constant pressure, we can follow these steps:
1. Understand the Ideal Gas Law: The ideal gas law is given by the equation PV=nRT, where:
- P = Pressure
- V = Volume
- n = Number of moles of gas
- R = Ideal gas constant
- T = Temperature in Kelvin
2. Identify Constants: In this scenario, we are keeping pressure P, the number of moles n, and the gas constant R constant. Therefore, the equation can be simplified to relate volume and temperature:
V∝T
This indicates that volume V is directly proportional to temperature T.
3. Formulate the Relationship: To express this relationship mathematically, we can write:
V=kT
where k is a constant of proportionality.
4. Graphing the Relationship: When we plot volume V against temperature T (in Kelvin), the graph will be a straight line passing through the origin (0,0). This is because when T=0, V also equals 0, indicating a linear relationship.
5. Consider Temperature in Celsius: If we consider temperature in degrees Celsius instead of Kelvin, we need to convert it:
T(°C)=T(K)−273.15
This means the relationship becomes:
V=k(T(°C)+273.15)
This indicates that the graph will still be linear but will have a y-intercept at 273.15 when plotted against temperature in Celsius.
6. Evaluate the Options:
- If the plot is of volume V vs. temperature T in Kelvin, it will be a straight line through the origin.
- If the plot is of volume V vs. temperature in degrees Celsius, it will be a straight line with a positive y-intercept at 273.15.
- Any plot showing a negative slope or a curve is incorrect.
7. Conclusion: Based on the analysis, the correct plot is the one that shows a straight line for volume versus temperature in Kelvin (Option 3).
- P = Pressure
- V = Volume
- n = Number of moles of gas
- R = Ideal gas constant
- T = Temperature in Kelvin
V∝T
This indicates that volume V is directly proportional to temperature T.
V=kT
where k is a constant of proportionality.
T(°C)=T(K)−273.15
This means the relationship becomes:
V=k(T(°C)+273.15)
This indicates that the graph will still be linear but will have a y-intercept at 273.15 when plotted against temperature in Celsius.
- If the plot is of volume V vs. temperature T in Kelvin, it will be a straight line through the origin.
- If the plot is of volume V vs. temperature in degrees Celsius, it will be a straight line with a positive y-intercept at 273.15.
- Any plot showing a negative slope or a curve is incorrect.
Similar Questions
Knowledge Check
If the pressure and the volume of certain quantity of ideal gas are halved, then its temperature
Ais doubledBbecomes one-fourthCremains constantDbecome four times
If the volume of a given mass of a gas at constant temperature becomes three times, the pressure will be
View SolutionWhich of the following volume (V) –temperature (T) plots represents the behaviour of one mole of an ideal gas at one atmospheric pressure?

View SolutionWhen a sample of ideal gas is changed from an initial state to a final state, various curves can be plotted for the process like P-V curve, V-T curve,P-T curve etc.
For example, P-V curve for a fixed amount of an ideal gas at constant temperature is a rectangular hyperbola, V-T curve for a fixed amount of an ideal gas at constant volume is again a straight line. However, the shapes may vary if the constant parameters are also changed.
Now, answer the following questions :
Which of the following graphs is not possible for a fixed amount of ideal gas upon moving from initial state A to final state B :
View SolutionWhich of the following volume-temperature (V−T) plots represents the behaviour of 1mole of an ideal gas at the atmospheric pressure?
View SolutionWhich of the following volume-temperature (V−I) plots represents the behaviour of 1mole of an ideal gas at the atmospheric pressure?
View SolutionWhich of the following shown the correct relationship between the pressure 'P' and density ρ of an ideal gas at constant temperature?
View SolutionWhich of the following shows correct relation between volume and temperature at constant pressure for a given amount of gas
View Solution
