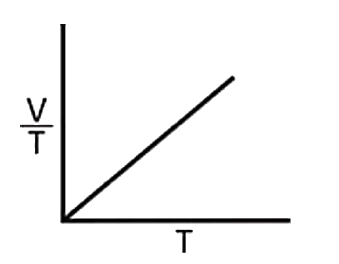
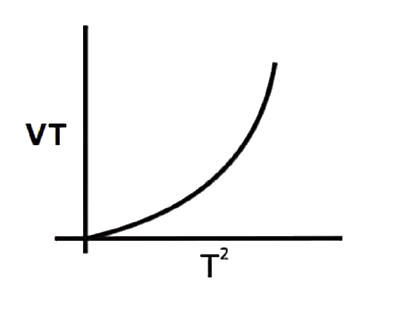
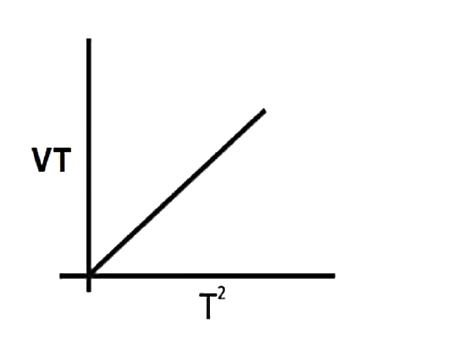
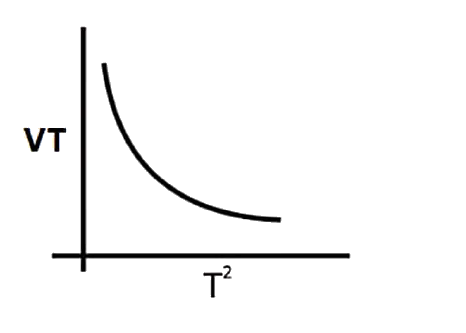
Which of the following curve is correct for a given amount of an ideal gas at constant pressure?
The correct Answer is:C
To determine the correct curve for a given amount of an ideal gas at constant pressure, we can analyze the relationship between volume (V) and temperature (T) using the ideal gas law.
1. Understand the Ideal Gas Law:
The ideal gas law is given by the equation PV=nRT, where:
- P = pressure
- V = volume
- n = number of moles of gas
- R = ideal gas constant
- T = temperature in Kelvin
2. Constant Pressure Condition:
Since we are considering a constant pressure scenario, we can rearrange the ideal gas law to focus on volume and temperature:
V=nRTP
Here, nRP is a constant (let's call it k). Thus, we can write:
V=kT
3. Relationship Between V and T:
From the equation V=kT, we see that volume (V) is directly proportional to temperature (T) when pressure is constant. This means that if we plot V against T, we will get a straight line that passes through the origin (0,0).
4. Graphical Representation:
If we multiply both sides of the equation V=kT by temperature (T), we get:
VT=kT2
This indicates a parabolic relationship between VT and T, which is a quadratic equation. However, since we are interested in the linear relationship between V and T, we focus on the original equation.
5. Analyzing the Options:
- The first option suggests a constant value for VT, which is incorrect as VT varies with T2.
- The second option shows a graph of VT versus T2, which should be a straight line starting from the origin.
- The third option also shows a linear relationship starting from the origin.
6. Conclusion:
The correct graph for a given amount of ideal gas at constant pressure is the one that represents a linear relationship between VT and T2, starting from the origin. Thus, the answer is the third option.
The ideal gas law is given by the equation PV=nRT, where:
- P = pressure
- V = volume
- n = number of moles of gas
- R = ideal gas constant
- T = temperature in Kelvin
Since we are considering a constant pressure scenario, we can rearrange the ideal gas law to focus on volume and temperature:
V=nRTP
Here, nRP is a constant (let's call it k). Thus, we can write:
V=kT
From the equation V=kT, we see that volume (V) is directly proportional to temperature (T) when pressure is constant. This means that if we plot V against T, we will get a straight line that passes through the origin (0,0).
If we multiply both sides of the equation V=kT by temperature (T), we get:
VT=kT2
This indicates a parabolic relationship between VT and T, which is a quadratic equation. However, since we are interested in the linear relationship between V and T, we focus on the original equation.
- The first option suggests a constant value for VT, which is incorrect as VT varies with T2.
- The second option shows a graph of VT versus T2, which should be a straight line starting from the origin.
- The third option also shows a linear relationship starting from the origin.
The correct graph for a given amount of ideal gas at constant pressure is the one that represents a linear relationship between VT and T2, starting from the origin. Thus, the answer is the third option.
Similar Questions
Which of the following curve is correct for an ideal gas ?
View SolutionWhich of the following relation is correct for an ideal gas ?
View SolutionIf an ideal gas is heated at constant pressure :
View SolutionWhich of the following shows correct relation between volume and temperature at constant pressure for a given amount of gas
View SolutionHeat supplied to an ideal gas sample at constant Pressure :
View SolutionWhich of the following is a correct plot of the volume of fixed amount of ideal gas as a function of temperature (at constant pressure)
View SolutionWhich of the following is correct for free expansion of ideal gas
under isothermal condition :-
View SolutionWhen a sample of ideal gas is changed from an initial state to a final state, various curves can be plotted for the process like P-V curve, V-T curve,P-T curve etc.
For example, P-V curve for a fixed amount of an ideal gas at constant temperature is a rectangular hyperbola, V-T curve for a fixed amount of an ideal gas at constant volume is again a straight line. However, the shapes may vary if the constant parameters are also changed.
Now, answer the following questions :
Which of the following graphs is not possible for a fixed amount of ideal gas upon moving from initial state A to final state B :
View SolutionWhen a sample of ideal gas is changed from an initial state to a final state, various curves can be plotted for the process like P-V curve, V-T curve,P-T curve etc.
For example, P-V curve for a fixed amount of an ideal gas at constant temperature is a rectangular hyperbola, V-T curve for a fixed amount of an ideal gas at constant volume is again a straight line. However, the shapes may vary if the constant parameters are also changed.
Now, answer the following questions :
From the given plot between Z and P for a real gas the correct is :
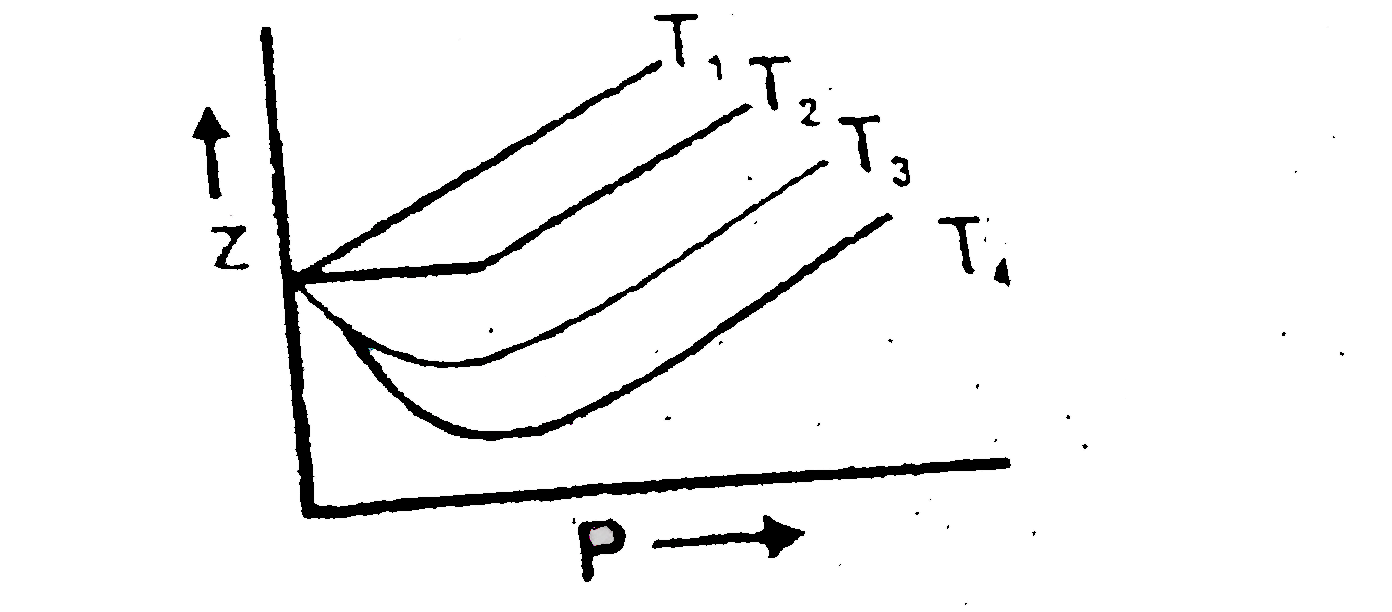
View SolutionWhen a sample of ideal gas is changed from an initial state to a final state, various curves can be plotted for the process like P-V curve, V-T curve,P-T curve etc.
For example, P-V curve for a fixed amount of an ideal gas at constant temperature is a rectangular hyperbola, V-T curve for a fixed amount of an ideal gas at constant volume is again a straight line. However, the shapes may vary if the constant parameters are also changed.
Now, answer the following questions :
Two Vander waals gases have same value 'b' but different 'a' value then which of the following statement is correct under simialr condition .
View Solution
