Define the terms stress and strain and also state their SI units. Draw the stress versus strain graph for a metallic wire, when stretched upto the breaking point.
Step-by-Step Solution
1. Definition of Stress:
Stress is defined as the restoring force per unit area of the cross-section of a deformed body. It quantifies how much internal force is being exerted by the material in response to an external force that is trying to deform it.
Mathematical Representation:
Stress(σ)=Force(F)Area(A)
2. SI Unit of Stress:
The SI unit of stress is Pascal (Pa), which is equivalent to Newton per square meter (N/m²).
3. Definition of Strain:
Strain is defined as the ratio of the change in length (deformation) to the original length of the material. It measures how much a material deforms relative to its original size.
Mathematical Representation:
Strain(ϵ)=ΔLL0
where ΔL is the change in length and L0 is the original length.
4. SI Unit of Strain:
Strain is a dimensionless quantity, meaning it has no unit since it is a ratio of lengths.
5. Stress vs. Strain Graph:
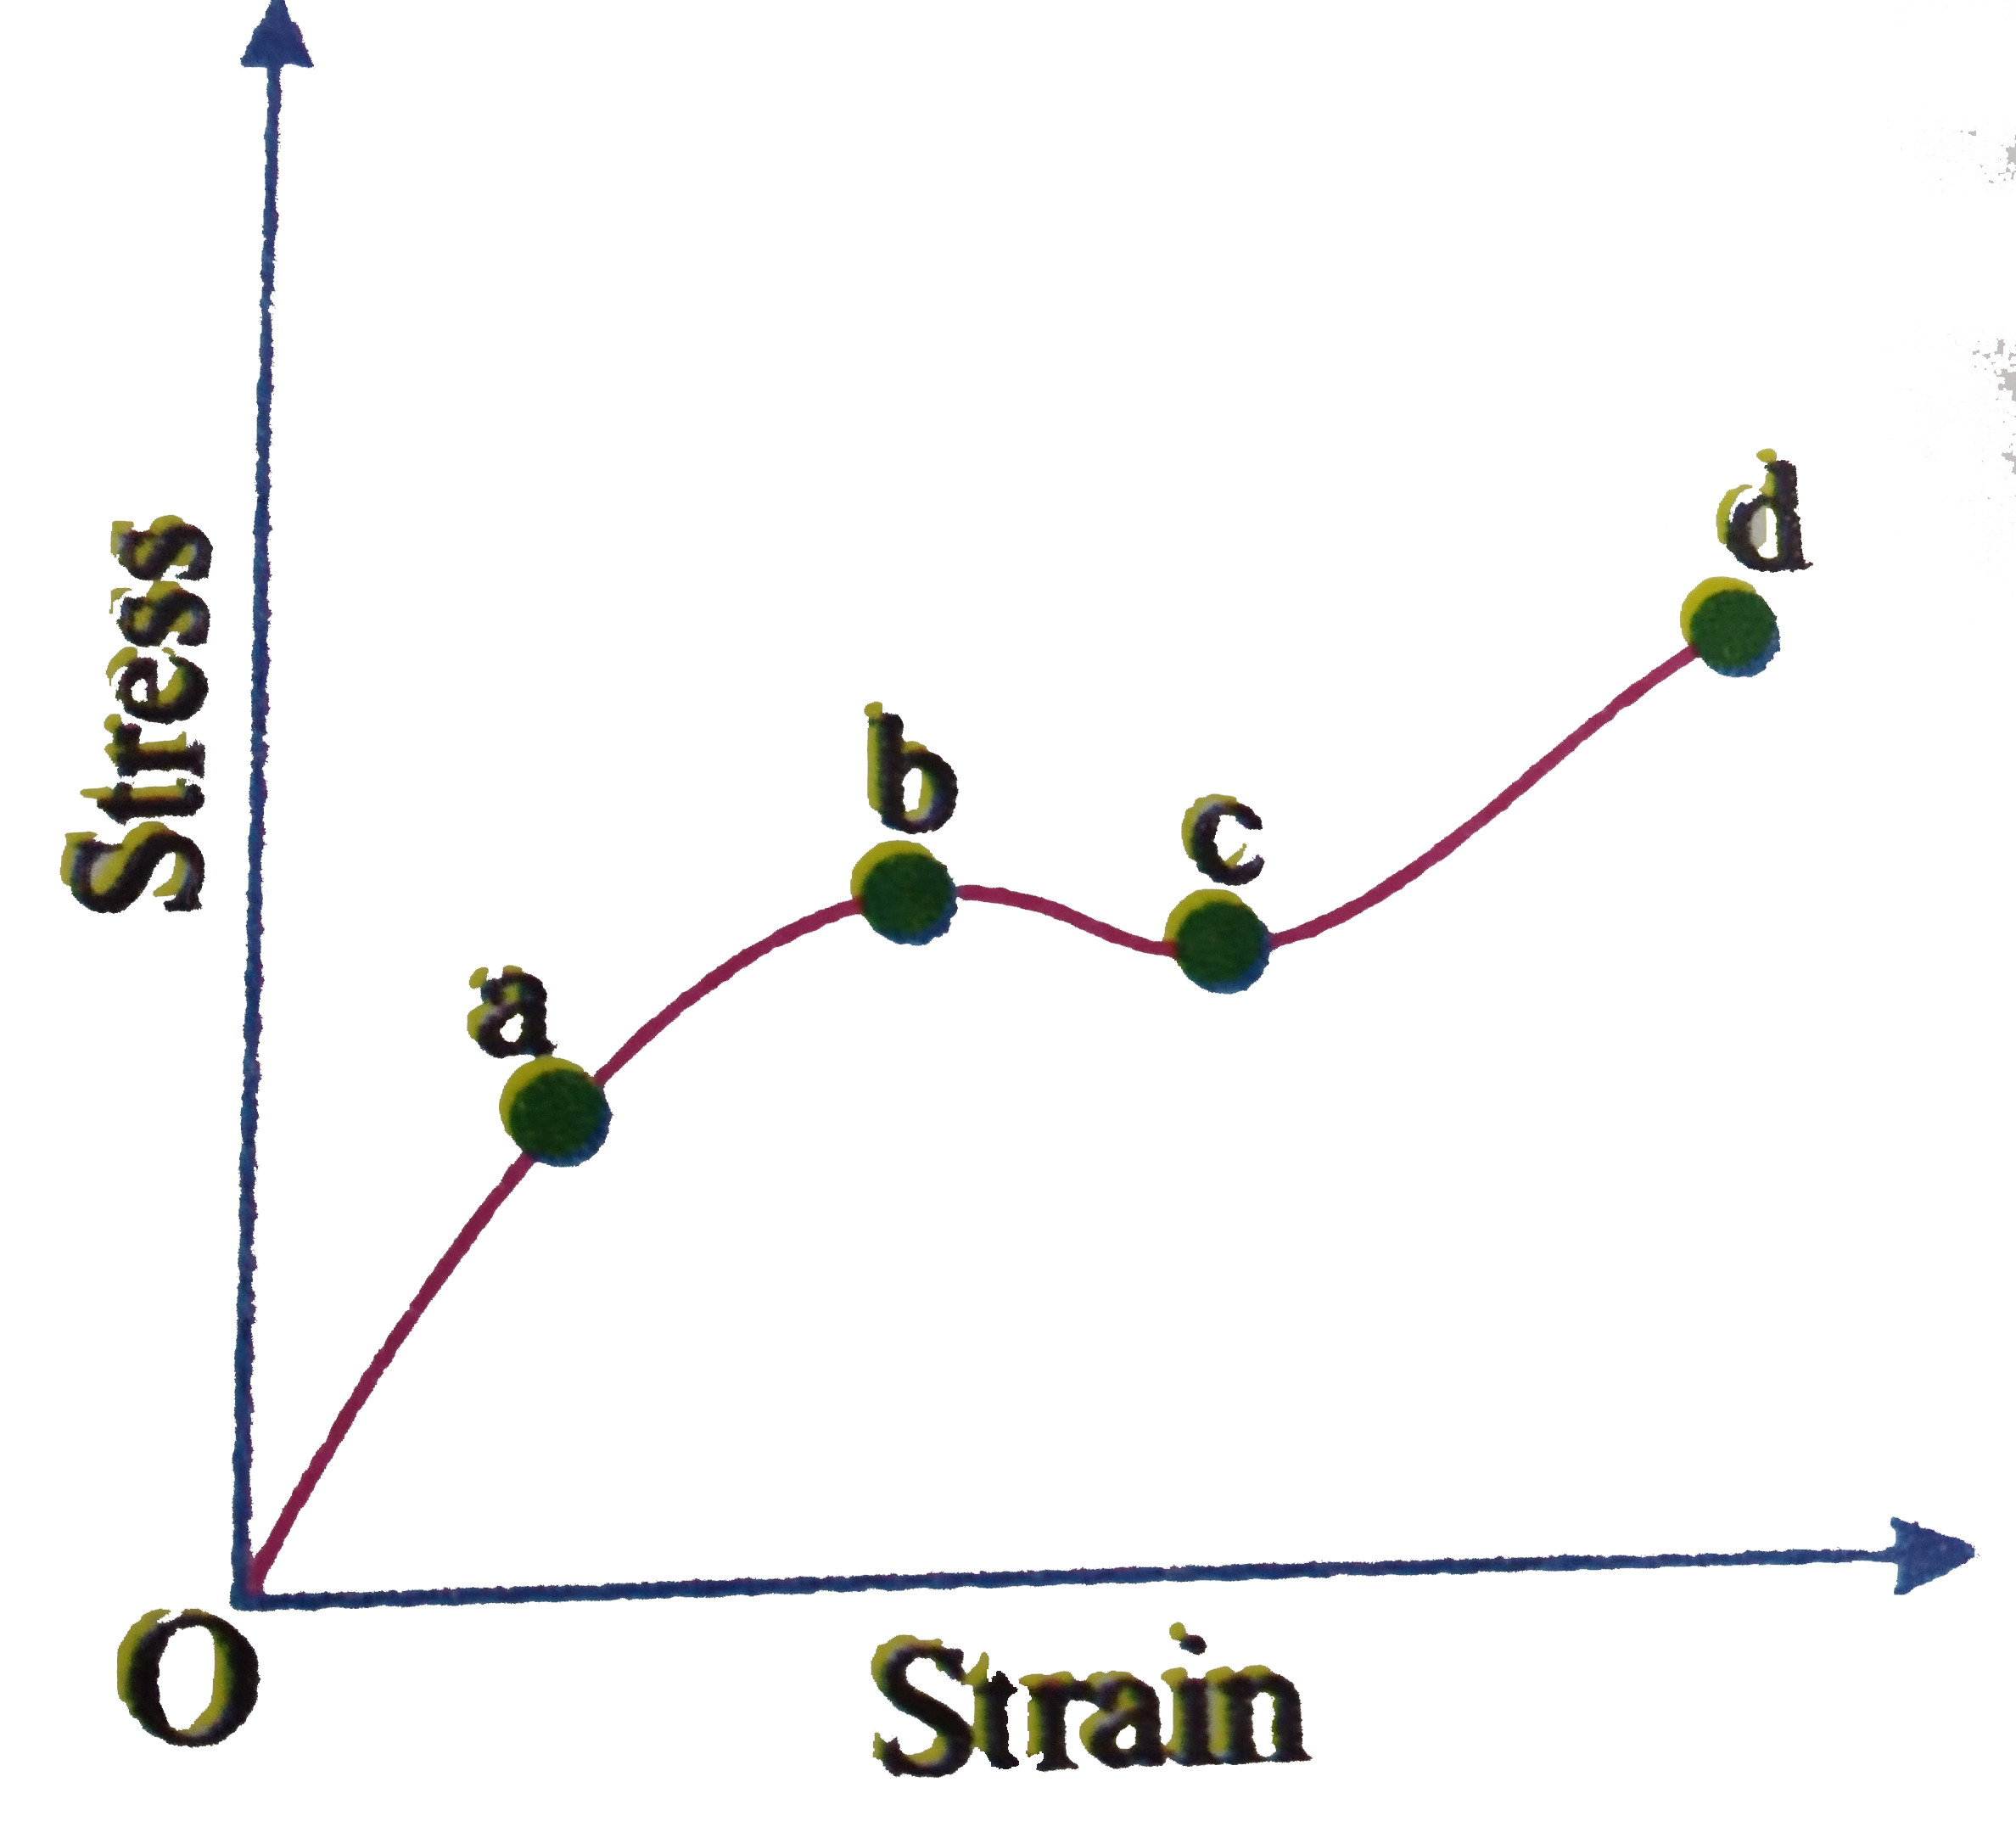
To draw the stress versus strain graph for a metallic wire when stretched up to the breaking point, follow these steps:
- Initial Linear Region: As stress is applied, strain increases linearly, following Hooke's Law. This region is characterized by a straight line from the origin, indicating that stress and strain are proportional.
- Yield Point (A): At a certain point, known as the yield point or elastic limit, the material begins to deform plastically. Beyond this point, the material will not return to its original shape when the stress is removed.
- Plastic Region: After the yield point, the graph shows a curve indicating that the material is undergoing permanent deformation. The slope of the graph decreases, showing that additional stress results in less strain than before.
- Ultimate Strength: The maximum point on the graph indicates the ultimate strength of the material, where it can withstand the highest stress before failure.
- Fracture Point: Finally, as stress is reduced after reaching the ultimate strength, the material continues to deform until it reaches the fracture point, where it ultimately breaks.
6. Graph Representation:
- The x-axis represents strain, and the y-axis represents stress.
- The graph starts at the origin, rises linearly (Hooke's Law), reaches the yield point, curves into the plastic region, peaks at ultimate strength, and then drops to the fracture point.
Stress is defined as the restoring force per unit area of the cross-section of a deformed body. It quantifies how much internal force is being exerted by the material in response to an external force that is trying to deform it.
Stress(σ)=Force(F)Area(A)
The SI unit of stress is Pascal (Pa), which is equivalent to Newton per square meter (N/m²).
Strain is defined as the ratio of the change in length (deformation) to the original length of the material. It measures how much a material deforms relative to its original size.
Strain(ϵ)=ΔLL0
where ΔL is the change in length and L0 is the original length.
Strain is a dimensionless quantity, meaning it has no unit since it is a ratio of lengths.
To draw the stress versus strain graph for a metallic wire when stretched up to the breaking point, follow these steps:
- Yield Point (A): At a certain point, known as the yield point or elastic limit, the material begins to deform plastically. Beyond this point, the material will not return to its original shape when the stress is removed.
- Plastic Region: After the yield point, the graph shows a curve indicating that the material is undergoing permanent deformation. The slope of the graph decreases, showing that additional stress results in less strain than before.
- Ultimate Strength: The maximum point on the graph indicates the ultimate strength of the material, where it can withstand the highest stress before failure.
- Fracture Point: Finally, as stress is reduced after reaching the ultimate strength, the material continues to deform until it reaches the fracture point, where it ultimately breaks.
- The x-axis represents strain, and the y-axis represents stress.
- The graph starts at the origin, rises linearly (Hooke's Law), reaches the yield point, curves into the plastic region, peaks at ultimate strength, and then drops to the fracture point.
Topper's Solved these Questions
- Mechanical Properties of SolidsBOOK - SL ARORACHAPTER - Mechanical Properties of SolidsEXERCISE - Example
113 Videos
- Mechanical Properties of fluidsBOOK - SL ARORACHAPTER - Mechanical Properties of fluidsEXERCISE - Exercise
459 Videos
- MECHANICSBOOK - SL ARORACHAPTER - MECHANICSEXERCISE - Exercise
341 Videos
Similar Questions
Knowledge Check
The point on stress-strain graph at which the plastic flow starts is known as
Aelastic limitBneck formationCyield pointDbreaking pointA graph is shown between stress and strain for a metal. The part in which Hooke's law holds good is
 AOABABCBCDOD
Define the terms resistivity and conductivity and state their S. I. units. Draw a graph showing the variation of resistivity with temperature for a typical semiconductor.
View SolutionDefine the term electrical conductivity of a metallic wire. Write its SI unit.
View SolutionDefine the term electrical conductivity of a metallic wire. Write its SI unit.
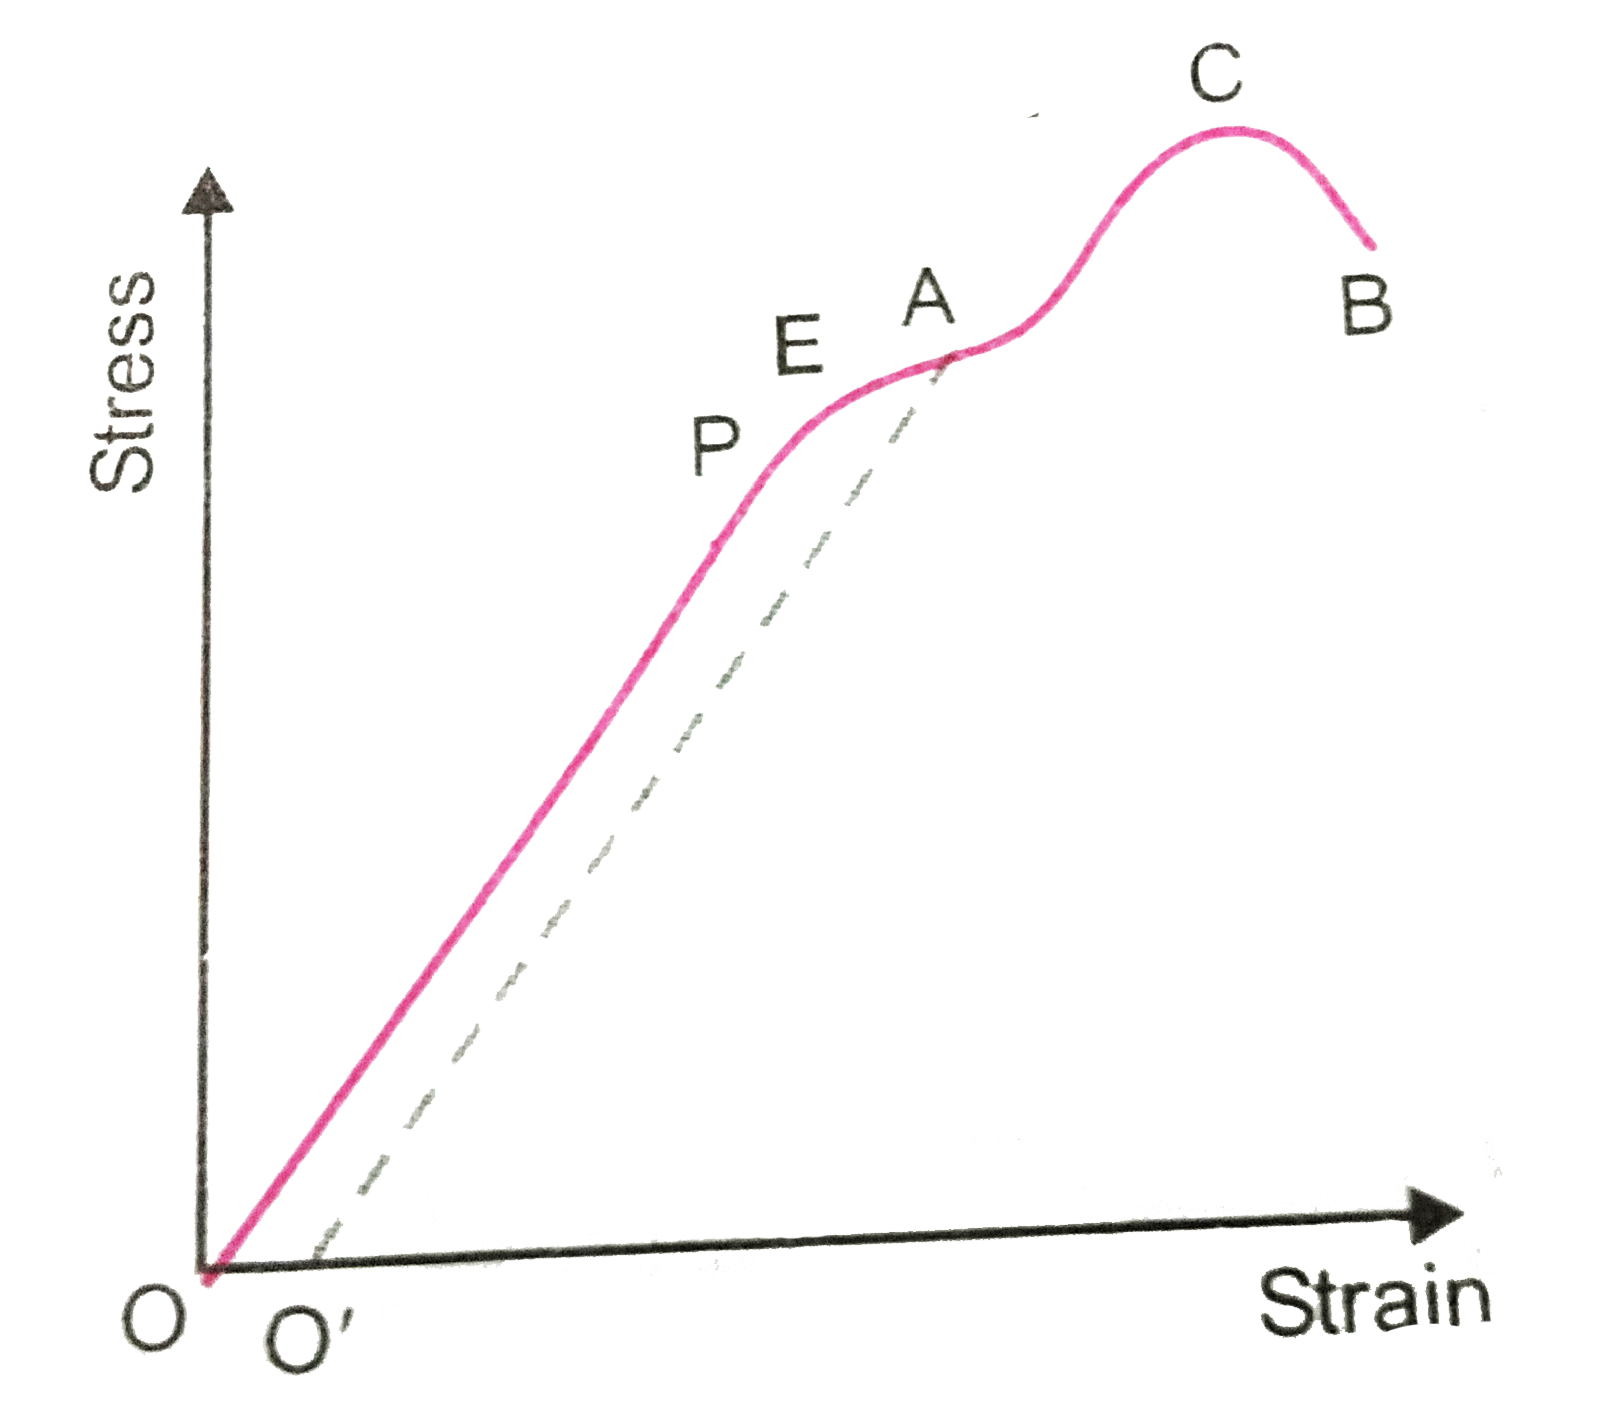
View SolutionThe stress strain graph for a metal wire is shown in the fig. Upto the point E, the wire returns to its original state O along the curve EPO, when it is gradually unloaded. Point B corresponds to the fracture of the wire. (a) Upto what point on the curve is Hooke's law obeyed? (this point some times called proportional limits).

(b) Which point on the curve corresponding to elastic limet or yield point of the wire?
(c ) Indicate teh elastice and plastic regions of the stree-strain graph.
(d) Describe what happens when the wire is loaded upto a stress corresponding to the point A on the graph and then unloaded gradulally. In particular explain the dotted curve.
(e) Wht is peculiar about the protion of the stree- strain graph from C to B? Upto what stress can the wire be subjected with out causing fracture?
View SolutionDefine the term electrical conductivity of a metallic wire. Write its SI unit.
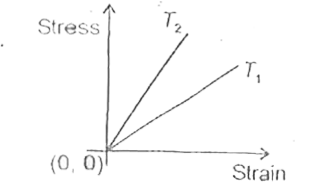
View SolutionFigure shows graph between stress and strain for a uniform wire at wo different temperatures. Then

View Solution