Discuss stress vs. strain graph, explaining clearly the terms elastic limit and permanent set.
To discuss the stress vs. strain graph and explain the terms "elastic limit" and "permanent set," we will break down the concepts step by step.
Step 1: Understanding Stress and Strain
- Stress (σ) is defined as the force (F) applied per unit area (A) of a material. It is given by the formula:
σ=FA
- Strain (ε) is the measure of deformation representing the displacement between particles in a material body. It is defined as the change in length (ΔL) divided by the original length (L):
ϵ=ΔLL
Step 2: The Stress vs. Strain Graph
- When we plot stress (σ) on the y-axis and strain (ε) on the x-axis, we typically observe a linear relationship at first, which is described by Hooke's Law. This law states that stress is directly proportional to strain within the elastic limit of the material.
Step 3: Identifying the Elastic Limit
- The elastic limit is the maximum stress that a material can withstand without undergoing permanent deformation. In the graph, this is the point beyond which the linear relationship between stress and strain no longer holds.
- Up to this point, if the applied stress is removed, the material will return to its original shape and size, meaning the strain will return to zero.
Step 4: Understanding Permanent Set
- When the applied stress exceeds the elastic limit, the material begins to deform permanently. This means that even if the stress is removed, the material does not return to its original shape.
- The deformation that remains after the removal of the stress is known as the permanent set. In the graph, this is represented by the strain that remains even when the stress is zero.
Step 5: Other Important Points on the Graph
- Beyond the elastic limit, the graph continues to rise until it reaches the ultimate strength, which is the maximum stress the material can withstand before necking occurs.
- Finally, the graph ends at the fracture point, where the material breaks.
Summary
In summary, the stress vs. strain graph illustrates the relationship between stress and strain in materials. The elastic limit is the point beyond which a material will not return to its original shape after the stress is removed, leading to a permanent set, which is the residual strain that remains.
---
- Stress (σ) is defined as the force (F) applied per unit area (A) of a material. It is given by the formula:
σ=FA
- Strain (ε) is the measure of deformation representing the displacement between particles in a material body. It is defined as the change in length (ΔL) divided by the original length (L):
ϵ=ΔLL
- When we plot stress (σ) on the y-axis and strain (ε) on the x-axis, we typically observe a linear relationship at first, which is described by Hooke's Law. This law states that stress is directly proportional to strain within the elastic limit of the material.
- The elastic limit is the maximum stress that a material can withstand without undergoing permanent deformation. In the graph, this is the point beyond which the linear relationship between stress and strain no longer holds.
- Up to this point, if the applied stress is removed, the material will return to its original shape and size, meaning the strain will return to zero.
- When the applied stress exceeds the elastic limit, the material begins to deform permanently. This means that even if the stress is removed, the material does not return to its original shape.
- The deformation that remains after the removal of the stress is known as the permanent set. In the graph, this is represented by the strain that remains even when the stress is zero.
- Beyond the elastic limit, the graph continues to rise until it reaches the ultimate strength, which is the maximum stress the material can withstand before necking occurs.
- Finally, the graph ends at the fracture point, where the material breaks.
In summary, the stress vs. strain graph illustrates the relationship between stress and strain in materials. The elastic limit is the point beyond which a material will not return to its original shape after the stress is removed, leading to a permanent set, which is the residual strain that remains.
Topper's Solved these Questions
- Mechanical Properties of SolidsBook:SL ARORAChapter:Mechanical Properties of SolidsExercise:Example
Explore 113 Videos
- Mechanical Properties of fluidsBook:SL ARORAChapter:Mechanical Properties of fluidsExercise:Exercise
Explore 459 Videos
- MECHANICSBook:SL ARORAChapter:MECHANICSExercise:Exercise
Explore 341 Videos
Similar Questions
Knowledge Check
When strain is produced in a body within elastic limit, its internal energy
ARemains constantBDecreasesCIncreasesDNone of the aboveThe point on stress-strain graph at which the plastic flow starts is known as
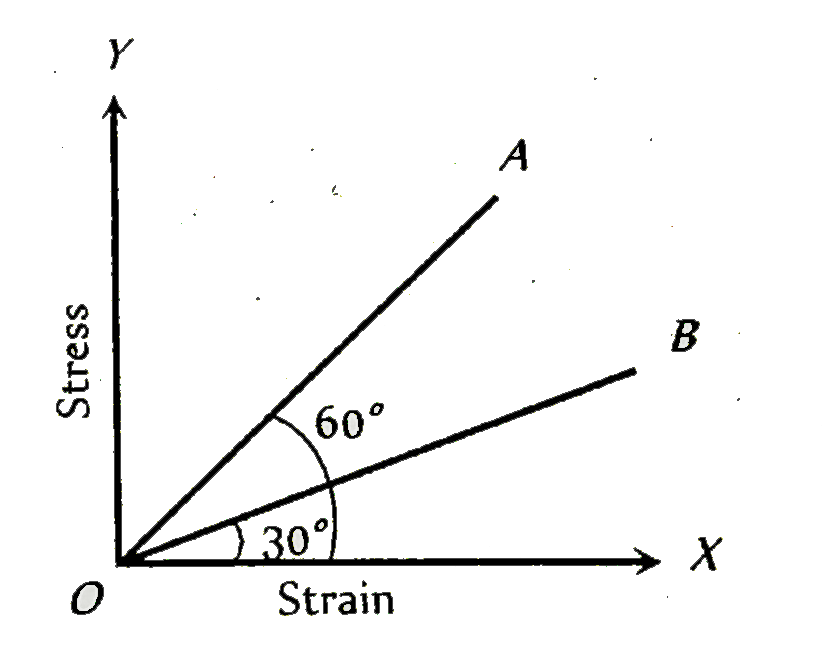
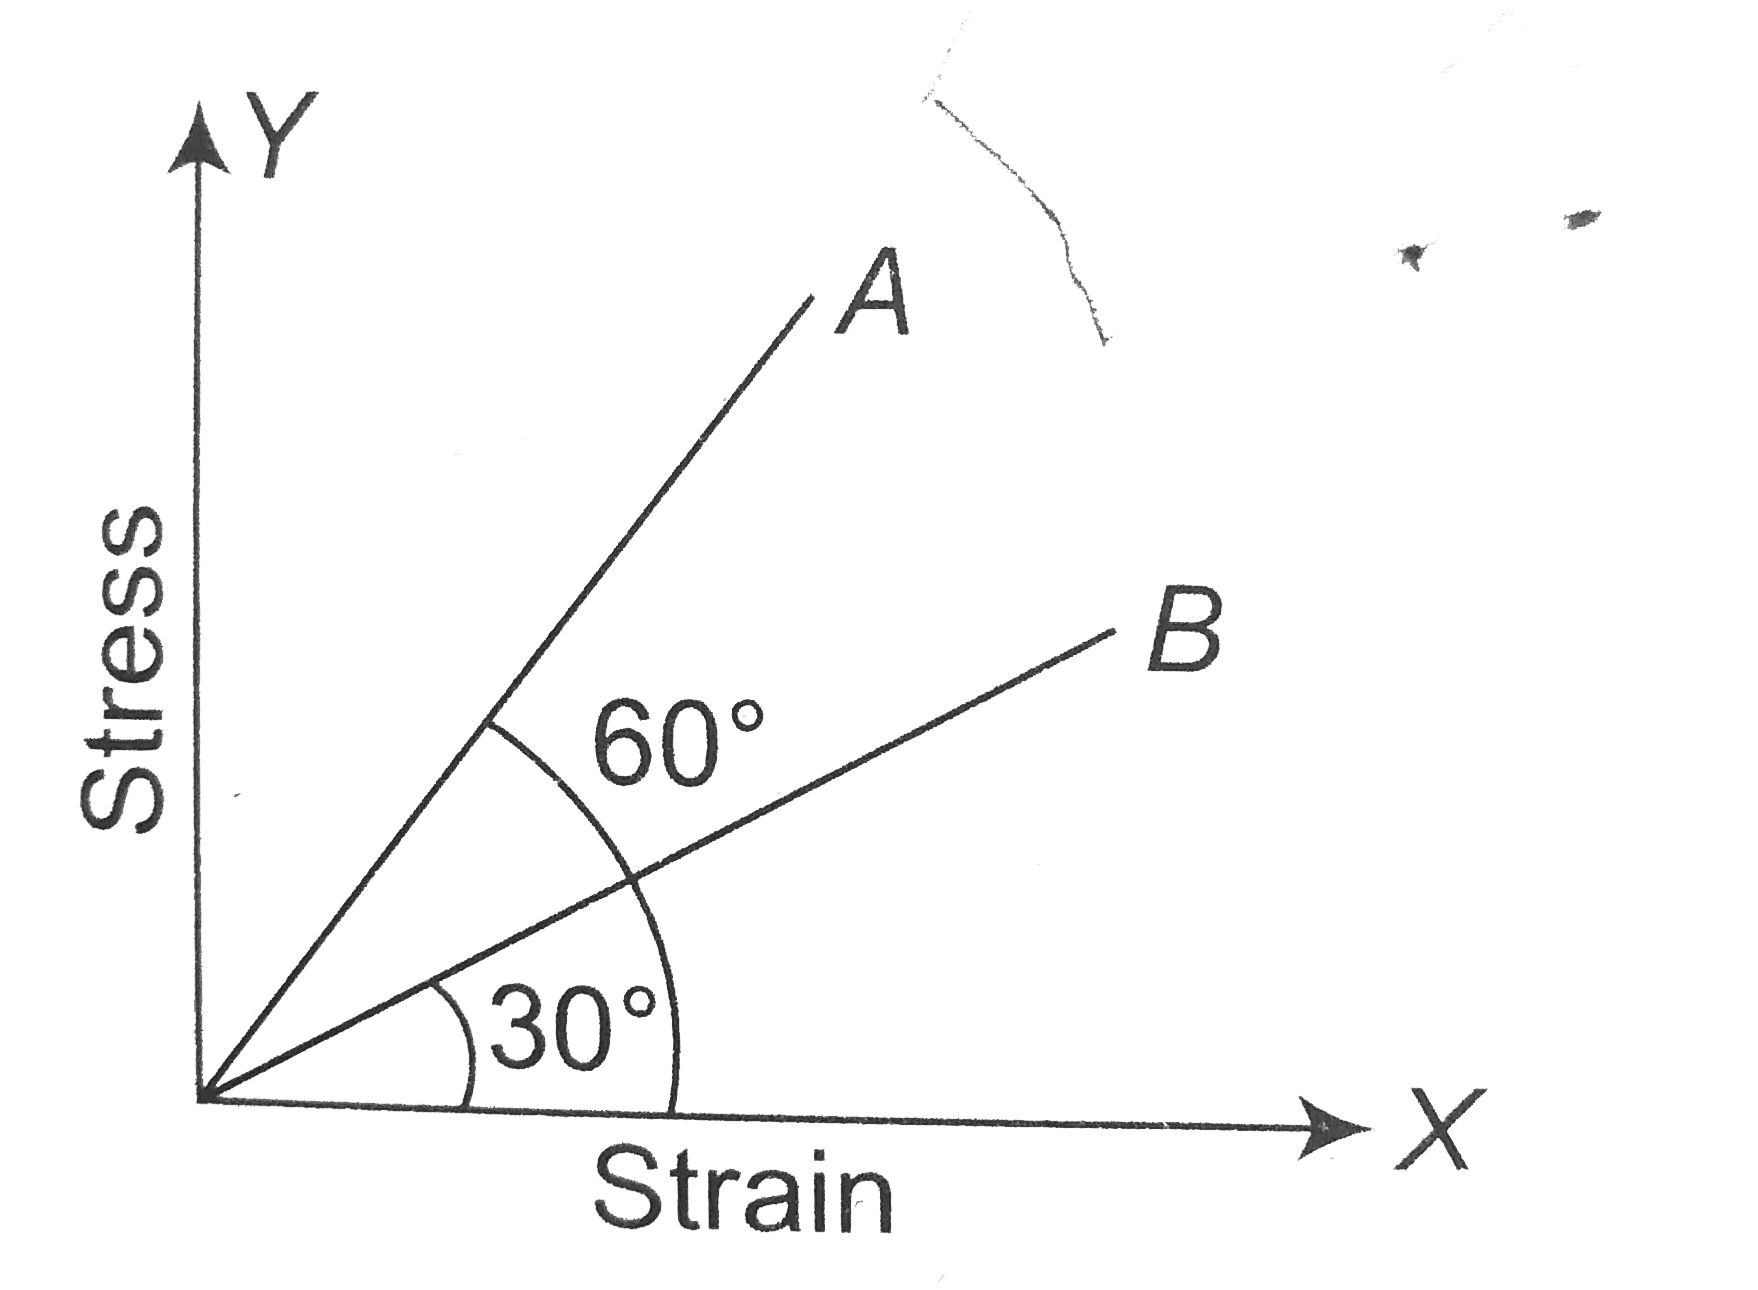
Aelastic limitBneck formationCyield pointDbreaking pointThe stress versus strain graphs for wires of two materials A and B are as shown in the figure. If YAandYB are the younng's moduli of the materials, then
 AYB=2YABYA=YBCYB=3YADYA=3YB
Explain the terms (i) stress, (ii) strain.
View SolutionDraw stress-strain curve for elastomers (elastic tissue of Aorta)
View SolutionDefine the terms stress and strain and also state their SI units. Draw the stress versus strain graph for a metallic wire, when stretched upto the breaking point.
View Solution
The stress versus strain graphs for wires of two materials A and B are as shown in the figure. If YA and YB are the Young's moduli of the materials then
View SolutionWhen the stress is increased beyond the elastic limit, the length of the wire starts increasing without increasing the force. This point is called
View Solution
