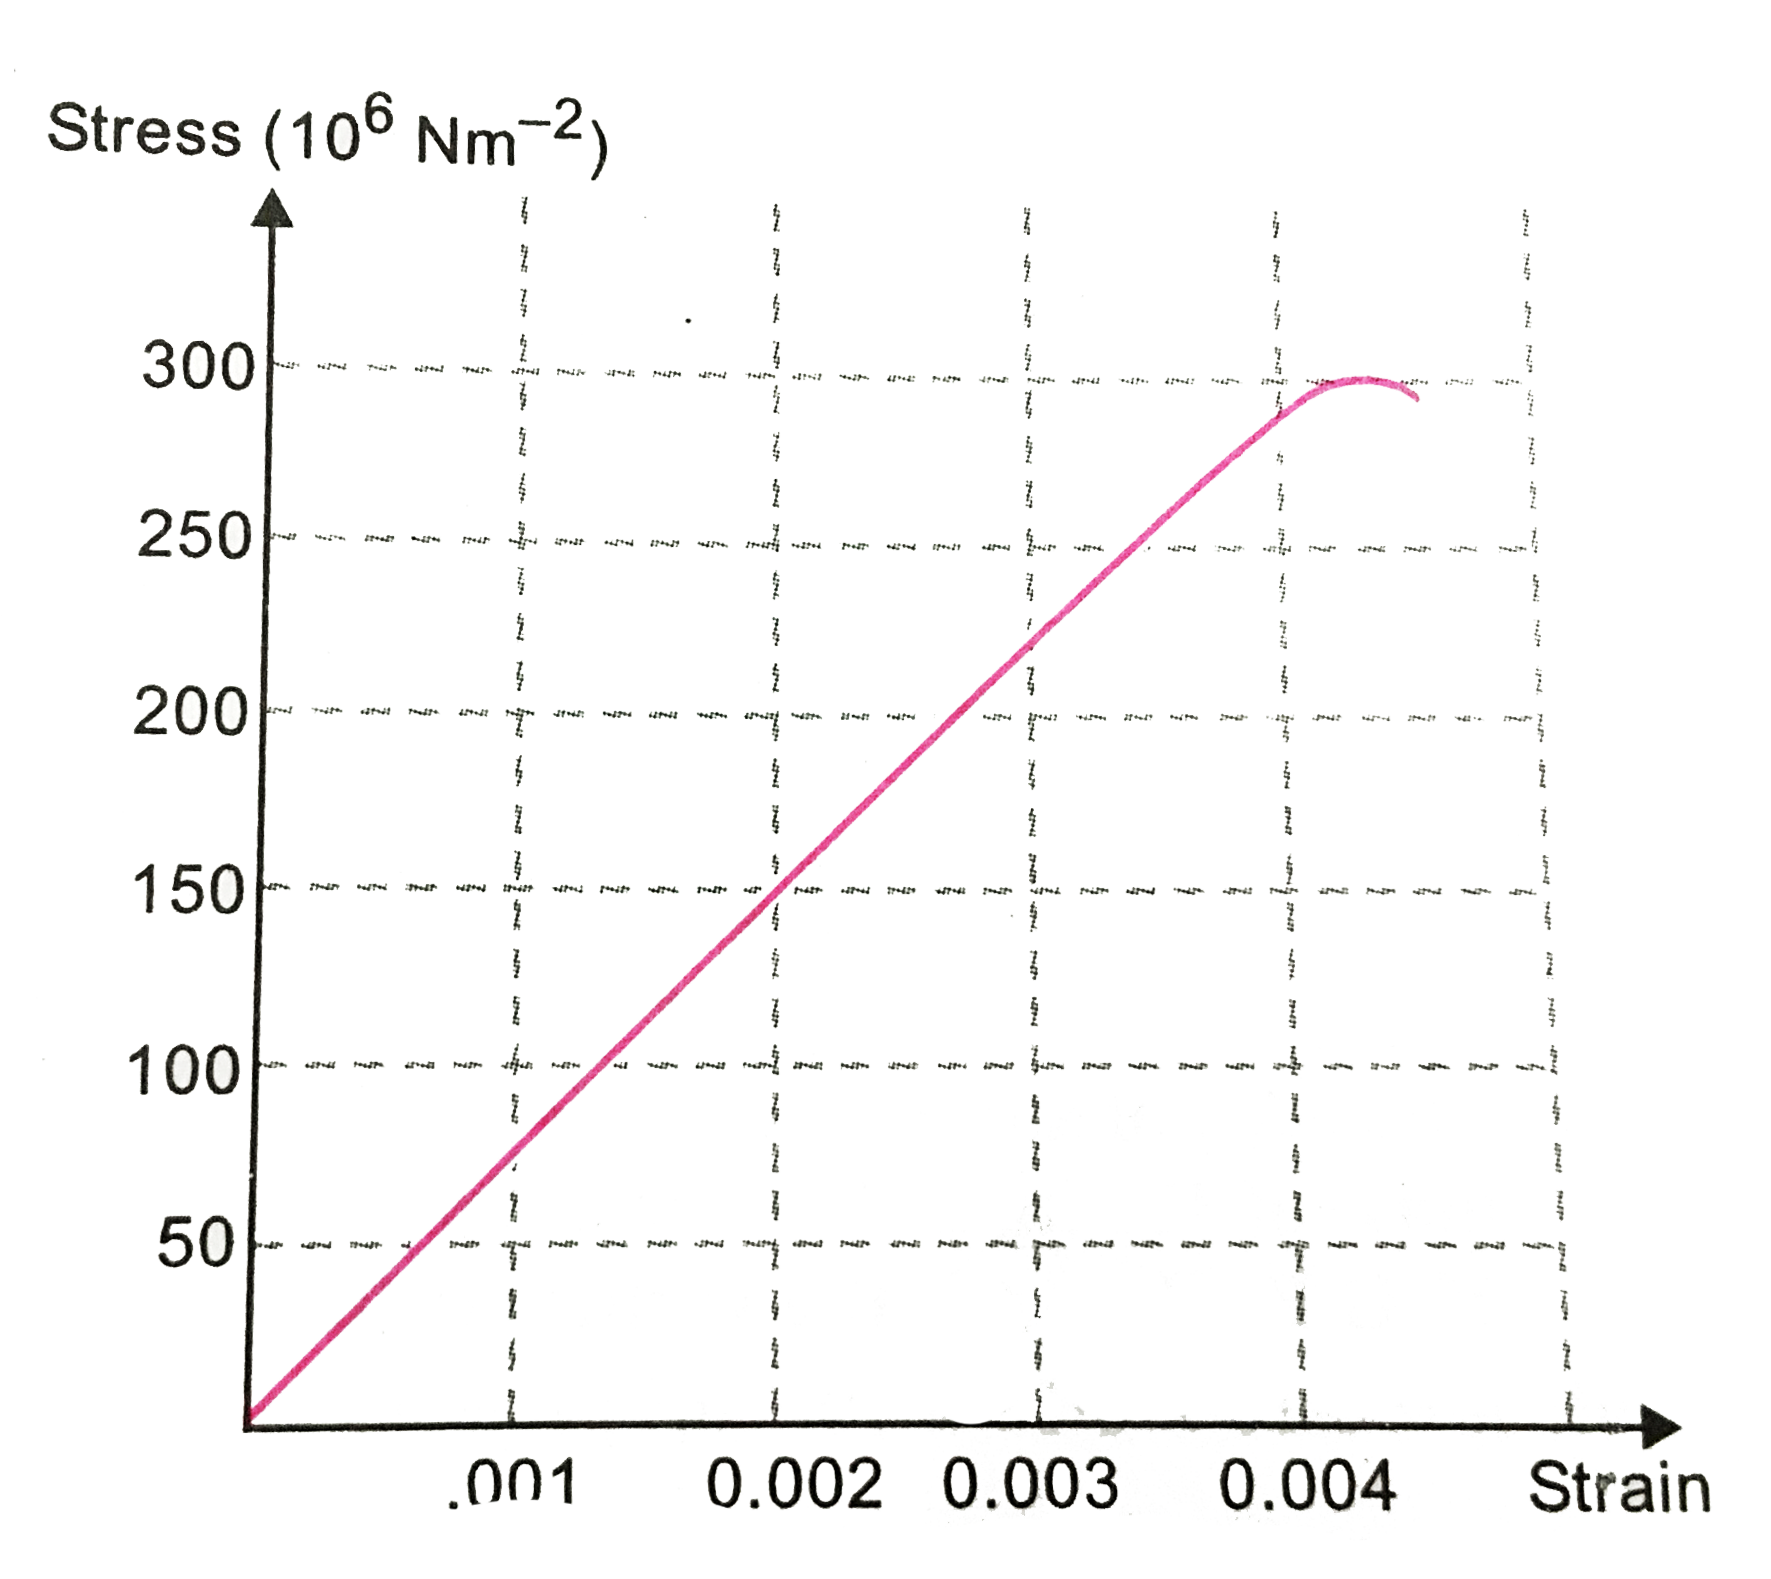
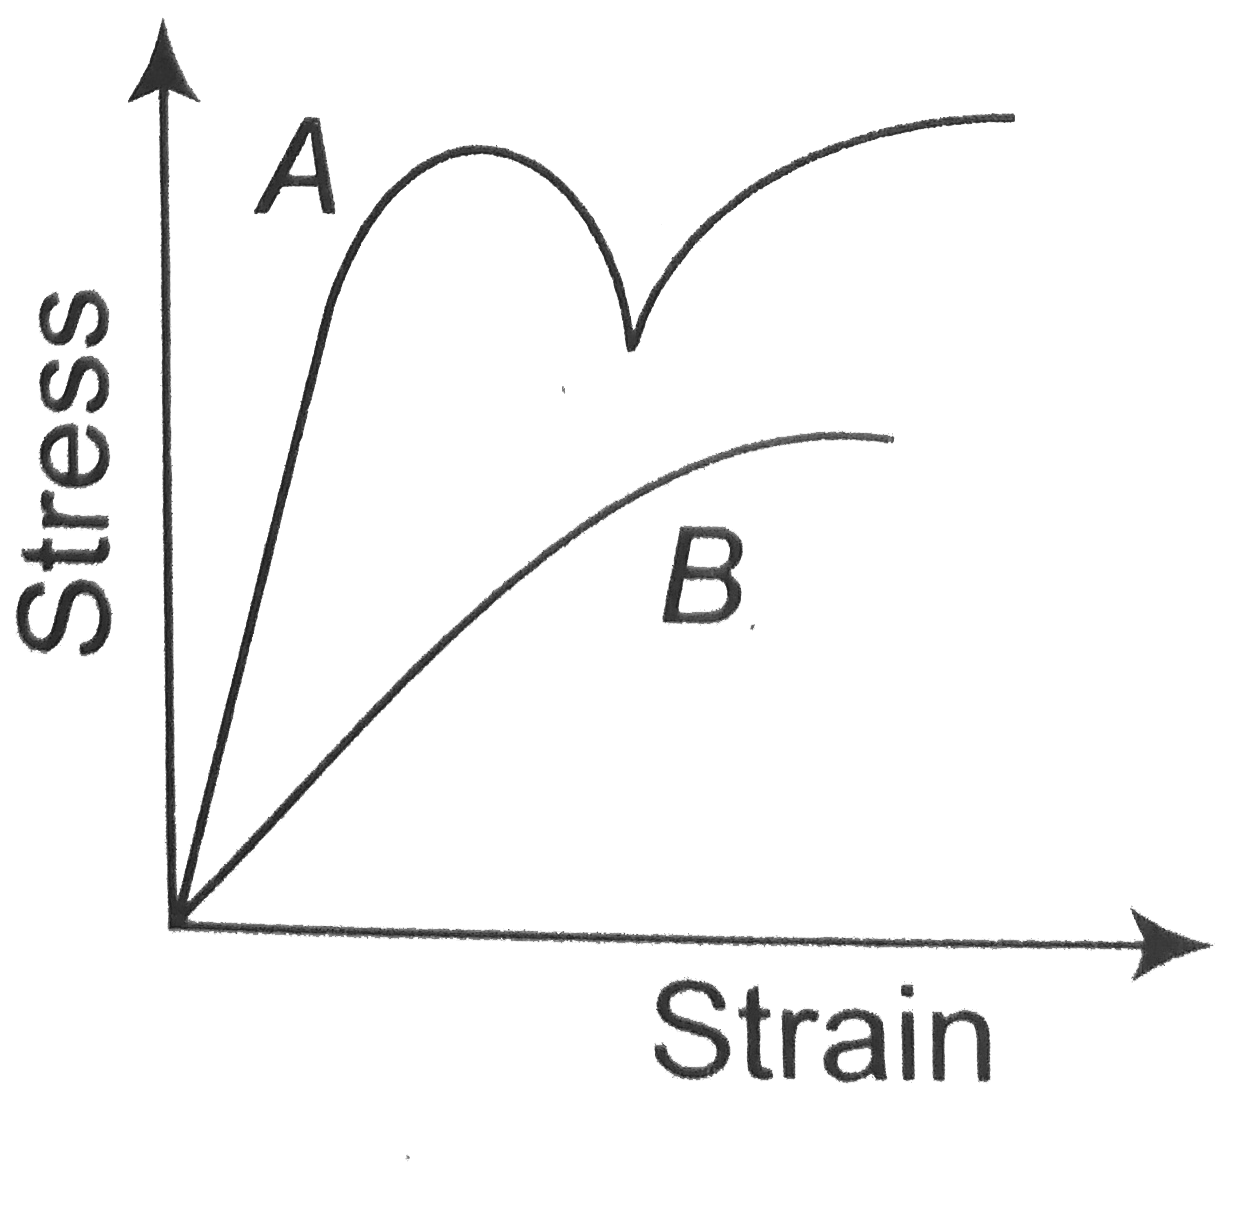
Draw stress-strain curve for elastomers (elastic tissue of Aorta)
Step by step video & image solution for Draw stress-strain curve for elastomers (elastic tissue of Aorta) by Physics experts to help you in doubts & scoring excellent marks in Class 11 exams.
Updated on:21/07/2023Topper's Solved these Questions
- PROPERTIES OF MATTERBOOK - CBSE COMPLEMENTARY MATERIALCHAPTER - PROPERTIES OF MATTEREXERCISE - Short Answer Type Questions (2 Marks)
25 Videos
- PROPERTIES OF MATTERBOOK - CBSE COMPLEMENTARY MATERIALCHAPTER - PROPERTIES OF MATTEREXERCISE - Short Answer Type Questions (3 Marks)
24 Videos
- NEWTON'S LAWS OF MOTIONBOOK - CBSE COMPLEMENTARY MATERIALCHAPTER - NEWTON'S LAWS OF MOTIONEXERCISE - Laws Of Motion
20 Videos
- ROTATIONAL MOTION BOOK - CBSE COMPLEMENTARY MATERIALCHAPTER - ROTATIONAL MOTION EXERCISE - MULTIPLE CHOICE QUESTIONS
20 Videos
Similar Questions
Knowledge Check
Stress-strain curve for four metals are shown in figure. The maximum Young's modulus of elasticity is for metal
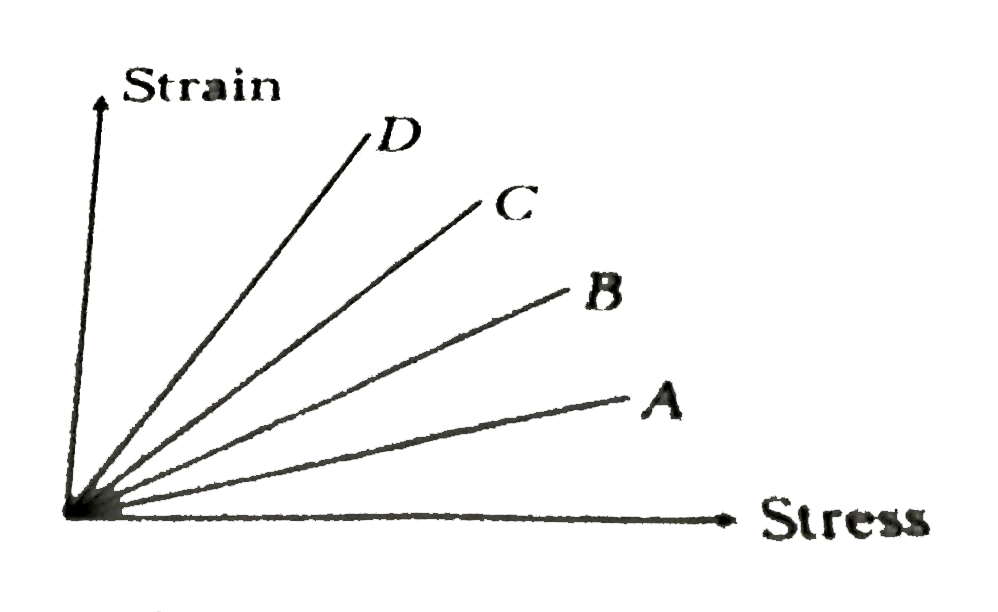 AABBCCDD
Assertion Upto elastic limit of a stress-strain curve, the steel wire tends to regain its original shape when stress is removed.
Reason Within elastic limit, the wire follows Hooke's law.AIf both Assertion and Reason are true and Reason is the correct explanation of Assertion.BIf both Assertion and Reason are true but Reason is not the correct explanation of Assertion.CIf Assertion is true but Reason is false.DIf both Assertion and Reason are false.The diagram shows stress v/s strain curve for the materials A and B. From the curves we infer that
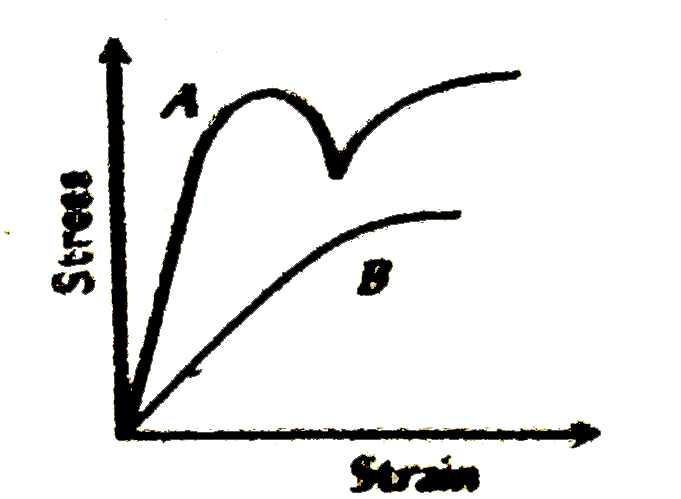 AA is brittle but B is ductileBA is ductile and B is brittleCBoth A and B are ductileDBoth A and B are brittle
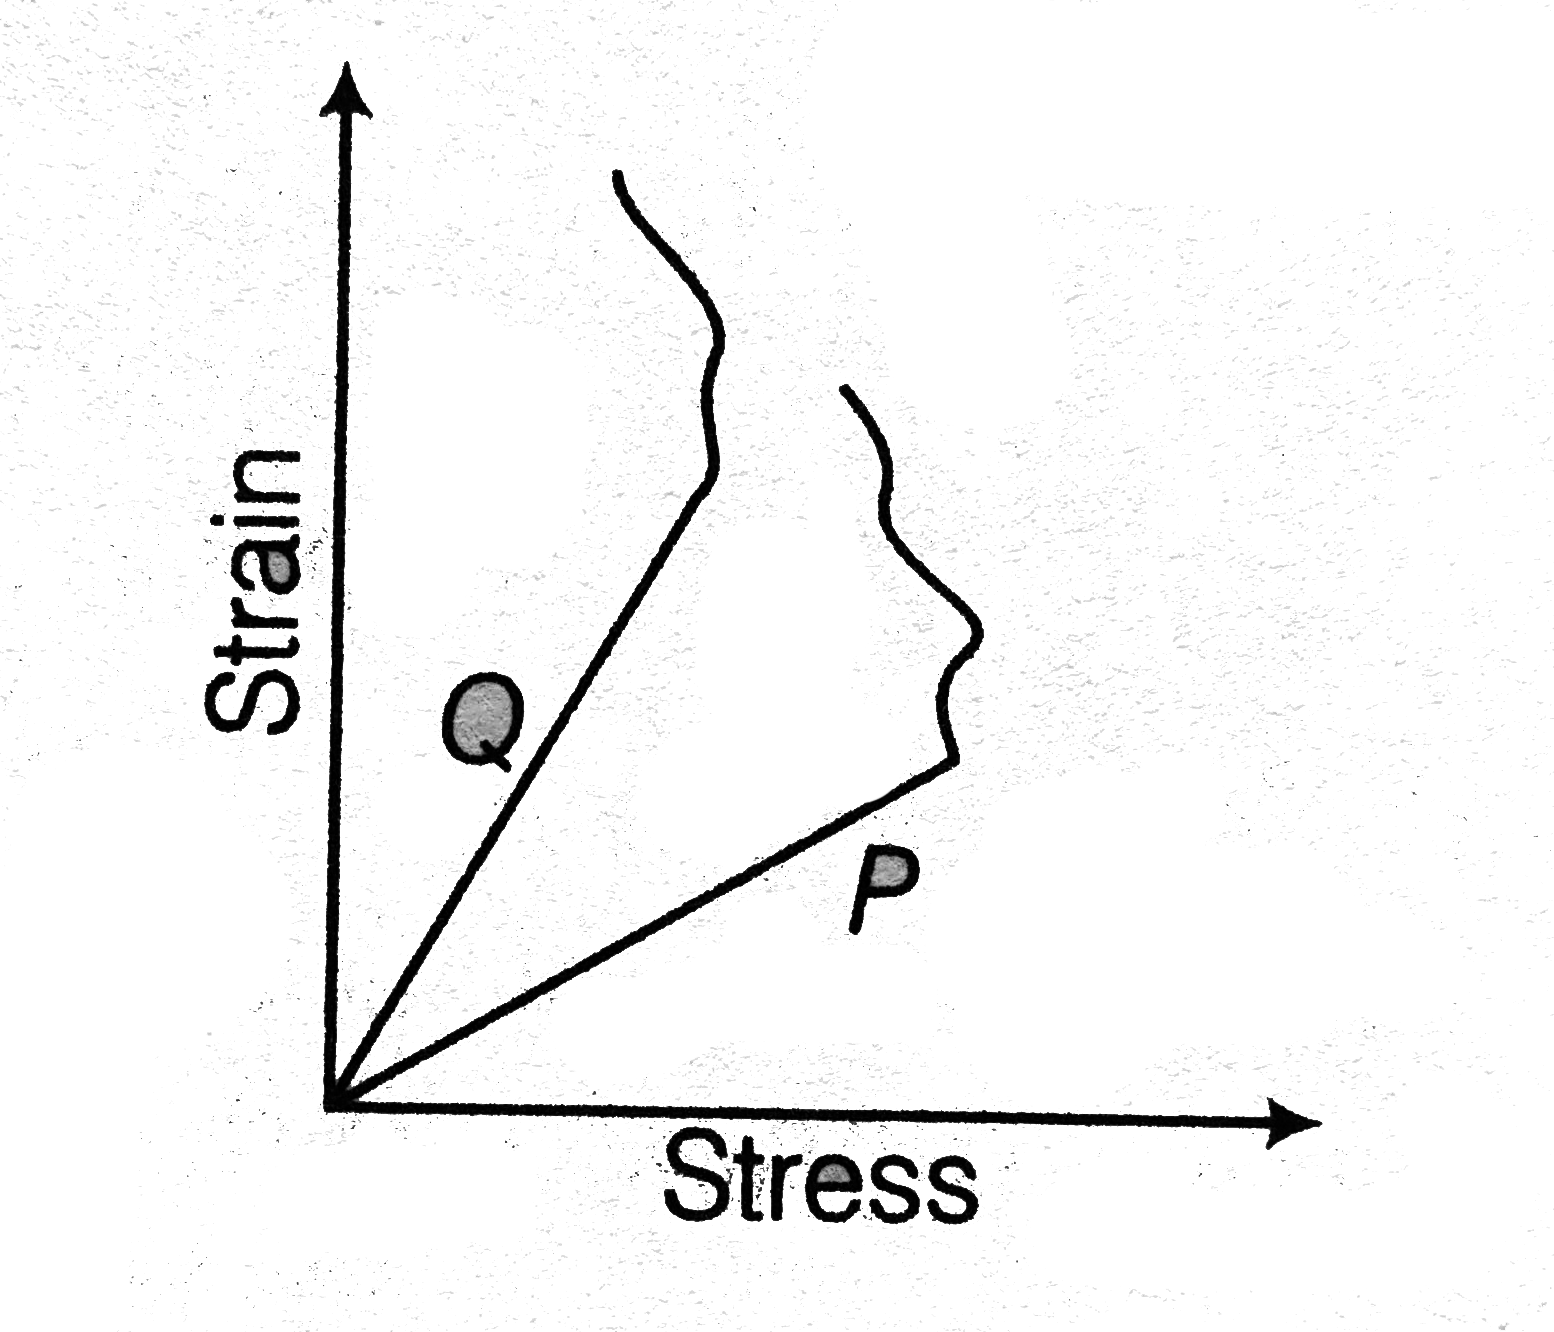
Figure shows the stress-strain curve of two metals P and Q. From the graph, it can be concluded that
View Solution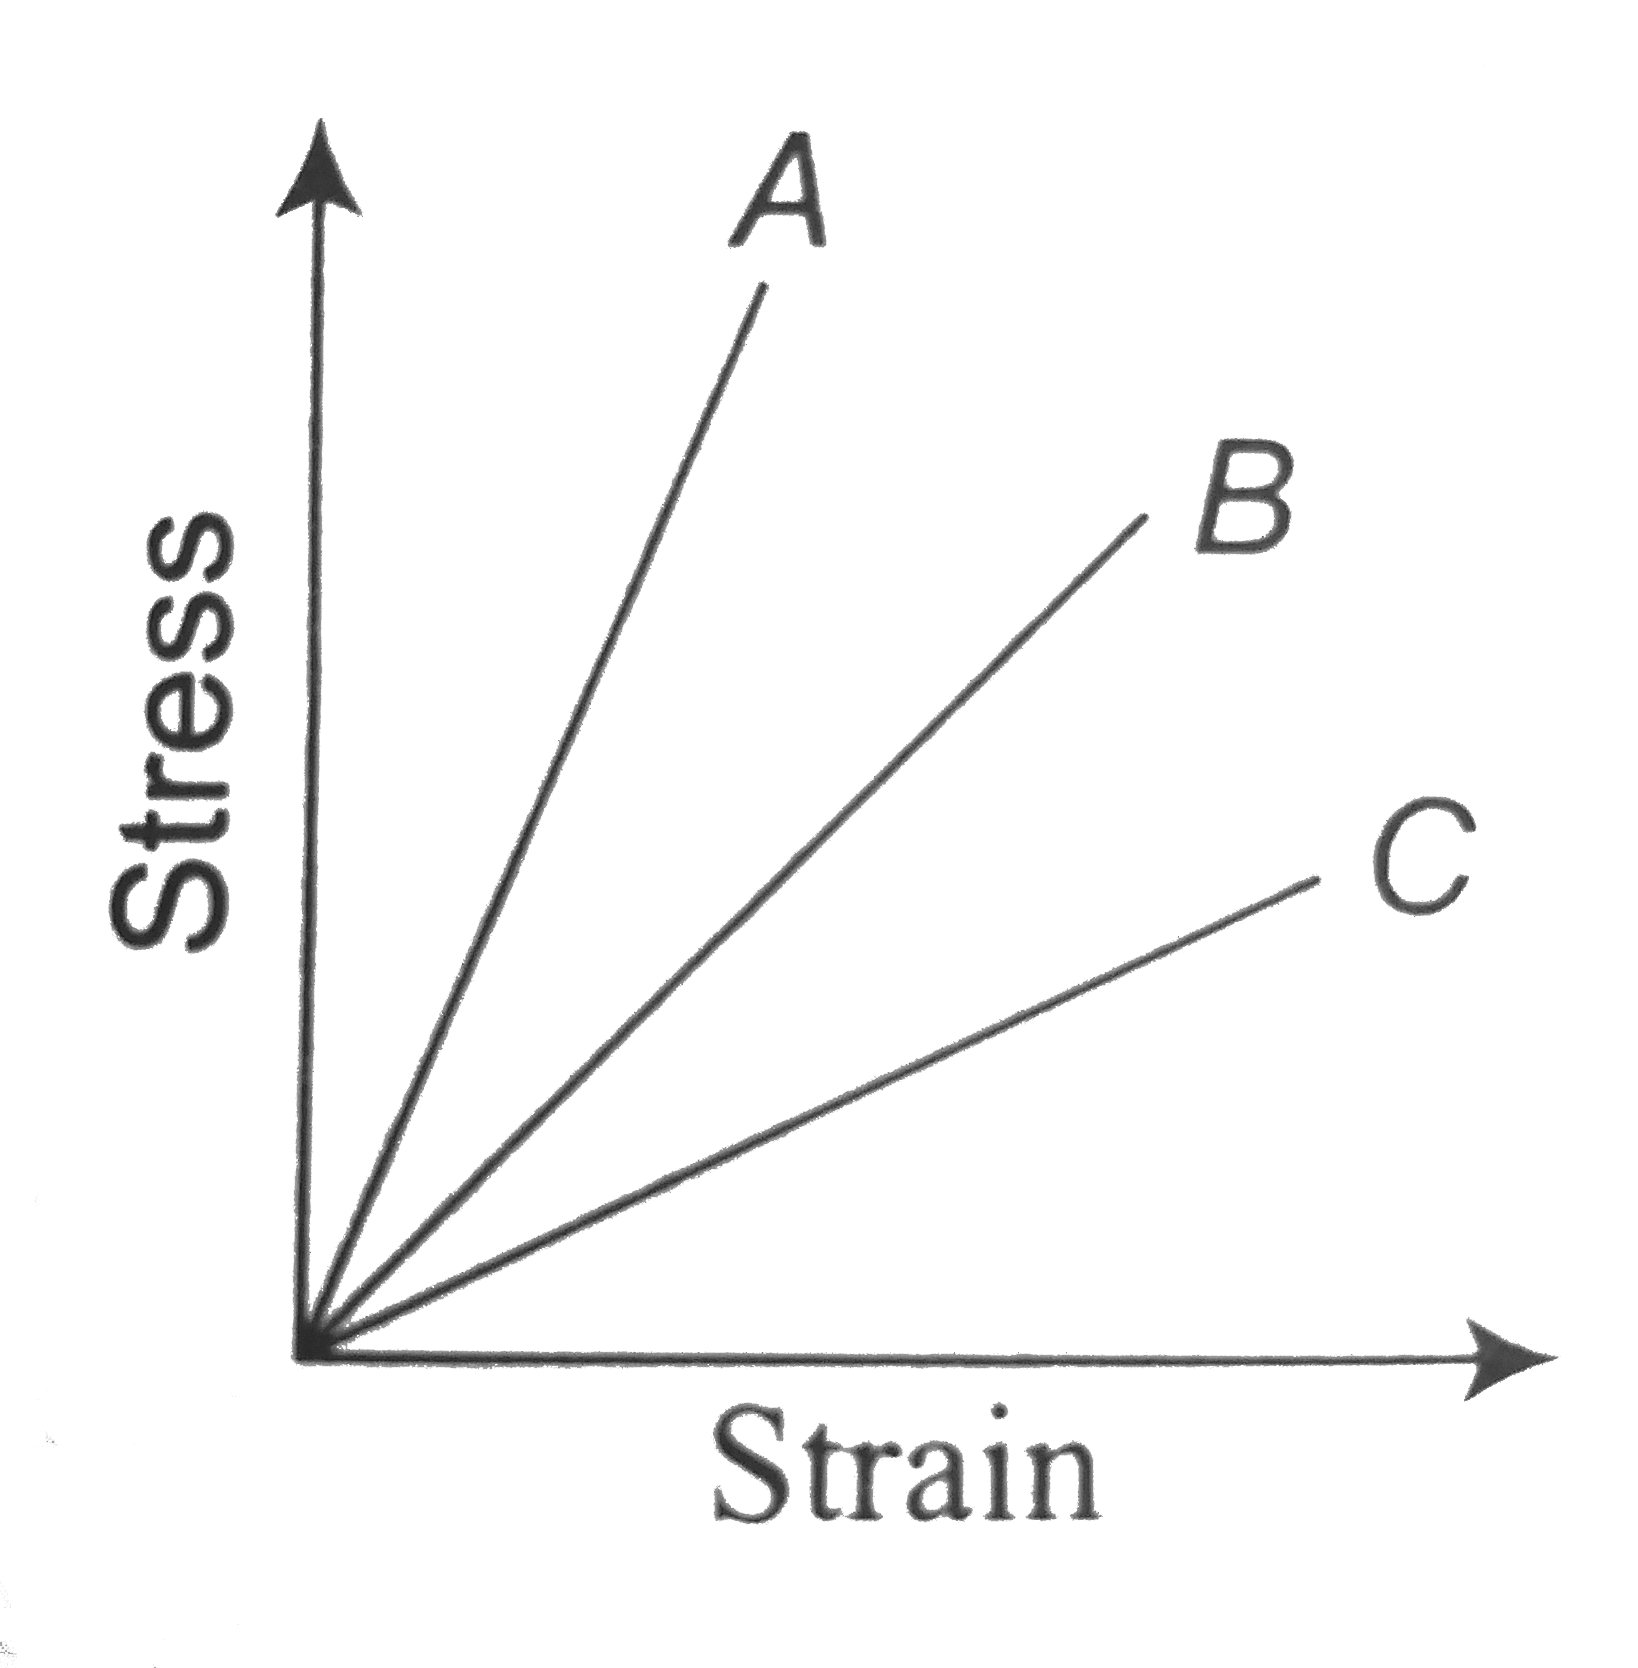
The stress strain curves for brass, steel and rubber are shown in the figure. The lines A, B and C are for
View Solution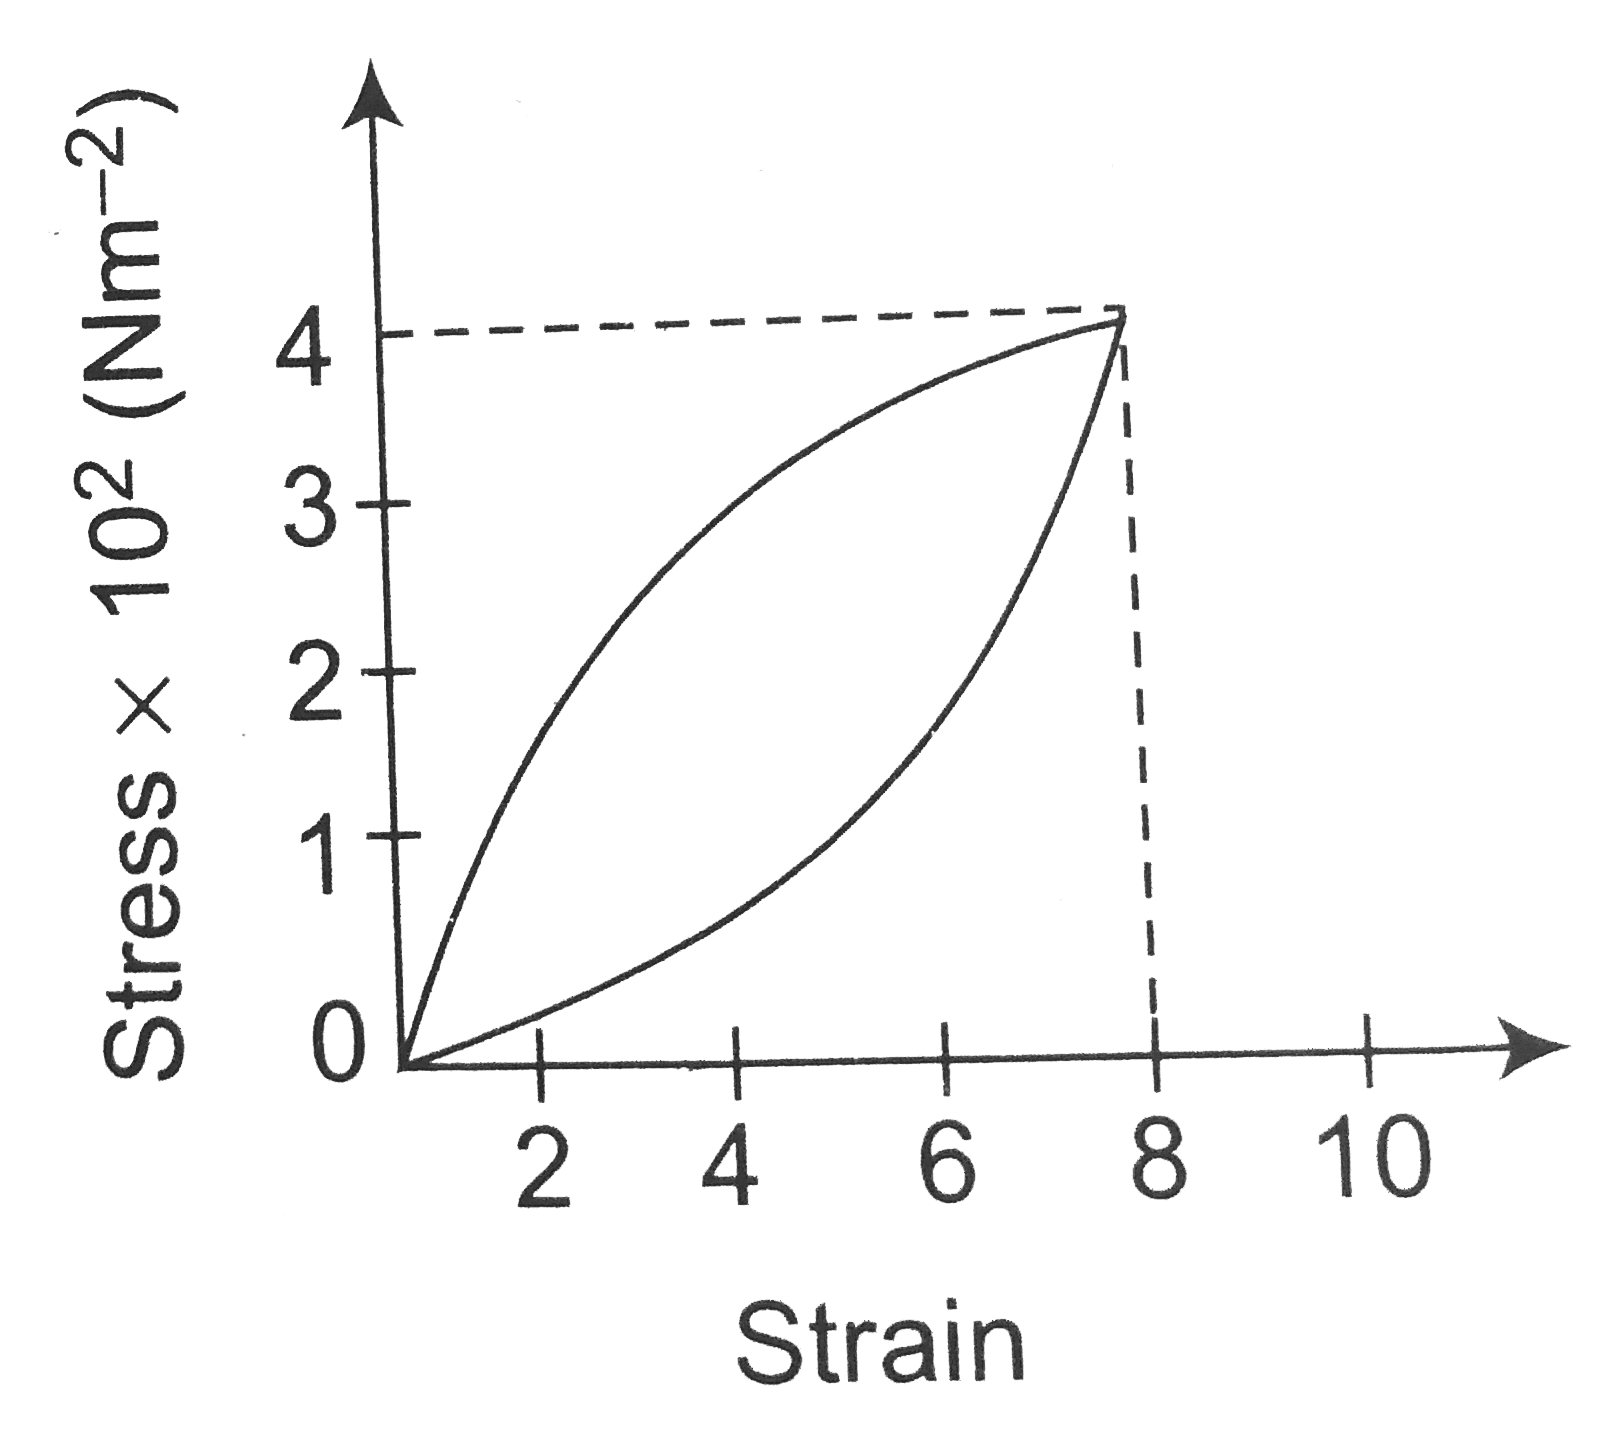
A rubber of volume 2000 cc is alternately subjected to tension and released. The figure shown the stress-strain curve of rubber. Each curve is a quadrant of an ellipse. The amount of energy lost as heat per cycle per unit volume will be
View SolutionThe point on the stress-strain curve at which the strain begins to increase even without any increase in the stress is
View SolutionWhich of the following is the graph showing stress-strain variation for elastomers ?
View Solution

